Genome-Wide Association Study Singles Out
SCD
and
LEPR
as the Two Main Loci
Influencing Intramuscular Fat Content and
Fatty Acid Composition in Duroc Pigs
Roger Ros-Freixedes1
*, Sofia Gol1, Ramona N. Pena1, Marc Tor1, Noelia Ibá
ñ ez-Escriche1,2, Jack C. M. Dekkers3, Joan Estany1*
1Departament de Ciència Animal, Universitat de Lleida–Agrotecnio Center, Lleida, Catalonia, Spain,
2IRTA, Genètica i Millora Animal, Lleida, Catalonia, Spain,3Department of Animal Science, Iowa State University, Ames, Iowa, United States of America
*[email protected](RRF);[email protected](JE)
Abstract
Intramuscular fat (IMF) content and fatty acid composition affect the organoleptic quality and nutritional value of pork. A genome-wide association study was performed on 138 Duroc pigs genotyped with a 60k SNP chip to detect biologically relevant genomic variants influencing fat content and composition. Despite the limited sample size, the genome-wide association study was powerful enough to detect the association between fatty acid compo-sition and a known haplotypic variant inSCD(SSC14) and to reveal an association of IMF and fatty acid composition in theLEPRregion (SSC6). The association ofLEPRwas later validated with an independent set of 853 pigs using a candidate quantitative trait nucleotide. TheSCDgene is responsible for the biosynthesis of oleic acid (C18:1) from stearic acid. This locus affected the stearic to oleic desaturation index (C18:1/C18:0), C18:1, and satu-rated (SFA) and monounsatusatu-rated (MUFA) fatty acids content. These effects were consis-tently detected ingluteus medius,longissimus dorsi, and subcutaneous fat. The
association ofLEPRwith fatty acid composition was detected only in muscle and was, at least in part, a consequence of its effect on IMF content, with increased IMF resulting in more SFA, less polyunsaturated fatty acids (PUFA), and greater SFA/PUFA ratio. Marker substitution effects estimated with a subset of 65 animals were used to predict the genomic estimated breeding values of 70 animals born 7 years later. Although predictions with the whole SNP chip information were in relatively high correlation with observed SFA, MUFA, and C18:1/C18:0 (0.48–0.60), IMF content and composition were in general better pre-dicted by using only SNPs at theSCDandLEPRloci, in which case the correlation between predicted and observed values was in the range of 0.36 to 0.54 for all traits. Results indicate that markers in theSCDandLEPRgenes can be useful to select for optimum fatty acid pro-files of pork.
OPEN ACCESS
Citation:Ros-Freixedes R, Gol S, Pena RN, Tor M, Ibáñez-Escriche N, Dekkers JCM, et al. (2016)
Genome-Wide Association Study Singles OutSCD
andLEPRas the Two Main Loci Influencing Intramuscular Fat Content and Fatty Acid Composition in Duroc Pigs. PLoS ONE 11(3): e0152496. doi:10.1371/journal.pone.0152496
Editor:Roberta Davoli, University of Bologna, ITALY
Received:September 2, 2015
Accepted:March 15, 2016
Published:March 29, 2016
Copyright:© 2016 Ros-Freixedes et al. This is an open access article distributed under the terms of the Creative Commons Attribution License, which permits unrestricted use, distribution, and reproduction in any medium, provided the original author and source are credited.
Data Availability Statement:The authors confirm that all data underlying the findings are fully available without restriction. All relevant data are within the paper and its Supporting Information files. Genotypic data are available athttp://hdl.handle.net/10459.1/ 49297.
Funding:This research was funded by the Spanish
Ministry of Economy and Competitiveness (MINECO; grants AGL2012-33529 and AGL2015-65846-R).
Introduction
Intramuscular fat (IMF) content and fatty acid (FA) composition affect both organoleptic qual-ity and nutritional value of pork and, thus, there is increasing interest in including these traits in the selection objectives of pigs bred for quality pork markets. Saturated (SFA) and monoun-saturated FA (MUFA) are related to better sensory attributes and technological properties [1], while polyunsaturated FA (PUFA) and MUFA are nutritionally more desirable [2]. Oleic acid (C18:1) is the most abundant FA in pork and it can be regarded as a good target for the simul-taneous improvement of organoleptic, technological, and nutritional attributes of pork. Both IMF and FA contents display substantial genetic variation, even within purebred lines [3,4].
During the last decades, a lot of efforts have been put into the detection of quantitative trait loci (QTL) affecting IMF content and FA composition using low-density microsatellite linkage maps [5–8]. However, most of these QTL were detected in experimental crosses and, to our
knowledge, they have not been used in commercial breeding programs [9]. An exception is the QTL in theSus scrofachromosome (SSC) 14 affecting SFA and MUFA in purebred Duroc [10,11], which has been matched to a haplotype of three single nucleotide polymorphisms (SNPs) in the promoter region of the stearoyl-CoA desaturase (SCD) gene [12].
The onset of high-density SNP genotyping arrays has enabled a more precise scanning of the genome to detect quantitative trait loci (QTL) and nucleotides (QTN) and to make geno-mic predictions of breeding values. Genome-wide association studies (GWAS) on FA composi-tion have been performed mostly in experimental crosses [13–15], but there are very few
reports for commercial pig populations [16]. Moreover, the accuracy of genomic prediction for IMF content and FA composition in swine has not been assessed. The main objective of this study was to detect genomic variants exhibiting a strong influence on fat content and composi-tion traits, particularly of IMF, in a commercial Duroc populacomposi-tion used for producing high quality pork. A secondary objective was to assess whether GWAS on limited high-density SNP data is powerful enough to detect the effect of theSCDhaplotype on SFA and MUFA, which segregates in the studied population. The potential use of genomic prediction for these traits is discussed in light of the results obtained.
Materials and Methods
Ethics Statement
The experimental protocol was approved by the Committee on the Ethics of Animal Experi-ments of the University of Lleida.
Animals and data
We genotyped 138 purebred Duroc barrows from the commercial line described in [4] using the PorcineSNP60 v2 Genotyping BeadChip (Illumina, CA). Animals were chosen to be as unrelated as possible. The offspring of 54 sires and 126 dams were chosen to be genotyped. Half of the animals (n = 66, from 29 sires and 57 dams) were born in 2002–2003, and the other
half (n = 72, from 25 sires and 69 dams) in 2009–2010. There was no detectable subpopulation
structure between pigs from both time periods [17]. All animals were raised in 6 batches (3 batches for each period, with 19 to 26 genotyped animals per batch) under commercial condi-tions and fedad libitumwith a pelleted finishing diet from 160 days of age until slaughter. The average composition of the diet was 16.9% crude protein, 6.6% fiber, and 6.7% fat (C16:0: 20.8%, C18:0: 7.1%, C18:1: 35.4%, C18:2: 27.4%). Animals were slaughtered in the same com-mercial abattoir at 215.6 (7.9 SD) days of age and 127.7 kg (10.9 SD) of body weight. Carcass backfat thickness (BT, n = 131) at 6 cm off the midline between the third and fourth last ribs filed by University of Lleida on the use of markers of
was measured by an on-line ultrasound automatic scanner (AutoFOM, SFK-Technology, Her-lev, Denmark). Immediately after slaughter, a sample of subcutaneous fat (SF, n = 112) at the level of the third and fourth ribs was collected. After chilling for about 24 h at 2°C, samples of the musclesgluteus medius(GM, n = 138) andlongissimus dorsiat the level of the third and fourth ribs (LD, n = 138) were also collected. The IMF content and FA composition of the sam-ples were determined in duplicate by quantitative determination of the individual FA by gas chromatography [18]. The IMF content was calculated as the sum of each individual FA expressed as triglyceride equivalents [19] and expressed as percentage of fresh sample. Individ-ual and total SFA, MUFA, and PUFA contents were expressed as the percentage relative to total FA. The desaturation ratio of oleic to stearic acid (C18:1/C18:0) and the ratio SFA/PUFA were calculated. Means and range of values observed for each trait are detailed inTable 1. The phenotypes of the genotyped animals were representative of the ranges observed in the whole population. DNA was isolated as described in [12] and used for SNP genotyping with the Por-cineSNP60 v2 Genotyping BeadChip (Illumina, CA).
Given the GWAS results, two candidate QTN from the most associated regions were geno-typed posteriorly for validation purposes. These two additional SNPs were genogeno-typed in an independent set of 853 pigs sampled from all years since 2002 until 2013. The first SNP was the polymorphism AY487830:g.2228T>Cin theSCDpromoter [12], which was genotyped by real
Table 1. Mean and range of phenotypic values and posterior means of marker-based additive genetic (σ2a) and residual (σ 2
e) variances and
heritabil-ity (h2).
Trait1 Phenotypes Posterior mean of variance components
Mean Range σ2a σ2e h2
Backfat thickness, mm 22.98 12.7–30.1 4.19 7.14 0.37
Musclegluteus medius
Intramuscular fat, % 5.07 2.2–9.5 1.00 0.90 0.53
SFA, % 38.62 34.9–45.5 1.48 0.73 0.67
MUFA, % 48.41 42.0–52.9 1.76 0.70 0.72
C18:1, % 44.06 38.1–48.7 1.42 0.62 0.70
PUFA, % 12.97 8.6–17.7 1.50 1.05 0.59
C18:1/C18:0 3.65 2.4–4.8 0.087 0.044 0.66
SFA/PUFA 3.05 2.0–4.7 0.095 0.118 0.45
Musclelongissimus dorsi
Intramuscular fat, % 3.49 1.5–6.8 0.60 0.50 0.54
SFA, % 39.58 33.5–48.2 1.81 0.93 0.66
MUFA, % 49.48 44.8–54.8 1.73 1.00 0.63
C18:1, % 44.86 39.1–50.5 1.46 1.11 0.57
PUFA, % 10.94 6.9–16.3 1.99 0.85 0.70
C18:1/C18:0 3.58 2.1–5.2 0.082 0.046 0.64
SFA/PUFA 3.76 2.2–7.0 0.132 0.297 0.31
Subcutaneous fat
SFA, % 37.94 29.7–44.5 1.41 2.06 0.41
MUFA, % 44.94 39.1–50.9 1.63 1.49 0.52
C18:1, % 41.89 36.4–47.3 1.48 1.31 0.53
PUFA, % 17.12 12.1–22.1 1.22 1.48 0.45
C18:1/C18:0 3.34 2.3–4.9 0.072 0.069 0.51
SFA/PUFA 2.26 1.4–3.5 0.050 0.050 0.47
1SFA, MUFA, PUFA: saturated, monounsaturated, and polyunsaturated fatty acids; C18:1: oleic acid; C18:0: stearic acid.
time qPCR (7500 Sequence Detection System, LifeTechnologies) with an allelic discrimination assay (Custom TaqMan SNP Genotyping Assays, LifeTechnologies). The second polymor-phism, at exon 14 of theLEPRgene (NM_001024587:c.1987C>T) [20], was genotyped by High Resolution Melt analysis (Luminaris Color HRM Master Mix, Thermo Scientific) in a real time thermocycler (CFX-100, Bio-Rad). Primers used for genotyping these SNPs are detailed inS1 Table. The concentration of leptin in blood plasma at 180 days of age after overnight fasting was analyzed in a subset of animals (n = 73) using a porcine leptin ELISA kit (Diagnostic Sys-tems Laboratories, Inc., Webster, TX) [21]. All samples were evaluated in a double assay. The coefficient of variation between replicates was 7%.
High-density SNP data quality control
The PLINK software [22] was used to filter out SNPs with minor allele frequency below 0.05 and genotyping rate below 0.95, and individuals with more than 10% missing genotypes. Unmapped SNPs based on the current pig genome assemblySus scrofaBuild 10.2 were also excluded. The remaining data comprised 135 individuals and 36,432 SNPs.
Genome-wide association study
Associations of SNP genotypes with the phenotypes were analyzed using the Bayes B approach [23] implemented in the GenSel software [24]. The basic model was
y¼XbþX
k
j¼1
zja
jdjþe;
whereyis the phenotypes vector,Xis the incidence matrix relatingfixed factors to phenotypes,
bis the vector offixed effects,zjis the vector of (coded) genotypes for a SNP at locusj(j= 1 to
k, wherekis the number of SNPs),α
jis the allele substitution effect of the SNP at locusj,δjis a
random 0/1 variable that represents the absence or presence (with prior probabilitiesπand 1
−π, respectively) of SNPjin the model for a given iteration of the Markov chain Monte Carlo
procedure, andeis the vector of random residuals, assumed to be normally distributed. Alter-nate homozygous genotypes were coded as -10 and 10, heterozygotes as 0, and missing geno-types as the average value in the population. Fixed effects included batch as a class variable and age at slaughter as a covariate. Intramuscular FA composition traits were analyzed with and without IMF content as an additional covariate. Due to the limited number of animals in the study, the prior proportion of SNPs considered to have no effect on the trait (δ
j= 0) wasfixed
toπ= 0.997, so that the modelfitted ~110 SNPs per iteration. Variance components used as
priors were estimated as in [4] with the full pedigree (111,305 individuals) and all available phenotypic data (106,276 records for BT and 1,355 records for IMF and FA). A total of 750,000 iterations with a burn-in of 250,000 were run for the analyses. The statistical relevance of the association of individual markers with each trait was evaluated calculating the Bayes Factor for each locusj(BFj) [25,26] as
BFj¼
^ pj 1 ^pj ð1 pÞ
p
;
wherep^jis the posterior probability of a SNP at locusjof being included in the model at a
given iteration of the Markov chain Monte Carlo procedure. Evidence of association was con-sidered "substantial" for BFjabove 3.2, "strong" above 10, and "decisive" above 100 [27]. Linkage
percentage of genetic variance explained by the individual markers was calculated. To take account of the linkage disequilibrium between SNPs, for each individual we predicted collec-tively the genomic merit of all SNPs within 1-Mb non-overlapping windows (based on Build 10.2 of the swine genome) and used these values to calculate the proportion of total genetic var-iance explained by the 1-Mb windows, as detailed in [29]. The average number of SNPs per window was 14.2. Regions that accounted for at least 2.5% of the genetic variance of a trait were considered as candidate regions. Combinations of contiguous windows that explained at least 0.5% of genetic variance were also considered to take into account, in turn, SNPs in link-age disequilibrium spanning more than 1 Mb. Candidate genes in these regions were retrieved from Ensembl (EMBL-EBI) and functional gene annotation was based on Enrichr gene analysis tool [30].
In view of the results, genome-wide associations were reanalyzed after addingSCD g.2228T>CandLEPR c.1987C>Tto the SNPs of the chip. The association of SNPLEPR c.1987C>Twith leptin concentration in plasma and with the studied traits was analyzed in an independent set of 853 pigs using a model with age at slaughter as a covariate and batch and genotype as class variables. This analysis was performed under a Bayesian setting with Rabbit software [31].
Genomic prediction
We used the animals born in 2002–2003 as training data to estimate the SNP effects and then
to predict the genomic estimated breeding values (GEBV) of the animals born in 2009–2010.
The effect of each SNP was estimated using the same procedure as for GWAS but using only the training set (n = 65). The GEBV of an individualiin the testing dataset was predicted as
GEBVi¼ Xk
j¼1 zij^aj;
where zijis the genotype of animalifor a SNP at locusj(j= 1 tok, wherekis the number of
SNPs) coded as above, and^a
jis the allele substitution effect estimate for the SNP at locusj
based on the analysis of the training dataset. The correlation between GEBV and the adjusted phenotypic values of the testing dataset was used as a measure of the prediction accuracy. Phe-notypes were adjusted for batch and age at slaughter using afixed model. In view of the GWAS results,five different sets of SNPs were evaluated for their predictive ability: (1) all SNPs in the chip, (2) onlySCD g.2228T>C, (3) onlyLEPR c.1987C>T, (4) only these two SNPs together, or (5) all SNPs in the chip but excluding those in theSCDandLEPRregions detected by GWAS.
Results and Discussion
Genome-wide association study
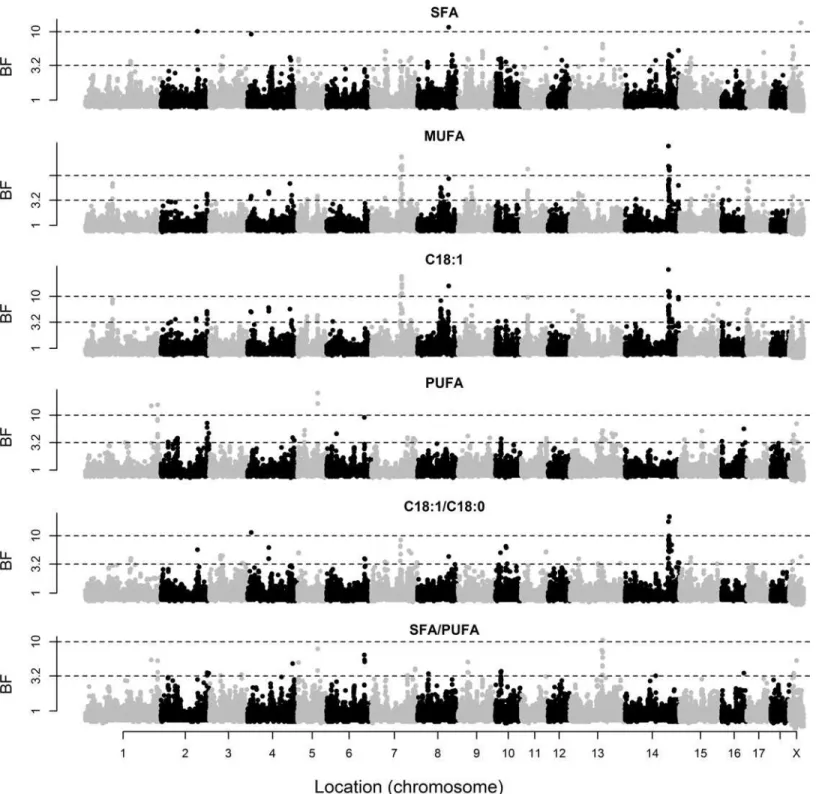
The posterior means of variance components and heritabilities based on the genotypic data are given inTable 1. The marker-based heritabilities ranged from 0.31 to 0.72, indicating that the SNP genotypes explained a relevant proportion of the phenotypic variance of these traits. Marker-based heritabilities were particularly high for FA composition of the two muscles. The BF of individual markers for BT and IMF content and composition of GM are shown inFig 1, and those of LD and SF are in Figs2and3, respectively. A summary of the regions that explained at least 2.5% of genetic variance is given inTable 2.
highest association. No candidate genes were found in this region, butNFKBIE(linked with the adipocytokine signaling path) andSLC29A1(related to abnormal eating behavior) lie in its vicinity. Interesting candidate genes for BT were found in the SSC8 region at 144–148 Mb
(1.3%), containingAGPAT9,GK2, andSCD5, all three related to FA and triglyceride metabo-lism, andBMP3, which is involved in adipogenesis.
In contrast, strong signals for IMF content and FA composition traits were located on SSC6 (BF up to 738.3) and SSC14 (BF up to 97.3), which are zoomed in in Figs4and5, respectively. The SNPs with the greatest effect on IMF content in GM were on SSC6 (ALGA0037129 and H3GA0053839 at 135.8 and 136.0 Mb, respectively). These SNPs also had the strongest associa-tions with SFA, followed by several SNPs on SSC14 (121–122 Mb), which, in turn, had the
strongest associations with MUFA (as well as markers ALGA0069671 at SSC13 and M1GA0023830 at SSCX). The situation for C18:1 as an individual FA was similar to that of MUFA. The SNP with the greatest effect on PUFA was ASGA0089937 (SSC6 at 135.3 Mb), fol-lowed by ASGA0093565 and H3GA0053839 at very close locations (and DRGA0008753 at SSC8). The SNPs on SSC14 at 121–122 Mb and SSC6 at 135–136 Mb also showed the strongest
associations with the C18:1/C18:0 and SFA/PUFA ratios, respectively. A similar pattern was observed in LD, except for IMF content, for which the strongest association was found on SSC11 (19.4–20.3 Mb). The signal on SSC14 was also detected for SF composition traits, but
not the signal on SSC6.
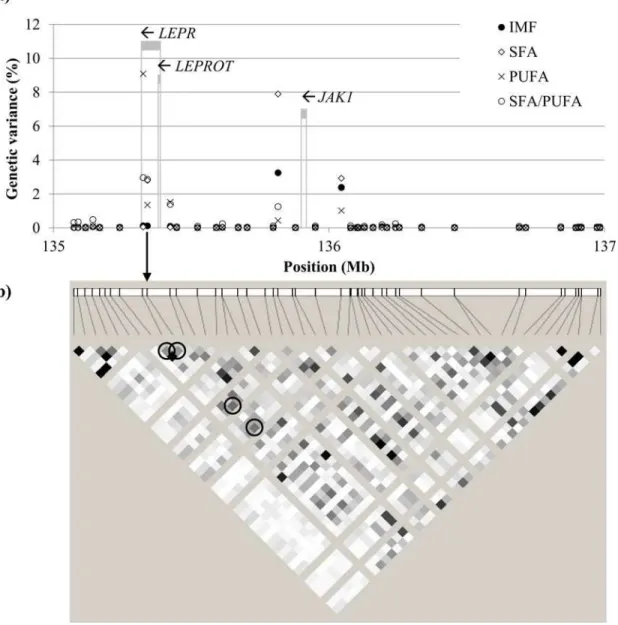
The window on SSC6 at 135–136 Mb accounted for 3.1% of the genetic variance of IMF in
GM, and 4.9% together with the contiguous window at 136–137 Mb. This percentage of genetic
variance was explained essentially by four SNPs in linkage disequilibrium (Fig 4). In this region multiple QTL for feed intake, carcass fatness, BT, and IMF have been reported [32]. The 135–
136 Mb window includes two overlapping genes, the leptin receptor (LEPR) and the leptin receptor overlapping transcript (LEPROT), which share the two first exons (Fig 4). Leptin is an adipocytokine that regulates energy intake and expenditure through interaction with its recep-tor. TheLEPROTgene encodes a protein that negatively regulates the presence of leptin recep-tors in the cell surface, decreasing the response to leptin. A non-synonymous polymorphism in the exon 14 ofLEPR(p.Leu663Phe) has been reported as the probable causative mutation asso-ciated with increased feed intake and fatness [20]. The allele T was significantly assoasso-ciated with a lower mRNA expression in the hypothalamus and with the downregulation of the gene
CART(negative regulation of appetite) and the upregulation ofNPY(positive regulation of appetite) [33]. The same allele has been also widely and consistently associated with increased fatness traits, including both BT and IMF [34–38]. There is less evidence for the other SNPs
found inLEPRin pigs [39–41]. The significant signal in this region reaches out about 0.6 Mb,
starting in theLEPR/LEPROTlocus and finishing downstream theJAK1gene. Interestingly, the signal transductor coded byJAK1, which maps to 135.9 Mb (Fig 4), is also involved in the adipocytokine signaling pathway, promoting the leptin-induced transactivation of the satiety neuropeptideNPYgene [42]. Mutations inJAK1have not been related to fattening traits in pigs before.
In our study, the 135–136 Mb window was also strongly associated with FA composition,
both in GM and LD. In particular, the 135–137 Mb extended region explained the greatest
per-centage of genetic variance for SFA (17.6%), PUFA (16.9%), and SFA/PUFA (21.7%) in GM and, to a lesser extent, in LD (14.7%, 2.2%, and 3.0%, respectively). However, when adjusting
Fig 1. Bayes factors of individual markers for backfat thickness (BT) and intramuscular fat (IMF) content and composition ofgluteus medius.Fatty acid composition includes saturated (SFA), monounsaturated (MUFA), and polyunsaturated (PUFA) fatty acids, individual oleic acid (C18:1), and the ratios of oleic to stearic acid (C18:1/C18:0) and SFA/PUFA. The discontinuous lines indicate Bayes Factors of 3.2 (substantial evidence), 10 (strong), and 100 (decisive).
for IMF, the genetic variance explained by this region decreased to 0.4–6.1%, indicating that, at
least in part, the observed associations of the SNPs in this region with SFA and PUFA are an indirect effect of differences in IMF, as also noted by Galveet al. [35]. It is well known that the
Fig 3. Bayes factors of individual markers for subcutaneous fat composition.Fatty acid composition includes saturated (SFA), monounsaturated (MUFA), and polyunsaturated (PUFA) fatty acids, individual oleic acid (C18:1), and the ratios of oleic to stearic acid (C18:1/C18:0) and SFA/PUFA. The discontinuous lines indicate Bayes Factors of 3.2 (substantial evidence), 10 (strong), and 100 (decisive).
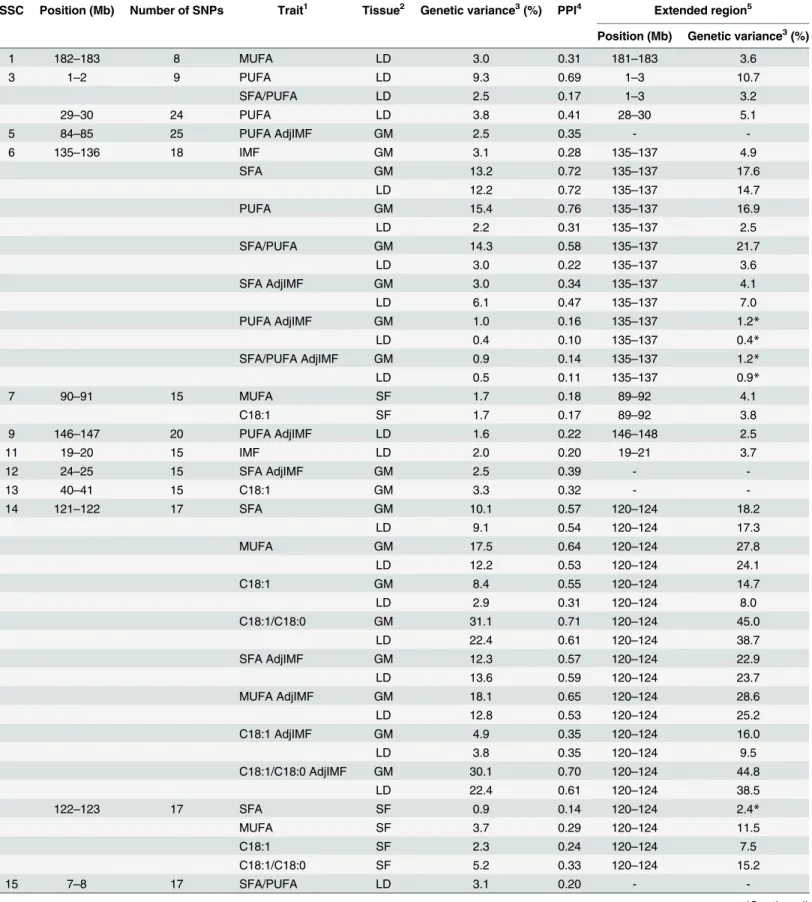
Table 2. Candidate regions for intramuscular fat content and fatty acid composition traits.
SSC Position (Mb) Number of SNPs Trait1 Tissue2 Genetic variance3(%) PPI4 Extended region5
Position (Mb) Genetic variance3(%)
1 182–183 8 MUFA LD 3.0 0.31 181–183 3.6
3 1–2 9 PUFA LD 9.3 0.69 1–3 10.7
SFA/PUFA LD 2.5 0.17 1–3 3.2
29–30 24 PUFA LD 3.8 0.41 28–30 5.1
5 84–85 25 PUFA AdjIMF GM 2.5 0.35 -
-6 135–136 18 IMF GM 3.1 0.28 135–137 4.9
SFA GM 13.2 0.72 135–137 17.6
LD 12.2 0.72 135–137 14.7
PUFA GM 15.4 0.76 135–137 16.9
LD 2.2 0.31 135–137 2.5
SFA/PUFA GM 14.3 0.58 135–137 21.7
LD 3.0 0.22 135–137 3.6
SFA AdjIMF GM 3.0 0.34 135–137 4.1
LD 6.1 0.47 135–137 7.0
PUFA AdjIMF GM 1.0 0.16 135–137 1.2*
LD 0.4 0.10 135–137 0.4*
SFA/PUFA AdjIMF GM 0.9 0.14 135–137 1.2*
LD 0.5 0.11 135–137 0.9*
7 90–91 15 MUFA SF 1.7 0.18 89–92 4.1
C18:1 SF 1.7 0.17 89–92 3.8
9 146–147 20 PUFA AdjIMF LD 1.6 0.22 146–148 2.5
11 19–20 15 IMF LD 2.0 0.20 19–21 3.7
12 24–25 15 SFA AdjIMF GM 2.5 0.39 -
-13 40–41 15 C18:1 GM 3.3 0.32 -
-14 121–122 17 SFA GM 10.1 0.57 120–124 18.2
LD 9.1 0.54 120–124 17.3
MUFA GM 17.5 0.64 120–124 27.8
LD 12.2 0.53 120–124 24.1
C18:1 GM 8.4 0.55 120–124 14.7
LD 2.9 0.31 120–124 8.0
C18:1/C18:0 GM 31.1 0.71 120–124 45.0
LD 22.4 0.61 120–124 38.7
SFA AdjIMF GM 12.3 0.57 120–124 22.9
LD 13.6 0.59 120–124 23.7
MUFA AdjIMF GM 18.1 0.65 120–124 28.6
LD 12.8 0.53 120–124 25.2
C18:1 AdjIMF GM 4.9 0.35 120–124 16.0
LD 3.8 0.35 120–124 9.5
C18:1/C18:0 AdjIMF GM 30.1 0.70 120–124 44.8
LD 22.4 0.61 120–124 38.5
122–123 17 SFA SF 0.9 0.14 120–124 2.4*
MUFA SF 3.7 0.29 120–124 11.5
C18:1 SF 2.3 0.24 120–124 7.5
C18:1/C18:0 SF 5.2 0.33 120–124 15.2
15 7–8 17 SFA/PUFA LD 3.1 0.20 -
endogenous synthesis of SFA and MUFA increases with IMF content, which leads PUFA to proportionally decrease [43].
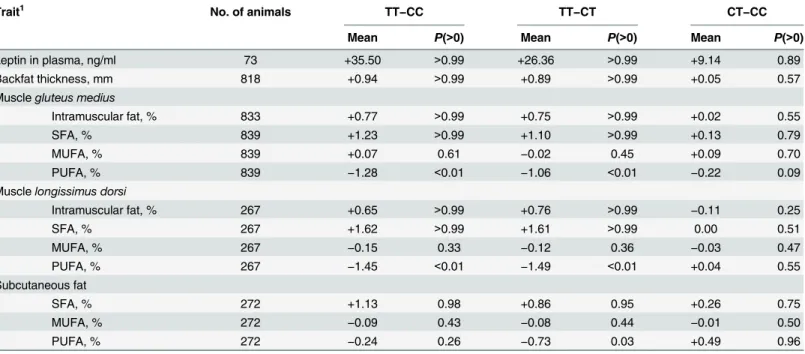
The association of theLEPRlocus with fat-related traits was further evaluated on an inde-pendent set of 853 pigs using the putative causative mutationLEPR c.1987C>T[20]. Pigs with the TT genotype (allele T frequency = 0.43) for this SNP had higher leptin concentration in plasma, were fatter (both BT and IMF), and had more saturated fat than CC pigs (Table 3). This analysis showed differences betweenLEPRgenotypes also for the FA composition of SF, not detected by GWAS but in line with the findings by Muñozet al. [34] and Galveet al. [35]. Similar results were obtained with the SNP ASGA0089937 included in the chip as a tag SNP (in intron 3 of theLEPRgene; Genbank accession number FN677933.1). In fact, the four SNPs in the chip showing the strongest associations were the ones in greatest linkage disequilibrium withLEPR c.1987C>T(Fig 4), for which very similar genome-wide associations were found if added to the GWAS. The BF of the association ofLEPR c.1987C>Twith IMF was 6.3, and ran-ged from 38.3 to 93.9 with SFA, PUFA, and SFA/PUFA. Taken together, these results support that a mutation in (or near) theLEPRgene affects the leptin regulatory system, similarly to what has been observed in humans [44,45]. As a consequence, it affects feed intake and overall carcass fatness.
On the other hand, the region on SSC14 at 120–124 Mb was found to be strongly associated
with SFA, MUFA, C18:1, and the desaturation index C18:1/C18:0. The most associated win-dow was located either at 121–122 Mb, for the muscles, or at 122–123 Mb, for SF. This region,
which was estimated to capture up to 44.8% of the genetic variance of C18:1/C18:0, corre-sponds to the location of theSCDgene (Fig 5), thereby confirming the association between an haplotype in the promoter of theSCDgene and the desaturation of C18:0 to C18:1 that was already found in the same population by Estanyet al. [12]. The SCD enzyme is rate-limiting for the biosynthesis of MUFA C18:1 from SFA C18:0. Due to the high linkage disequilibrium downstream theSCDposition (Fig 5), the signal detected spanned 4 Mb and included other genes involved in lipid metabolism, such asELOVL3(responsible for the elongation of long-chain SFA and MUFA),CHUK(involved in the adipocytokine signalling pathway),CYP17A1
(direct role in steroidogenesis), andPITX3(related to feeding behavior and to abnormal adi-pose tissue). The percentages of genetic variance explained by this region for SFA (16.1% in GM and 16.3% in LD), MUFA (27.4% and 22.7%, respectively), C18:1 (14.1% and 8.0%, respec-tively), and C18:1/C18:0 (41.5% and 37.2%, respectively) were close to those obtained when only accounting for the effect of theSCDhaplotypes [12]. Moreover, the explained genetic vari-ance did not depend on IMF, which confirms that sequence variation at this locus affects FA
Table 2. (Continued)
SSC Position (Mb) Number of SNPs Trait1 Tissue2 Genetic variance3(%) PPI4 Extended region5
Position (Mb) Genetic variance3(%)
18 22–23 10 PUFA LD 3.2 0.37 -
-1IMF: intramuscular fat content; SFA, MUFA, PUFA: saturated, monounsaturated, and polyunsaturated fatty acids; C18:1: oleic acid; C18:0: stearic acid;
AdjIMF: trait with intramuscular fat contentfitted in the model as a covariate.
2GM: musclegluteus medius(n = 135); LD: musclelongissimus dorsi(n = 135); SF: subcutaneous fat (n = 112). 3Posterior mean of the percentage of total genetic variance explained by the window.
4Posterior probability of inclusion (non-zero genetic variance). The average PPI for the windows explaining less than 0.5% of genetic variance was 0.04. 5To take account of potential linkage disequilibrium between SNPs, combinations of contiguous 1-Mb windows that explained at least 0.5% of genetic
variance were considered. Regions that explained at least 2.5% of genetic variance are shown. *Below 2.5% but shown due to the importance of the locus.
composition but not total IMF content [12]. The same association was found, although to a lesser extent, in SF. The BF forSCD g.2228T>Cif included in the analysis was 15.0 for SFA, 15.3 for MUFA, 27.1 for C18:1, and 7.1 for C18:1/C18:0. This polymorphism could affect the expression of theSCDgene by disrupting the RXR:RARαand PPARG transcription factor binding sites [12]. However, due to the linkage disequilibrium structure in this region, it was not possible to discriminate the candidate causative SNP from other markers downstream.
Other regions explaining more than 2.5% of genetic variance were found at SSC1, 3, 5, 7, 9, 11, 12, 13, 15, and 18. The region in SSC11 at 19–21 Mb, which was the most associated with
IMF in LD (3.7% of genetic variance), contained the genesRB1, involved in adipogenesis, and
Fig 4. Individual markers in the SSC6 at 135–137 Mb region.Panel (a) shows the percentage of genetic variance explained for intramuscular fat content (IMF), saturated fatty acids (SFA), polyunsaturated fatty acids (PUFA), and SFA/PUFA of musclegluteus medius. The SNP NM_001024587:c.1987C>Tin exon 14 ofLEPR, indicated with an arrow, is not provided in the chip. Grey stripes indicate the location of candidate genesLEPR(tentative),LEPROT, and JAK1, and arrows indicate sense of transcription. Panel (b) shows the linkage disequilibrium in the region (white: r2= 0; black: r2= 1). The SNPc.1987C
>Tis in high linkage disequilibrium with the four SNPs picking up the strongest signals (circled; from left to right: ASGA0089937, ASGA0093565, ALGA0037129, and H3GA0053839).
CYSLTR2, involved in lipid homeostasis. No functional candidate genes mapped to the other regions.
A previous GWAS performed by Yanget al. [15], using a Duroc × Erhualian F2cross and a
larger population size, did not reach much different results from ours, with theSCDlocus being the only reported QTL for major FA in IMF. Zhanget al. [16] found an association between theSCDlocus and FA in LD in commercial Duroc × (Landrace × Yorkshire) hybrids but not in the Chinese breeds Erhualian and Laiwu. Similarly, in the QTL genome scan with microsatellites performed by Uemotoet al. [11] in purebred Duroc, the only significant QTL in LD and outer SF layer was SSC14 at 90–113 cM for C18:1 and C18:0. None of their other
sug-gestive QTL for IMF composition matched those found in our study. The same SSC14 QTL was significant for melting point in inner and outer SF layers, a trait that is related to the desa-turation degree of fat. No coincident regions were found between our study and GWAS
Fig 5. Individual markers in the SSC14 at 120–124 Mb region.Panel (a) shows the percentage of genetic variance explained for saturated fatty acids (SFA), monounsaturated fatty acids (MUFA), oleic acid (C18:1), and the desaturation ratio C18:1/C18:0 of musclegluteus medius. The SNP AY487830:
g.2228T>Cfrom the haplotype described in [12], indicated with an arrow, is not provided in the chip. The grey stripe indicates the location of candidate gene SCDand the arrow indicates sense of transcription. Panel (b) shows the linkage disequilibrium in the region (white: r2= 0; black: r2= 1). Circled, the
experiments using Iberian × Landrace crossbreds [13,14]. In these studies, neither theSCDnor theLEPRloci were detected. This result can be expected for theSCDlocus, because there is no evidence that the investigatedSCDpolymorphism segregates in Iberian, Landrace, or any breed other than Duroc and Large White [12,46]. TheLEPR c.1987C>Tpolymorphism, though, was first described in an Iberian × Landrace intercross [20], but posterior studies have used mostly Duroc, either purebred [36,37] or crossbred with Landrace × Yorkshire [35,38] or Iberian [34].
Table 3. Mean of the estimated marginal posterior distribution of differences between NM_001024587:c.1987C>Tgenotypes and probability of the difference being greater than zero (P(>0)) for leptin concentration in plasma and fat-related traits in the independent set.
Trait1 No. of animals TT−CC TT−CT CT−CC
Mean P(>0) Mean P(>0) Mean P(>0)
Leptin in plasma, ng/ml 73 +35.50 >0.99 +26.36 >0.99 +9.14 0.89
Backfat thickness, mm 818 +0.94 >0.99 +0.89 >0.99 +0.05 0.57
Musclegluteus medius
Intramuscular fat, % 833 +0.77 >0.99 +0.75 >0.99 +0.02 0.55
SFA, % 839 +1.23 >0.99 +1.10 >0.99 +0.13 0.79
MUFA, % 839 +0.07 0.61 −0.02 0.45 +0.09 0.70
PUFA, % 839 −1.28 <0.01 −1.06 <0.01 −0.22 0.09
Musclelongissimus dorsi
Intramuscular fat, % 267 +0.65 >0.99 +0.76 >0.99 −0.11 0.25
SFA, % 267 +1.62 >0.99 +1.61 >0.99 0.00 0.51
MUFA, % 267 −0.15 0.33 −0.12 0.36 −0.03 0.47
PUFA, % 267 −1.45 <0.01 −1.49 <0.01 +0.04 0.55
Subcutaneous fat
SFA, % 272 +1.13 0.98 +0.86 0.95 +0.26 0.75
MUFA, % 272 −0.09 0.43 −0.08 0.44 −0.01 0.50
PUFA, % 272 −0.24 0.26 −0.73 0.03 +0.49 0.96
1SFA, MUFA, PUFA: saturated, monounsaturated, and polyunsaturated fatty acids.
doi:10.1371/journal.pone.0152496.t003
Table 4. Correlations between genomic estimated breeding values and adjusted phenotypes of the 2009-born pigs using the 2002-born as training set and using different sets of SNPs for both training and prediction.
SNPs used for training and prediction2
Trait1 36k SCD LEPR SCD+LEPR 36k−SCD−LEPR
IMF 0.04 -3 0.46 0.43 0.03
SFA 0.48 0.38 0.27 0.48 0.17
MUFA 0.50 0.43 - 0.30 0.14
C18:1 0.28 0.36 - 0.15 0.14
PUFA 0.07 - 0.49 0.48 0.04
C18:1/C18:0 0.60 0.54 - 0.50 0.04
SFA/PUFA 0.10 - 0.47 0.46 0.03
1IMF: intramuscular fat content; SFA, MUFA, PUFA: saturated, monounsaturated, and polyunsaturated fatty acids; C18:1: oleic acid; C18:0: stearic acid.
Determined on musclegluteus medius.
236k: using the 36,432 SNPs in the chip;SCD: using onlyg.2228T
>Cfrom theSCDpromoter;LEPR: using onlyc.1987C>Tfrom exon 14 of theLEPR
gene;SCD+LEPR: using the two SNPs at theSCDandLEPRloci; 36k−SCD−LEPR: all SNPs except the SSC14 at 120–124 Mb (SCD) and SSC6 at 135–
137 Mb (LEPR) extended regions.
3A hyphen indicates lack of convergence of the model.
Our results highlight that, even if only a limited number of animals are available, GWAS can be a successful strategy to detect polymorphic regions with relatively high effects which are segregating at intermediate frequencies. The minor allele frequencies at theSCDandLEPRloci were 0.42–0.45, and did not change substantially between the two time periods in the study.
Thus, the three genotypes at each loci and time period were similarly represented (S2 Table). Our results showed how GWAS techniques have been able to detect a relevant association already described in the population (at theSCDlocus) while revealing another one (at the
LEPR/LEPROTlocus).
Genomic selection
We used the animals born in 2002–2003 as training data to re-estimate the SNP effects and
then to predict the genomic estimated breeding values (GEBV) of the animals born in 2009–
2010. The correlation between the GEBV and the adjusted phenotypic values of the testing dataset are given inTable 4. Note that these correlations should be divided by the square root of heritability of the trait to convert them to accuracies of GEBV as predictors of true breeding values. The correlations of the GEBV based on the 36,432 SNPs in the chip were low (0.04–
0.10) for IMF, PUFA, and SFA/PUFA, moderate (0.28) for C18:1, and high (0.48–0.60) for
SFA, MUFA, and C18:1/C18:0. The correlations for SFA, MUFA, and C18:1/C18:0 only showed a slight decline when predictions were based only onSCD g.2228T>Cand it improved for C18:1. Similarly, using onlyLEPR c.1987C>Traised the correlations of the predictions for IMF, PUFA, and SFA/PUFA to 0.46–0.49, although that for SFA was halved as compared to
whole genome predictions. The combination of the two SNPs inSCDandLEPRprovided simi-lar or better accuracies than the whole chip for traits IMF, SFA, PUFA, C18:1/C18:0, and SFA/ PUFA, with correlations ranging from 0.43 to 0.50. For MUFA and C18:1, including theLEPR
genotype as a predictor worsened their prediction, probably because these traits were not asso-ciated withLEPR. For these two traits, prediction accuracies using onlySCD g.2228T>Cwere similar to those with the whole chip. Consistently, the rest of SNPs in the chip predicted the phenotypes very poorly.
These results, on one hand, confirmed the predictive ability of the SNPs at theSCDand
LEPRloci and, because pigs in the predicted set were separated by a span of seven years from those in the training set, that their effects are consistent across generations. On the other hand, these results suggest that using many SNPs does not necessarily lead to improved predictive ability. To our knowledge, the only attempts to assess the value of genomic prediction for IMF FA composition have been in beef cattle using the BovineSNP50 BeadChip [47,48]. Interest-ingly, reported correlations in Angus cattle [47] between GEBV and phenotypes using the whole genome SNPs were in line with ours, i.e., very low for PUFA and SFA/PUFA (0.07 and 0.10) and moderate for C18:1, MUFA and SFA (0.26–0.34). In another population of purebred
and crossbred Angus cattle [48],SCDwas also found by GWAS as one of the most influencing genes on IMF FA composition. In this population the correlations between GEBV and pheno-types were also greater for C18:1, MUFA and SFA (0.21–0.28) than for PUFA and SFA/PUFA
(0.18–21).
Conclusions
good basis for exploring the development of custom low-density SNP arrays aimed at improv-ing meat quality.
Supporting Information
S1 Table. Primers used for genotyping the single nucleotide polymorphisms (SNP) in the porcineSCDgene promoter (AY487830:g.2228T>C) and exon 14 ofLEPR
(NM_001024587:c.1987C>T).
(PDF)
S2 Table. Minor allele frequency and number of animals per genotype within time period for the porcineSCDgene promoter (AY487830:g.2228T>C) and exon 14 ofLEPR
(NM_001024587:c.1987C>T) SNPs.
(PDF)
Acknowledgments
We acknowledge Teresa Giró for assistance with sampling and laboratory analyses and the staff at Selección Batallé for their cooperation.
Author Contributions
Conceived and designed the experiments: JE. Performed the experiments: SG RNP MT. Ana-lyzed the data: RRF. Wrote the paper: RRF RNP JE. Supervised the bioinformatics analyses and contributed valuable discussion: JCMD NIE. Contributed to the preparation of the final manu-script and to the scientific discussion: RRF SG RNP MT NIE JCMD JE.
References
1. Cameron ND, Enser M, Nute GR, Whittington FM, Penman JC, Fisken AC, et al. Genotype with nutri-tion interacnutri-tion on fatty acid composinutri-tion of intramuscular fat and the relanutri-tionship with flavour of pig meat. Meat Sci. 2000; 55:187–195. PMID:22061084
2. Christophersen OA, Haug A. Animal products, diseases and drugs: a plea for better integration between agricultural sciences, human nutrition and human pharmacology. Lipids Health Dis. 2011; 10:16. doi:10.1186/1476-511X-10-16PMID:21247506
3. Ntawubizi M, Colman E, Janssens S, Raes K, Buys N, De Smet S. Genetic parameters for intramuscu-lar fatty acid composition and metabolism in pigs. J Anim Sci. 2010; 88:1286–1294. doi:10.2527/jas.
2009-2355PMID:20042548
4. Ros-Freixedes R, Reixach J, Tor M, Estany J. Expected genetic response for oleic acid content in pork. J Anim Sci. 2012; 90:4230–4238. doi:10.2527/jas.2011-5063PMID:22767093
5. Clop A, Ovilo C, Perez-Enciso M, Cercos A, Tomas A, Fernandez A, et al. Detection of QTL affecting fatty acid composition in the pig. Mamm. Genome. 2013; 14:650–656.
6. Kim Y, Kong M, Nam YJ, Lee C. A quantitative trait locus for oleic fatty acid content on Sus scrofa chro-mosome 7. J Hered. 2006; 97:535–537. PMID:16985082
7. Sanchez MP, Iannuccelli N, Basso B, Bidanel JP, Billon Y, Gandemer G, et al. Identification of QTL with effects on intramuscular fat content and fatty acid composition in a Duroc × Large White cross. BMC Genetics. 2007; 8:55. PMID:17705816
8. Guo T, Ren J, Yang K, Ma J, Zhang Z, Huang L. Quantitative trait loci for fatty acid composition in long-issimus dorsi and abdominal fat: results from a White Duroc × Erhualian intercross F2population. Anim
Genet. 2009; 40:185–191. doi:10.1111/j.1365-2052.2008.01819.xPMID:19133937
9. Dekkers JCM. Application of genomics tools to animal breeding. Curr Genomics. 2012; 13:207–212. doi:10.2174/138920212800543057PMID:23115522
11. Uemoto Y, Soma Y, Sato S, Ishida M, Shibata T, Kadowaki H, et al. Genome-wide mapping for fatty acid composition and melting point of fat in a purebred Duroc pig population. Anim Genet. 2012; 43:27– 34. doi:10.1111/j.1365-2052.2011.02218.xPMID:22221022
12. Estany J, Ros-Freixedes R, Tor M, Pena RN. A functional variants in the stearoyl-CoA desaturase gene promoter enhances fatty acid desaturation in pork. PLoS One. 2014; 9:e86177. doi:10.1371/ journal.pone.0086177PMID:24465944
13. Ramayo-Caldas Y, Mercadé A, Castelló A, Yang B, Rodríguez C, Alves E, et al. Genome-wide associa-tion study for intramuscular fatty acid composiassocia-tion in an Iberian × Landrace cross. J Anim Sci. 2012; 90:2883–2893. doi:10.2527/jas.2011-4900PMID:22785162
14. Muñoz M, Rodríguez MC, Alves E, Folch JM, Ibañez-Escriche N, Silió L, et al. Genome-wide analysis of porcine backfat and intramuscular fat fatty acid composition using high-density genotyping and expression data. BMC Genomics. 2013; 14:845. doi:10.1186/1471-2164-14-845PMID:24295214
15. Yang B, Zhang W, Zhang Z, Fan Y, Xie X, Ai H, et al. Genome-wide association analyses for fatty acid composition in porcine muscle and abdominal fat tissues. PLoS One. 2013; 8:e65554. doi:10.1371/ journal.pone.0065554PMID:23762394
16. Zhang W, Zhang J, Cui L, Ma J, Chen C, Ai H, et al. Genetic architecture of fatty acid composition in the
longissimus dorsimuscle revealed by genome-wide association studies on diverse pig populations. Genet Sel Evol. 2016; 48:5. doi:10.1186/s12711-016-0184-2PMID:26796620
17. Kim ES, Ros-Freixedes R, Pena RN, Baas TJ, Estany J, Rothschild MF. Identification of signatures of selection for intramuscular fat and backfat thickness in two Duroc populations. J Anim Sci. 2015; 93:3292–3302. doi:10.2527/jas.2015-8879PMID:26439998
18. Bosch L, Tor M, Reixach J, Estany J. Estimating intramuscular fat content and fatty acid composition in live and post-mortem samples in pigs. Meat Sci. 2009; 82:432–437. doi:10.1016/j.meatsci.2009.02.
013PMID:20416690
19. AOAC. 1997. Supplement to AOAC Official Method 996.06: Fat (total, saturated, and monounsatu-rated) in foods hydrolytic extraction gas chromatographic method. Page 18 in Official Methods of Analy-sis (16th ed). Association of Official Analytical Chemists, Arlington, VA.
20. Óvilo C, Fernández A, Noguera JL, Barragán C, Letón R, Rodríguez C, et al. Fine mapping of porcine chromosome 6 QTL and LEPR effects on body composition in multiple generations of an Iberian by Landrace intercross. Genet Res. 2005; 85:57–67. PMID:16089036
21. Amills M, Villalba D, Tor M, Mercadé A, Gallardo D, Cabrera B, et al. Plasma leptin levels in pigs with different leptin and leptin receptor genotypes. J Anim Breed Genet. 2008; 125,228−33. PMID:
18727209
22. Purcell S, Neale B, Todd-Brown K, Thomas L, Ferreira MAR, Bender D, et al. PLINK: A toolset for whole-genome association and population-based linkage analysis. Am J Hum Genet. 2007; 81:559– 575. PMID:17701901
23. Meuwissen THE, Hayes BJ, Goddard ME. Prediction of total genetic value using genome-wide dense marker maps. Genetics. 2001; 157:1819–1829. PMID:11290733
24. Fernando R, Garrick DJ. Gensel: User manual for a portfolio of genomic selection related analyses. 3rd edition. 2009. Iowa State University. Accessed June 2, 2014.http://bigs.ansci.iastate.edu/bigsgui/ help.html.
25. Bouwman AC, Janss LLG, Heuven HCM. A Bayesian approach to detect QTL affecting a simulated binary and quantitative trait. BMC Proceedings. 2011; 5:S4.
26. Legarra A, Croiseau P, Sanchez MP, Teyssèdre S, Sallé G, Allais S, et al. A comparison of methods for whole-genome QTL mapping using dense markers in four livestock species. Genet Sel Evol. 2015; 47:6. doi:10.1186/s12711-015-0087-7PMID:25885597
27. Kass RE, Raftery AE. Bayes Factors. J Am Stat Assoc. 1995; 90:773–795.
28. Barrett JC, Fry B, Maller J, Daly MJ. Haploview: analysis and visualization of LD and haplotype maps. Bioinformatics. 2005; 21:263–265. PMID:15297300
29. Wolc A, Arango J, Settar P, Fulton JE, O'Sullivan NP, Preisinger R, et al. Genome-wide association analysis and genetic architecture of egg weight and egg uniformity in layer chickens. Animal Genetics. 2012; 43 (Suppl. 1): 87–96. doi:10.1111/j.1365-2052.2012.02381.xPMID:22742506
30. Chen EY, Tan CM, Kou Y, Duan Q, Wang Z, Meirelles GV, et al. Enrichr: interactive and collaborative HTML5 gene list enrichment analysis tool. BMC Bioinformatics. 2013; 14:128. doi: 10.1186/1471-2105-14-128PMID:23586463
31. Rabbit programme. 2012. Available from:http://www.dcam.upv.es/dcia/ablasco/Programas/THE% 20PROGRAM%20Rabbit.pdf
33. Óvilo C, Fernández A, Fernández AI, Folch JM, Varona L, Benítez R, et al. Hypothalamic expression of porcine leptina receptor (LEPR), neuropeptide Y (NPY), and cocaine- and amphetamine-regulated tran-script (CART) genes is influenced by LEPR genotype. Mamm Genome. 2010; 21:583–591. doi:10.
1007/s00335-010-9307-1PMID:21128076
34. Muñoz G, Alcázar E, Fernández A, Barragán C, Carrasco A, de Pedro E, et al. Effects of porcineMC4R
andLEPRpolymorphisms, gender and Duroc sire line on economics traits in Duroc × Iberian crossbred
pigs. Meat Sci. 2011; 88:169–173. doi:10.1016/j.meatsci.2010.12.018PMID:21196086
35. Galve A, Burgos C, Silió L, Varona L, Rodríguez C, Ovilo C, et al. The effects of leptin receptor (LEPR) and melanocortin-4 receptor (MC4R) polymorphisms on fat content, fat distribution and fat composition in a Duroc × Landrace/Large White cross. Livest Sci. 2012; 145:145–152.
36. Uemoto Y, Kikuchi T, Nakano H, Sato S, Shibata T, Kadowaki H, et al. Effects of porcine leptin receptor gene polymorphisms on backfat thickness, fat area ratios by image analysis, and serum leptin concen-trations in a Duroc purebred population. Anim Sci J. 2012; 83:375–385. doi:10.1111/j.1740-0929.2011. 00963.xPMID:22574789
37. Hirose K, Ito T, Fukawa K, Arakawa A, Mikawa S, Hayashi Y, et al. Evaluation of effects of multiple can-didate genes (LEP,LEPR,MC4R,PIK3C3, andVRTN) on production traits in Duroc pigs. Anim Sci J.
2014; 85:198–206. doi:10.1111/asj.12134PMID:24128088
38. López-Buesa P, Burgos C, Galve A, Varona L. Joint analysis of additive, dominant and first-order epi-static effects of four genes (IGF2,MC4R,PRKAG3andLEPR) with known effects on fat contente and fat distribution in pigs. Anim Genet. 2014; 45:133–137. doi:10.1111/age.12091PMID:24111741
39. Mackowski M, Szymoniak K, Szydlowski M, Kamyczek M, Eckert R, Rozycki M, et al. Missense muta-tions in exon 4 of the porcineLEPRgene encoding extracellular domain and their association with
fat-ness traits. Anim Genet. 2005; 36:135–137. PMID:15771723
40. Li X, Kim SW, Choi JS, Lee YM, Lee CK, Choi BH, et al. Investigation of porcineFABP3andLEPR
gene polymorphisms and mRNA expression for variation in intramuscular fat content. Mol Biol Rep. 2010; 37:3931–3939. doi:10.1007/s11033-010-0050-1PMID:20300864
41. Tyra M, Ropka-Molik K. Effect of theFABP3andLEPRgene polymorphisms and expression levels on
intramuscular fat (IMF) content and fat cover degree in pigs. Livest Sci. 2011; 142:114–120.
42. Muraoka O, Xu B, Tsurumaki T, Akira S, Yamaguchi T, Higuchi H. Leptin-induced transactivation of
NPYgene promoter mediated by JAK1, JAK2 and STAT3 in the neural cell lines. Neurochem Int. 2003;
42:591–601. PMID:12590942
43. Wood JD, Enser M, Fisher AV, Nute GR, Sheart PR, Richardson RI, et al. Fat deposition, fatty acid composition and meat quality: A review. Meat Sci. 2008; 78:343–358. doi:10.1016/j.meatsci.2007.07.
019PMID:22062452
44. Clément K, Vaisse C, Lahlou N, Cabrol S, Pelloux V, Cassuto D, et al. A mutation in the human leptin receptor gene causes obesity and pituitary dysfunction. Nature. 1998; 392:398–401. PMID:9537324
45. Dubern B, Clement K. Leptin and leptin receptor-related monogenic obesity. Biochimie. 2012; 94:2111–2115. doi:10.1016/j.biochi.2012.05.010PMID:22627381
46. Lim KS, Kim JM, Lee EA, Choe JH, Hong KC. A candidate single nucleotide polymorphism in the 3’ untranslated region of stearoyl-CoA desaturase gene for fatness quality and the gene expression in Berkshire pigs. Asian Austral J Anim Sci. 2015; 28:151–157.
47. Saatchi M, Garrick DJ, Tait RG, Mayes MS, Drewnoski M, Schoonmaker J, et al. Genome-wide associ-ation and prediction of direct genomic breeding values for composition of fatty acids in Angus beef cat-tle. BMC Genomics. 2013; 14:730. doi:10.1186/1471-2164-14-730PMID:24156620