Computer-assisted evaluation of pulmonary emphysema
in CT scans: comparison between a locally developed
system and a freeware system*
Avaliação computacional de enfisema pulmonar em TC: comparação entre um sistema desenvolvido localmente e um sistema de uso livre
John Hebert da Silva Felix, Paulo César Cortez,
Rodrigo Carvalho Sousa Costa, Simone Castelo Branco Fortaleza, Eanes Delgado Barros Pereira, Marcelo Alcantara Holanda
Abstract
Objective: To present a locally developed system of computer vision for use with HRCT images, designated SIStema para a Detecção e a quantificação de Enfisema Pulmonar (SISDEP, System to Detect and Quantify Pulmonary Emphysema), and to compare this system with a freeware system tool. Methods: Thirty-three HRCT images scanned at the apex, hilum and base of the lungs of 11 patients with COPD were analyzed. The SISDEP was compared with the Osiris Medical Imaging Software Program regarding lung parenchyma segmentation, precision of the measurement of the cross-sectional area of the lungs in mm2, mean lung density (MLD), relative area (RA) of the lung occupied by voxels with attenuation values < −950 Hounsfield units (RA −950), 15th percentile point (Perc15) and visualization of hyperinflated areas using a color mask. Results: Although both computational systems were efficient in segmenting the lungs, the SISDEP performed this task automatically and more rapidly. There were significant correlations between the two systems in terms of the results obtained for lung cross-sectional area, MLD, RA −950 and Perc15 (r2 = 0.99, 0.99, 0.99 and 1.00, respectively). The color mask tool of the SISDEP allowed excellent visualization of hyperinflated areas, discriminating them from normal areas. Conclusions: The SISDEP was efficient in segmenting the lungs and quantifying lung hyperinflation, presenting an excellent correlation with the Osiris system. The SISDEP constitutes a promising computational tool for diagnosing and assessing the progression of emphysema in HRCT images of COPD patients.
Keywords: Pulmonary disease, chronic obstructive; Emphysema; Tomography, X-ray computed; Decision making, computer-assisted.
Resumo
Objetivo: Apresentar um sistema de visão computacional em imagens de TCAR, desenvolvido localmente e deno-minado SIStema para a Detecção e a quantificação de Enfisema Pulmonar (SISDEP). Comparar esse sistema a um sistema computacional de acesso livre. Métodos: Foram utilizadas 33 imagens de TCAR de 11 pacientes com DPOC com cortes tomográficos em ápice, hilo e base. O SISDEP foi comparado a Osiris Medical Imaging Software Program quanto à segmentação do parênquima pulmonar; precisão das medidas da área de secção transversal dos pulmões em mm2, densidade pulmonar média (DPM), porcentagem da relative area (RA, área relativa) dos voxels com densidade < −950 Unidades Hounsfield (RA −950), valores de 15º percentil de baixa atenuação (Perc15) e visualização das áreas hiperaeradas por máscara colorida. Resultados: Os dois sistemas realizaram uma segmen-tação pulmonar eficiente; porém o SISDEP o fez de modo automático e mais rápido. Na comparação das medidas de área de secção dos pulmões, DPM, Perc15 e RA −950, houve alta correlação (r2 = 0,99; 0,99; 0,99; e 1,00, respectivamente) entre os dois sistemas. A ferramenta de máscara colorida do SISDEP permitiu excelente visuali-zação das áreas hiperaeradas, discriminado-as das áreas normais. Conclusões: O SISDEP se mostrou eficiente na segmentação dos pulmões e na extração de dados quantitativos da aeração pulmonar com excelente correlação com o sistema Osiris. O SISDEP constitui uma promissora ferramenta computacional para a avaliação diagnóstica e o acompanhamento da evolução do enfisema em imagens de TCAR de pacientes com DPOC.
Descritores: Doença pulmonar obstrutiva crônica; Enfisema; Tomografia computadorizada por raios X; Tomada de decisões assistida por computador.
* Study carried out in the Laboratório de Engenharia de Sistemas de Computação – LESC, Computing Systems Engineering Laboratory
– Department of Computer Engineering, Federal University of Ceará, Fortaleza, Brazil.
Correspondence to: John Hebert da Silva Felix. Rua Coronel Mozart Gondim, 1520, São Gerardo, CEP 60320-250, Fortaleza, CE, Brasil.
Tel 55 85 8738-1305. E-mail: [email protected]
Financial support: This study received financial support from the Fundação Cearense de Apoio ao Desenvolvimento Científico e Tecnológico (FUNCAP, Foundation for the Support of Scientific and Technological Development of the State of Ceará).
programs are not currently available for routine use by clinicians and radiologists.
We have recently developed a computer vision system, which we have designated the SIStema para a Detecção e a quantificação de Enfisema Pulmonar (SISDEP, System to Detect and Quantify Pulmonary Emphysema). The SISDEP incorporates tools for use with HRCT images, i.e., tools that can segment the lung parenchyma with precision, allowing the auto-matic collection of quantitative data regarding lung aeration and the estimation of the degree of emphysema in CT slices.(10,11)
The objectives of the present study were as follows: to introduce the SISDEP and its tools for evaluation of pulmonary emphysema in HRCT images of patients with COPD; and to compare the SISDEP with a freeware system known as the Osiris Medical Imaging Software (OMIS; Digital
Imaging Unit, Geneva, Switzerland) with regard
to lung segmentation in HRCT images, data collection for quantitative analysis and visual identification of hyperinflated areas using a color mask.
Methods
We conducted a prospective study for the development of a new computational system. The study was divided into three steps: acqui-sition of HRCT images of patients with COPD; development of the SISDEP; and comparison between the SISDEP and the OMIS.
The database comprised 33 HRCT images of 11 COPD patients who were clinically stable. Chest X-rays were taken in order to rule out other thoracic diseases; electrocardiography and echocardiography were performed to rule out arrhythmias and heart diseases. Spirometry was also performed, before and after bronchodilator administration, in the morning.
The inclusion criteria were as follows: being over 50 years of age; having been diagnosed with mild, moderate or severe COPD; and being clinically stable. The stability of COPD was characterized by the lack of need for emer-gency treatment or hospitalization, as well as by unchanged symptoms in the previous two months.
The exclusion criteria were as follows: severe arrhythmias; a history of heart disease or heart disease diagnosed during electrocardiography or echocardiography; systemic arterial hypertension
Introduction
Worldwide, COPD is a serious public health problem, presenting high rates of morbidity and mortality. In Brazil, there are over 46 million people aged 40 years or older. Of these, over 11 million are smokers, and approximately 10 million have COPD. Pulmonary emphysema is one of the principal components of COPD and is characterized by an abnormal and perma-nent increase in the alveolar spaces distal to the terminal bronchioles.(1)
An excellent tool for the diagnosis of the emphysema component in COPD is CT, HRCT in particular.(2,3) The reading of HRCT images on radiological film or even in electronic media, on a computer screen, is subject to the limitations inherent to intra-rater and inter-rater subjec-tivity and reliability.(2) However, the collection of quantitative data regarding the density of the lung parenchyma allows the degree of lung tissue aeration to be precisely determined, presenting an excellent correlation with the degree of emphysema revealed by histopathology.(4)
Computer-aided diagnosis systems are increasingly being used in various diagnostic modalities. The purpose of such systems is to reduce the time required for reading the test results, as well as to increase the accuracy of the diagnosis, aiding radiologists in interpreting the test results.(5,6) The concept of computer vision refers to the automation and integration of a wide range of processes and representations used to improve viewing.(7) Computer vision uses various techniques of digital image processing (DIP) with the purpose of segmenting, recog-nizing and identifying details of the area of interest in the image, automatically or semi-automatically.(8) Such techniques can be used to detect and quantify emphysematous areas in the lungs.(2) A computer vision system for detection and quantification of the pulmonary emphy-sema component in CT images can provide physicians and patients with another important tool to aid in the diagnosis of the disease and in the evaluation of its progression and response to treatment.(9)
images, of mean lung density (MLD), of hyperin-flated areas consistent with emphysema—relative area (RA) of the lung occupied by voxels with
attenuation values < −950 HU (RA −950) and RA of −950—and 15th percentile (Perc15).(10,16)
The −950 HU threshold was chosen because it
has been microscopically validated for thin HRCT slices (1- to 2-mm thick) for the quantification of emphysema.(5)
An additional tool known as a color mask, which can highlight the voxels of densities in ranges predefined by the user, was implemented. This tool shows, with precision, the different ranges of lung density, especially in hyperin-flated areas, using color to represent the gray scale, the gradations of which the are difficult for the human eye to differentiate.(10)
The color mask tool has two functions. It allows the calculation of the RA of the lung (in %) of density below a density threshold preselected
by the operator, e.g., −950 HU for the study of hyperinflated areas (RA, −950), and at the
same time facilitates the visualization of areas that the system regards as abnormal.(11) The tool is semi-automatic: the user enters the density range, selects the desired color, and, by pressing a button, obtains an immediate result, which indicates the area (in %) that the chosen range occupies in the image. For example, by selecting the color light green (or any other color) for
the voxels with a density lower than −950 HU
(emphysematous or hyperinflated lung) and the color blue (or any other color) for voxels with a
density between −950 and −500 HU (normally
aerated lung), the area (in %) corresponding to each range is obtained.(10,11)
The OMIS is used as a research tool for quantitative studies of lung densitometry.(17) The software is widely used in the international scientific community, by physicians and researchers, for studies and analyses of CT images and has various DIP resources. It is a freeware system comprising applications that are more general.(18) The lung parenchyma segmen-tation available in the OMIS allows users to adjust segmentation manually. The same is true for the measurement of mean, standard devia-tion, minimum value and maximum value of the attenuation coefficients per unit of area (pixel) and the cross-sectional area of the lung images, which are presented separately for each lung (when the show data option is selected from (systolic blood pressure ≥ 180 mmHg or diastolic
blood pressure ≥ 120 mmHg, or a combination of the two); other active chronic diseases; and other lung diseases.
Of the patients included in the present study, 4 were female and 7 were male. Ages ranged from 59 to 74 years (mean, 65 years). Mean body mass index was 25 ± 4.4 kg/m2; mean FEV
1 was 0.86 ± 0.53 L (33 ± 16% of predicted); mean FVC was 2.29 ± 0.69 L (70 ± 13% of predicted); and mean FEV1/FVC was 41 ± 13%. One patient had mild COPD, 3 had moderate COPD, and 7 had severe COPD. Severity was determined in accordance with the classification criteria of the Global Initiative for Chronic Obstructive Lung Disease.(12)
The images were obtained using an Aukelet CT scanner (Toshiba TSX-003A, Tokyo, Japan). Before image acquisition, the equipment was
calibrated to a density of −1,000 Hounsfield units (HU). Water density calibration was performed in
a period not greater than three months before the tests were performed, in accordance with the manufacturer specifications.(13) For calibra-tion analysis and control, a CT slice of a water phantom of known density was obtained prior to image acquisition.
The images of COPD patients were acquired under the following conditions: collimation of 1.5 mm; field of view of 312 mm; slice intervals of 1.8 s; operation at 120 kV; 200-mA tube fila-ment current; lung window adjustfila-ment; center
and width of −600 and 1,600 HU, respectively;
and image reconstruction with a 512 × 512 pixel matrix. A filter (bone) was applied to the high resolution algorithm for image reconstruc-tion.(14)
The images were specifically obtained for a previous study, conducted between August of 2005 and March of 2006. The CT slices were taken, with the patient in the supine position, in three regions: the apex (2 cm above the aortic arch); the hilum (1 cm below the carina); and the lung base (2 cm above the diaphragm).(15,16) The previous study and the present study were approved by the research ethics committees of the hospitals where the tests were performed.
Figure 1 - Interfaces of the Osiris Medical Imaging Software (in a) and of the SIStema para a Detecção e a quantificação de Enfisema Pulmonar (SISDEP, System to Detect and Quantify Pulmonary Emphysema, in b) for processing HRCT images scanned at the lung bases of a patient with COPD.
a b c
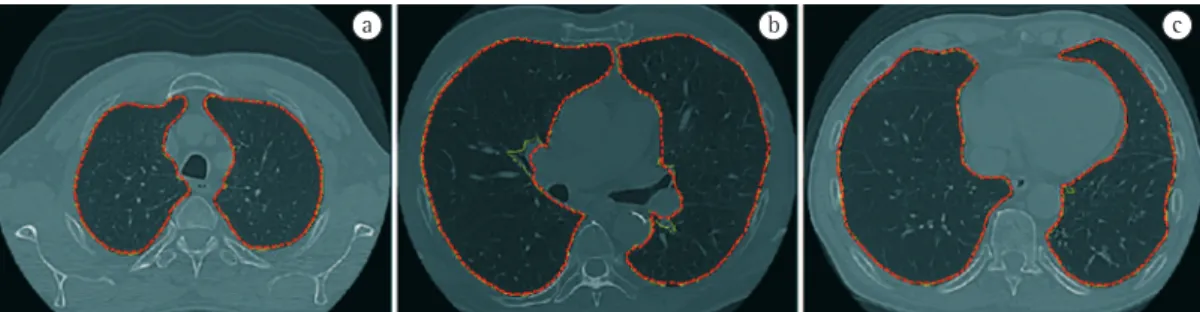
Figure 2 - Examples of segmentations classified as concordant between the Osiris Medical Imaging Software (yellow outline) and the SIStema para a Detecção e a quantificação de Enfisema Pulmonar (SISDEP, System to Detect and Quantify Pulmonary Emphysema, red outline). Superimposed segmentation outlines in HRCT images scanned at the apex (in a), hilum (in b) and base of the lungs (in c).
a b c
or mediastinal structures, such as the heart and great vessels; partially concordant, when it was possible to superimpose the contours in more than 80% of the outline; and concordant, when it was possible to superimpose the contours in 100% of the outline or when the differences observed were minimal.
In order to determine the accuracy of the segmentation and of the quantitative analysis performed by the SISDEP, the measurements of the cross-sectional area of the lungs, MLD, RA
−950 and Perc15 obtained by the system were
compared with those obtained by the OMIS and complemented using the Excel® program.
For statistical analysis, the calculated vari-ables of lung cross-sectional area, MLD, RA
−950 and Perc15 were tested for normal distri -bution using the Kolmogorov-Smirnov test. Subsequently, Pearson’s correlation test was the tool bar) after segmentation.(18) In order to
calculate MLD, Perc15 and RA −950, the data
have to be exported to other programs, such as Excel®, for subsequent processing, which takes considerably longer than it does when automatic systems are used. Figure 1 presents the interface of the SISDEP and that of the OMIS.
All images were segmented by the two systems, and the cross-sectional area of the
lungs, MLD, RA −950 and Perc15 were subse -quently calculated. For the OMIS, the last three items were processed using the Excel® software.
The segmentations performed by the two systems were visually compared by two inde-pendent raters (a pulmonologist and a radiologist) and were classified as follows: discordant, in cases of gross errors, such as lack of segmentation of more than one third of the lungs or even of an entire lung, or the inclusion of chest wall areas
5000 1000015000 200002500030000 35000 40000
35000
25000
15000
5000 30000
20000
10000
–950
RA –950 (%) –950
–850 –850
–750 –750
–700 –700
–800 –800
–900 –900
–900
–900 –920
–920 –940
–940 –960
–960 –980
–980 –1000
–1000 –1020
–1020 –1040
–1040 –1060
(SISDEP)
(SISDEP)
(Osiris) (Osiris)
0 0
10 10
20 20
30 30
40 40
50 50
60 60
70 r2 = 0.99
p < 0.0001
r2 = 0.99
p < 0.0001
r2 = 0.99
p < 0.0001
r2 = 1
p < 0.0001 a
c
b
d Perc15(HU)
Lung area (mm2) MLD (UH)
lung cross-sectional area, MLD, RA −950 and
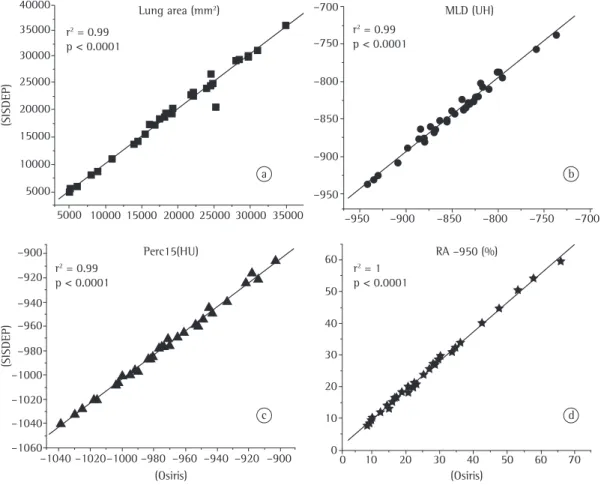
Perc15, as well as the correlation coefficient (r2) and the level of significance for each pair of variables, are shown in Figure 4. There was a significant correlation between the measure-ments obtained by the two systems for the four variables analyzed.
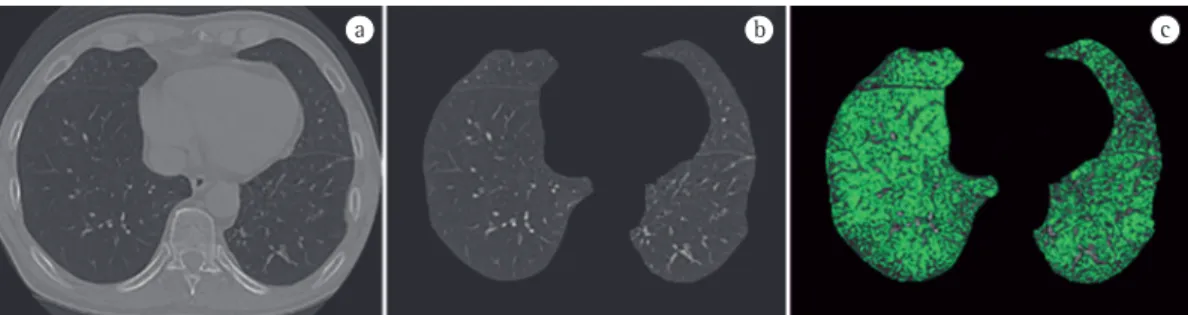
The color mask tool of the SISDEP was programmed to highlight lung tissue according to predefined density ranges: hyperinflated
areas ranging from −1,100 to −951 HU (light
green).(4,11) Figure 5 shows the original image (Figure 5a), the segmented image (Figure 5b), and the results obtained using the color mask tool of the SISDEP (Figure 5c). In Figure 5c, the hyperinflated area (with emphysema, high-lighted in green) represents 44.2% of the total area, whereas healthy tissue (in gray) represents 46.4%.
Discussion
The present study tested a computer-aided diagnosis system developed in Brazil (the SISDEP) and compared it with the results obtained using a system known worldwide (the OMIS). The ability of the SISDEP to perform automatic segmentation of the lung area and to quantify the total area of emphysema in isolate CT slices was evaluated, based on the attenu-ation coefficient values provided by the HRCT images. The SISDEP was able to quantify lung hyperinflation, aiding in the evaluation of the extension of emphysema in COPD patients. The present study was the first of its kind developed in Brazil.
The SISDEP was able to perform automatic lung parenchyma segmentation and to measure applied to the values obtained using the two
systems. The variables were paired, and the results were presented as dispersion graphs with the respective correlation coefficients. An α error of 0.05 was adopted as the cut-off point for determining statistical significance. All statistical analyses were performed using the OriginPro software, version 7.5 (OriginLab, Northampton,
MA, USA).(19)
Results
The lung segmentations were classified as follows: 17 (51%) were classified as partially concordant; and 16 (49%) were classified as concordant. There were no discordant lung segmentations. Examples of the segmentation of the HRCT images performed automatically by the SISDEP and by the OMIS are shown in Figures 2 and 3. There are two outlines, one yellow, representing the OMIS, and the other red, representing the SISDEP. Examples of concordant segmentation are shown in Figure 2, in which the entire outline of the contour is seen, with a few small differences caused by the imprecise segmentation performed by the OMIS.
Examples of partially concordant segmenta-tion are shown in Figure 3. In Figure 3a, the partial concordance observed was due to the imprecise segmentation performed by the two systems. In Figure 3b, the partial concordance observed was due to the imprecise segmentation performed by the SISDEP, whereas in Figure 3c the partial concordance observed was due to the imprecise segmentation performed by the OMIS.
The dispersion graphs constructed, using the OMIS and the SISDEP, for the measurement of
a b c
The present study has certain limitations. The SISDEP was applied to a small number of images, which were acquired using the same CT scanner and following the reconstruction algorithm that is habitually used for high-resolution images. In addition, edge-preserving smoothing filters were used for image acquisition and processing. This type of processing affects the attenuation coefficient, especially at the interface between structures of extremely different densities (such as vessels and air spaces), resulting in more noise and occasionally in overestimation of hyperin-flated areas.(23)
Further studies are needed in order to vali-date the use of the SISDEP with images obtained using different CT scanners and devices with multiple detectors,(26) with different slice widths and different reconstruction algorithms, as well as with a greater number of images.
The clinical relevance of the present study lies in the possibility of using the SISDEP to estab-lish an early diagnosis of COPD, to evaluate the progression of COPD, to select the ideal candi-date for lung volume reduction surgery and to evaluate the impact of therapeutic interventions on emphysema.(27,28) Future studies addressing the volumetric quantification (densitometry and volumetric assessment) of hyperinflated lung areas and the evaluation of the patterns of spatial organization of the areas of emphysema (cluster analysis) might broaden the application of the SISDEP in clinical practice, as well as in research.(29,30)
In conclusion, The SISDEP was efficient in segmenting the lungs and quantifying lung hyperinflation in HRCT images, presenting an excellent correlation with the OMIS. The SISDEP constitutes a promising computational tool that can perform quantitative analyses automati-cally and semi-automatiautomati-cally for diagnosing and assessing the progression of emphysema in HRCT images of COPD patients more effectively.
References
1. Sociedade Brasileira de Pneumologia e Tisiologia [homepage on the Internet]. Brasília: Sociedade Brasileira de Pneumologia e Tisiologia; c2008. [updated 2008 Jun 20; cited 2008 Nov 17]. Consenso brasileiro sobre doença pulmonar obstrutiva crônica – DPOC - Sociedade Brasileira de Pneumologia e Tisiologia – SBPT - revisão de alguns aspectos de epidemiologia e tratamento da doença estável - 2006. [Adobe Acrobat document, 24p.] Available from: http://www.sbpt.org.br/downloads/ arquivos/Consenso_DPOC_SBPT_2006.pdf
lung cross-sectional area, as well as to calculate, semi-automatically, the variables related to the severity of the pulmonary emphysema
compo-nent, namely MLD, RA −950 and Perc15.(10,11) In addition, the SISDEP has a color mask tool that allows better visualization of hyperinflated areas, contrasting them with normal areas.(11)
The lung segmentation and hyperinflation quantification performed by the SISDEP corre-lated with those performed by the OMIS, the former having the advantage of performing those tasks automatically and therefore more rapidly, with no need for complementary analysis using other software. However, the impossibility of manually adjusting the automatic segmentation of the lung outline using the SISDEP constitutes a limitation of the system in cases in which such adjustments are required due to imperfections or segmentation errors.
There is currently no consensus regarding the ideal parameter for quantifying emphy-sema in HRCT images, and various indices are used. Various authors have used certain indices in isolation: the percentage of hyperinflated
areas of density < −900 HU(20); the measurement of MLD and Perc15; and the analysis of lung parenchyma textures. There is currently no gold standard.(16,21,22) The SISDEP is able to extract various quantitative indices simultaneously, indices that are used to estimate the degree of emphysema, allowing a more detailed analysis of lung aeration.
The lack of a gold standard is due in part to the fact that the radiological densities obtained from CT images are influenced by the width of the slices, the image reconstruction algorithm, the filter used, the calibration and the type of CT scanner used, resulting in the inclusion of artifacts (noise) in the density data of the image. It has recently been reported that the use of thin slices (1- to 2-mm thick) with image reconstruction using standard filters (rather than the edge-pre-serving smoothing filters used in conventional slices) can minimize such problems.(23) In addi-tion, the selection of appropriate thresholds for the low densities that represent hyperinflated
areas is crucial (from −1,000 to −950 HU; from −950 to 900 HU; −930 HU; or < −900 HU), and
17. Borges JB, Okamoto VN, Matos GF, Caramez MP, Arantes PR, Barros F, et al. Reversibility of lung collapse and hypoxemia in early acute respiratory distress syndrome. Am J Respir Crit Care Med. 2006;174(3):268-78. 18. Osiris – Imaging Software [homepage in the Internet].
Geneva: University Hospitals of Geneva. [updated 2007
Mar 15; cited 2008 Jun 18]. Osiris - user manual – version 3.1 – 1996. [Adobe Acrobat document, 50p.] Available from: http://www.dim.hcuge.ch/osiris/
OsirisUsersManual.pdf
19. OriginLab Corporation. Getting Started Manual. Version 7.5. Northampton: OriginLab Corporation; 2003. 20. Archer DC, Coblentz CL, deKemp RA, Nahmias C, Norman
G. Automated in vivo quantification of emphysema. Radiology. 1993;188(3):835-8.
21. Uppaluri R, Mitsa T, Sonka M, Hoffman EA, McLennan
G. Quantification of pulmonary emphysema from lung computed tomography images. Am J Respir Crit Care Med. 1997;156(1):248-54.
22. Xu Y, Sonka M, McLennan G, Guo J, Hoffman EA. MDCT-based 3-D texture classification of emphysema and early smoking related lung pathologies. IEEE Trans Med Imaging. 2006;25(4):464-75.
23. Reske AW, Busse H, Amato MB, Jaekel M, Kahn T, Schwarzkopf P, et al. Image reconstruction affects computer tomographic assessment of lung hyperinflation. Intensive Care Med. 2008;34(11):2044-53.
24. Vieira SR, Puybasset L, Richecoeur J, Lu Q, Cluzel P, Gusman PB, et al. A lung computed tomographic assessment of positive end-expiratory pressure-induced lung overdistension. Am J Respir Crit Care Med. 1998;158(5 Pt 1):1571-7.
25. Lee YK, Oh YM, Lee JH, Kim EK, Lee JH, Kim N, et al. Quantitative assessment of emphysema, air trapping, and airway thickening on computed tomography. Lung. 2008;186(3):157-65. Erratum in: Lung. 2008;186(4):277.
26. Newell JD Jr. Quantitative computed tomography of lung parenchyma in chronic obstructive pulmonary disease: an overview. Proc Am Thorac Soc. 2008;5(9):915-8. 27. Figueroa PA, Martinez-Silveira MS, Ponte E, Camelier
A, Pereira-Silva JL. Radiological profile of the ideal candidate for lung volume reduction surgery to treat emphysema: a systematic review. J Bras Pneumol. 2005;31(3):197-204.
28. Washko GR, Hoffman E, Reilly JJ. Radiographic evaluation of the potential lung volume reduction surgery candidate. Proc Am Thorac Soc. 2008;5(4):421-6. 29. Irion KL, Hochhegger B, Marchiori E, Porto NS,
Baldisserotto SV, Santana PR. Chest X-ray and computed tomography in the evaluation of pulmonary emphysema. J Bras Pneumol. 2007;33(6):720-732.
30. Matsuoka S, Kurihara Y, Yagihashi K, Nakajima Y. Morphological progression of emphysema on thin-section CT: Analysis of longitudinal change in the number and size of low-attenuation clusters. J Comput Assist Tomogr. 2006;30(4):669-74.
2. Coxson HO, Rogers RM, Whittall KP, D’yachkova Y, Paré PD, Sciurba FC, et al. A quantification of the lung surface area in emphysema using computed tomography. Am J Respir Crit Care Med. 1999;159(3):851-6. Erratum in: Am J Respir Crit Care Med. 2001;163(6):1500-1. 3. Muller NL, Coxson H. Chronic obstructive pulmonary
disease. 4: imaging the lungs in patients with chronic obstructive pulmonary disease. Thorax. 2002;57(11):982-5.
4. Gevenois PA, De Vuyst P, de Maertelaer V, Zanen J, Jacobovitz D, Cosio MG, et al. Comparison of computed density and microscopic morphometry in pulmonary emphysema. Am J Respir Crit Care Med. 1996;154(1):187-92.
5. Li Q, Li F, Suzuki K, Shiraishi J, Abe H, Engelmann R, et al. Computer-aided diagnosis in thoracic CT. Semin
Ultrasound CT MR. 2005;26(5):357-63.
6. Doi K. Overview on research and development of
computer-aided diagnostic schemes. Semin Ultrasound
CT MR. 2004;25(5):404-10.
7. Ballard DH, Brown CM. Computer vision. Englewood Cliffs: Prentice-Hall; 1982. p. 1-2.
8. Jan J. Medical image processing, reconstruction, and restoration: concepts and methods. Boca Raton: Taylor
& Francis; 2006. p.361-3.
9. Stolk J, Ng WH, Bakker ME, Reiber JH, Rabe KF, Putter H, et al. Correlation between annual change in health status and computer tomography derived lung density in subjects with alpha1-antitrypsin deficiency. Thorax. 2003;58(12):1027-30. Erratum in: Thorax. 2004 Feb;59(2):179.
10. Felix JH. Sistema de Visão Computacional para Detecção e Quantificação de Enfisema Pulmonar [dissertation].
Fortaleza: Universidade do Federal do Ceará; 2007.
11. Felix JH, Cortez PC, Rebouças-Filho PP, Alexandria AR, Costa RC, Holanda MA. Identification and Quantification of Pulmonary Emphysema through Pseudocolors. Lect Notes Comput Sci. 2008;5317:957-64.
12. Global Initiative for Chronic Obstructive Lung Disease. Global strategy for the diagnosis, management and prevention of chronic obstrutive pulmonary disease: NHLBI/WHO workshop report. Bethesda: National Heart, Lung and Blood Institute, 2001.
13. Toshiba Corporation. Manual de operação do sistema: Tomógrafo computadorizado de raio-X de corpo inteiro. Aquisição de densidades de calibração. São Paulo: Toshiba Corporation; 1997.
14. Webb WR, Müller NL, Naidich DP. High-Resolution CT of the Lung. Philadelphia: Lippincott Williams & Wilkins; 1996. p.1-23.
15. Fortaleza SC. Efeitos da Administração de Pressão Positiva Contínua em Vias Aéreas de Modo não Invasivo Sobre a Aeração do Parênquima Pulmonar em Pacientes com Doença Pulmonar Obstrutiva Crônica. [dissertation].
Fortaleza: Universidade Federal do Ceará; 2006.
About the authors
John Hebert da Silva Felix
Doctoral Student in Computer Engineering. Federal University of Ceará, Fortaleza, Brazil.
Paulo César Cortez
Associate Professor I. Department of Computer Engineering, Federal University of Ceará, Fortaleza, Brazil.
Rodrigo Carvalho Sousa Costa
Doctoral Student in Computer Engineering. Federal University of Ceará, Fortaleza, Brazil.
Simone Castelo Branco Fortaleza
Pulmonologist. Walter Cantídio University Hospital, Federal University of Ceará, Fortaleza, Brazil.
Eanes Delgado Barros Pereira
Adjunct Professor. Department of Clinical Medicine, Walter Cantídio University Hospital, Federal University of Ceará, Fortaleza, Brazil.
Marcelo Alcantara Holanda