Clinical correlation between N-terminal pro-b-type
natriuretic peptide and angiographic coronary
ather-osclerosis
Demo´stenes G. L. Ribeiro,IRicardo P. Silva,IDaniella R. M. M. Barboza,IIRoberto C. P. Lima-Ju´nior,II Ronaldo A. RibeiroII*
IFederal University of Ceara´, Faculty of Medicine, Department of Clinical Medicine, Fortaleza/CE, Brazil.IIFederal University of Ceara´, Faculty of Medicine,
Department of Physiology and Pharmacology, Fortaleza/CE, Brazil.
OBJECTIVES: This study aimed to investigate the clinical correlation between angiographic coronary atherosclerosis and N-terminal pro-B-type natriuretic peptide along with other known correlated factors. METHODS: In total, 153 patients with a diagnostic hypothesis of stable angina, unstable angina or acute myocardial infarction were classified as group A (patients with angiographically normal coronary arteries) or group B (patients with angiographic coronary atherosclerosis). The two groups were analyzed with respect to the following factors: gender, age, body mass index, abdominal circumference, smoking, diabetes mellitus, arterial hypertension, early family history of atherosclerosis, statin use, the presence of metabolic syndrome, clinical presentation and biochemical factors, including cholesterol, creatinine and fibrinogen plasma concentrations, monocyte counts and N-terminal pro-B-type natriuretic peptide.
RESULTS:Univariate analyses comparing the two groups revealed that group B patients more frequently had diabetes, used statins and had systolic dysfunction, N-terminal pro-B-type natriuretic peptide levels$250 pg/ mL, fibrinogen levels .500 mg/dL and $501 monocytes/mm3 compared with group A patients (
p,0.05). Nevertheless, multivariate logistic regression analysis demonstrated that the independent predictors of angiographic coronary atherosclerosis were an N-terminal pro-B-type natriuretic peptide level $250 pg/mL, diabetes mellitus and increased monocyte numbers and fibrinogen plasma concentration, regardless of the creatinine level or the presence of systolic dysfunction.
CONCLUSIONS: An N-terminal pro-B-type natriuretic peptide plasma concentration of $250 pg/mL is an independent predictor of angiographic coronary atherosclerosis.
KEYWORDS: Atherosclerosis; Coronary Angiography; NT-proBNP.
Ribeiro DG, Silva RP, Barboza DR, Lima-Ju´nior RC, Ribeiro RA. Clinical correlation between N-terminal pro-b-type natriuretic peptide and angiographic coronary atherosclerosis. Clinics. 2014;69(6):405-412.
Received for publication onSeptember 14, 2013;First review completed onOctober 9, 2013;Accepted for publication onSeptember 14, 2013 E-mail: [email protected]/[email protected]
*corresponding author Tel.: 55 85 3366-8588
& INTRODUCTION
Atherosclerosis is a chronic inflammatory disease that occurs in individuals with low activity levels. It typically involves endothelial dysfunction and immune mechanisms that interact with metabolic changes to trigger, propagate and activate lesions in the arterial tree (1).
The pathogenesis of atherosclerosis includes multifactor-ial risk factors, such as gender, age, smoking, hypertension, diabetes mellitus, hypercholesterolemia and first-degree relatives with a history of atherosclerotic cardiovascular disease (2). Additionally, monocytes are important cells in the progression of the disease, and increases in serum acute-phase proteins reflect low-grade vascular inflammation. Among other factors, increases in fibrinogen and C-reactive protein are considered risk factors and have been correlated with disease severity (3).
Coronary angiography, although invasive, is the first-choice method for detecting atherosclerosis (4). However, its use is only indicated when clinical and biochemical factors are clearly indicative of the presence of athero-sclerosis (4). Nevertheless, some patients who undergo coronary angiography do not exhibit atherosclerotic Copyrightß2014CLINICS– This is an Open Access article distributed under
the terms of the Creative Commons Attribution Non-Commercial License (http:// creativecommons.org/licenses/by-nc/3.0/) which permits unrestricted non-commercial use, distribution, and reproduction in any medium, provided the original work is properly cited.
No potential conflict of interest was reported.
diseases. Therefore, new markers for coronary lesions are required.
B-type natriuretic peptide (BNP) and the N-terminal fragment of pro-B-type natriuretic peptide (NT-proBNP) are sensitive indicators of left ventricular dysfunction (5). It has also been reported that the serum concentrations of these markers are increased during myocardial ischemia due to coronary atherosclerosis in patients with normal ventricular function (5). However, NT-ProBNP is not yet routinely used as a biomarker for atherosclerosis that effectively correlates with angiographic identification of this disease.
This study therefore aimed to investigate the correlation between atherosclerotic disease and the plasma concentra-tions of NT-proBNP, hsCRP and fibrinogen, as well as blood leukocyte and monocyte counts and traditional risk factors for atherosclerosis, in patients undergoing coronary athero-sclerosis (CAD) angiography.
& MATERIALS AND METHODS
A) Study Characterization
This was an observational study that included a series of 153 patients admitted to Hospital Universita´rio Walter Cantı´dio of the Federal University of Ceara´ (HUWC-UFC), Brazil, between August 2007 and March 2008. The inclu-sion criteria were a diagnostic hypothesis of stable angina, unstable angina or acute myocardial infarction and elective coronary angiography.
The exclusion criteria included the following: previous percutaneous or surgical myocardial revascularization; acute or chronic renal dialysis; cancer; infectious or inflammatory diseases; pulmonary, hepatic, hematological or valvular heart diseases; congenital heart disease; and cardiomyopathy.
The study was approved by the Ethics in Research Committee of HUWC-UFC (protocol number 030.06.01) and complied with the Helsinki Declaration (1983). All patients signed an informed consent form.
B) Clinical and Demographic Variables
The demographic and clinical data, including gender, age, body mass index (BMI), abdominal circumference, meta-bolic syndrome, smoking, diabetes, hypertension, positive family history of early-onset atherosclerosis, statin use and clinical presentation, were collected by interview and physical examination. A BMI$30 kg/m2was indicative of obesity. Abdominal circumference was considered normal when it was,80 cm in women and,94 cm in men.
Metabolic syndrome was defined as the presence of three or more of the following clinical parameters: abnormal abdominal circumference, triglycerides$150 mg/dL, high-density lipoprotein (HDL) cholesterol levels ,40 mg/dL in men and ,50 mg/dL in women, blood pressure
$130685 mmHg and fasting glucose.100 mg/dL (6). Patients a pipe, a cigar or five or more cigarettes per day for at least six months or who had stopped smoking no more than six months before the start of the study were considered smokers.
Diabetes mellitus and hypertension were recognized based on the most recent definitions (7,8).
A positive family history of early-onset atherosclerosis was based on one of the following findings in first-degree male relatives before the age of 55 years or in female
relatives before the age of 65 years: atherosclerotic cere-brovascular disease, peripheral atheromatous arteriopathy, ischemic heart disease, angina pectoris, myocardial infarc-tion or sudden ischemic death (2).
Statin users were patients who reported using statins regularly for at least one month. Patients with stable angina, unstable angina or acute myocardial infarction were diagnosed based on clinical criteria and electrocardio-graphic and biochemical parameters as reported in the current literature (9).
C) Laboratory Variables
The resting electrocardiogram was considered abnormal when cardiac arrhythmia, conduction disorders, cardiac chamber overload, electrically inactive areas and disper-sion of ventricular repolarization were observable (10). Cardiomegaly and/or pulmonary venous congestion were diagnosed by chest radiography (11).
The systolic function of the left ventricle was assessed by echocardiography based on the measurement of the ejection fraction and fractional shortening, which were considered normal when they were.55% and 28%, respectively (12).
After a twelve-hour fasting period, peripheral venous blood was collected for the following biochemical analyses, with their corresponding normal values shown in parenth-eses: glucose (70-99 mg/dL), total cholesterol (up to 200 mg/ dL), triglycerides (,150 mg/dL), uric acid (,7.0 mg/dL in men and,5.7 mg/dL in women), urea (up to 24 mg/dL), creatinine (#0.6 mg/dL), HDL cholesterol (HDL-C) (35-55 mg/dL in men and 45-65 mg/dL in women), fibrinogen (180-350 mg/dL) and creatinine kinase-MB fraction (CK-MB) (7-25 U/L). Total leukocyte and monocyte counts were considered normal at 4000-10,000/mm3and 80-1000/mm3, respectively. Urinalysis was also performed.
The low-density lipoprotein cholesterol (LDL-C) value was determined from the Friedewald equation. The evalua-tion was considered unreasonable when triglycerides were
.400 mg/dL (13). Cardiac troponin I was normal if it was ,0.10 mg/L, but acute myocardial infarction was considered to be indicated by a value $0.16 mg/L (9). High-sensitivity C-reactive protein, measured with a turbi-dimetric immunoassay, was considered normal when it was
#1.0 mg/L (14). Plasma levels of NT-proBNP were mea-sured using an electrochemiluminescence immunoassay with a Roche Elecsys 2010 machine (Roche Diagnostics/ Hoffmann-La Roche, Bohemia, NY, USA), with a detection limit ranging from 5.0-35000.00 pg/mL. The upper limit of normal was ,125 pg/mL, and the intra- and inter-assay coefficients of variation were 1.1% and 4.1%, respectively (15).
D) Cardiac Catheterization and Coronary Angiography
Statistical Analysis
Statistical analyses were performed using SPSS 13.0R. Categorical and continuous variables are presented as absolute numbers and percentages or as the mean or median, as appropriate. Fisher’s exact test and the chi-square test were used to analyze categorical variables. For quantitative variables with and without normal distribu-tions, we used Student’s t-test and the Mann-Whitney U test, respectively. P values ,0.05 were considered to be significant. The odds ratio was estimated with a confidence interval of 95%. Multivariate logistic regression was performed to define factors that were significantly asso-ciated with the presence of angiographic CAD. The sensitivity, specificity and accuracy of the model employed were also determined (17). Sample size estimation was performed according to previously published methods (18). The suggested sample size for our study was 74 patients based on the formula N = [(r + 1).(Za/2 + Z1-b)2]s2]/r.d2,
where Za/2(1.96 for a 5% level of significance) and Z1-b(0.84
at 80% power) are normal deviates for type I error (significance level) and study power, respectively. r = n1/ n2 is the sample size ratio required for the two groups (n1 = 42 patients with a normal coronary artery and n2 = 111 patients with angiographic coronary atherosclerosis), yield-ing an ‘‘r’’ of 0.38. s and d are, respectively, the pooled
standard deviation and difference in the means of the two groups (data derived from Table 5). Considering the markers used in our study, we decided to use C-reactive protein (CRP) as a reference for the sample size calculation because it is the most extensively studied biomarker of inflammation in cardiovascular diseases.
& RESULTS
Table 1 shows the clinical and demographic character-istics and the main laboratory results of all 153 patients. The distributions of these parameters were similar between genders. Patient age ranged from 32-86 years (mean = 62.5 years; median = 62.0 years), with no significant difference between men and women (p= 0.065) (Table 1).
The sample was divided into two groups according to coronary angiography results: Group A, patients with angiographically normal coronary arteries (n = 42; 27.5%); and Group B, patients with angiographic CAD (n = 111; 72.5%). Angiography demonstrated that all patients with CAD had one or more fully obstructed coronary arteries or at least 50% luminal occlusion.
Table 2 shows that all patients diagnosed with acute myocardial infarction and nearly all diagnosed with instable angina had angiographic CAD. Stable angina was present in 62.7% of the overall sample, but 97.6% of the group with angiographically normal coronary arteries were diagnosed with stable angina.
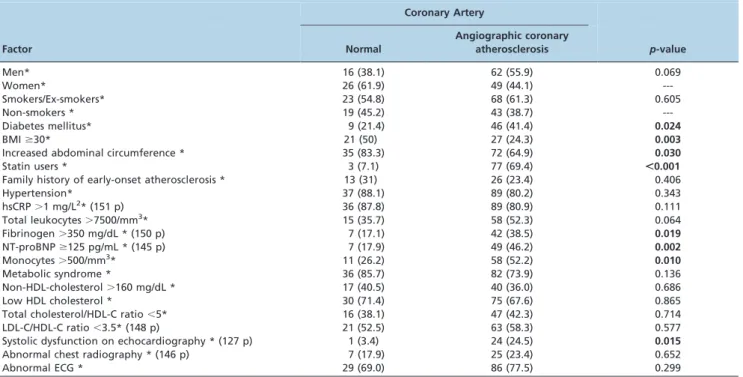
The associations between normal coronary arteries or angiographic CAD and the various demographic, clinical and laboratory data were evaluated in both groups and are shown in Table 3.
Table 4 presents the odds ratios for categorical variables that were significantly associated with the presence of angiographic CAD (p,0.05). Among all the variables, diabetes mellitus, systolic dysfunction on echocardiogra-phy, NT-proBNP levels $250 pg/mL, fibrinogen levels
.500 mg/dL, statin use and a monocyte count.501/mm3
were associated with the presence of angiographic CAD.
BMI $30 kg/m2 and increased abdominal circumference
were more prevalent in patients with angiographically normal coronary arteries. Additionally, the comparisons between groups A and B, with respect to the quantitatively expressed variables, are presented in Table 5.
Diabetes mellitus, systolic dysfunction and a NT-proBNP level$250 pg/mL were analyzed using multivariate logistic regression because they were strongly associated with the presence of angiographic CAD (OR$4.9) in the univariate analyses. Quantitatively, the absolute number of monocytes per mm3and fibrinogen and creatinine levels in mg/dL were included because they were also significantly associated with angiographic CAD in the univariate analyses (p,0.05). The statistical analysis yielded results consistent with the observed clinical correlations, and elevations in fibrinogen,
Table 1 -Descriptive analysis of the sample group.
Clinical and demographic characteristics
Men 78.0 (51.0)*
Women 75.0 (49.0)*
Age 62.5 (11.1)**
Smoker 22.0 (14.4)*
Ex-smoker 69.0 (45.1)*
Non-smoker 62.0 (40.5)*
Diabetes mellitus 55.0 (35.9)*
Hypertension 126.0 (82.4)*
Family history of early-onset atherosclerosis 39.0 (25.5)*
BMI$30 kg/m2 48.0 (31.4)*
Increased abdominal circumference 107.0 (69.9)*
Metabolic syndrome 118.0 (77.1)*
Statin users 80.0 (52.3)*
Laboratory data
Total leukocytes.7500/mm 73 (47.7)1
Monocytes.500/mm 69 (45.1)1
Fibrinogen.350 mg/dL 119 (79.3)2
hsCRP.1 mg/L 125 (82.8)3
Low HDL-C 105 (68.6)4
Total cholesterol/HDL-C ratio,5 63 (41.2)4
LDL-C/HDL-C ratio,3.5 84 (56.7)1
Non-HDL-C.160 mg/dL 57 (37.3)4
NT-proBNP$125 pg/mL 87 (59.8)5
Abnormal ECG 115 (75.2)4
Abnormal chest radiography 32 (21.9)6
Systolic dysfunction on echocardiography 25 (19.7)7 *Number of patients (percentage); **mean (standard deviation); Index
number represents the total number of patients for whom laboratory data were analyzed:1148 patients,2150 patients,3151 patients,4153
patients,5145 patients,6146 patients and7127 patients. BMI - body mass
index; hsCRP - high-sensitivity C-reactive protein; ECG - electrocardiogram.
Table 2 -Association between symptoms and the presence or absence of angiographic coronary atherosclerosis.
Coronary Artery
Normal Angiographic CAD Total Clinical
condition Patients % Patients % N %
SA 41 97.6 55 49.5 96 62.7
UA 1 2.4 40 36.0 41 26.8
AMI 2 2 16 14.4 16 10.5
Total 42 100.0 111 100.0 153 100.0
NT-proBNP and monocytes were associated with angio-graphic CAD, regardless of whether categorical or quantita-tive variables were considered (Tables 3 and 5).
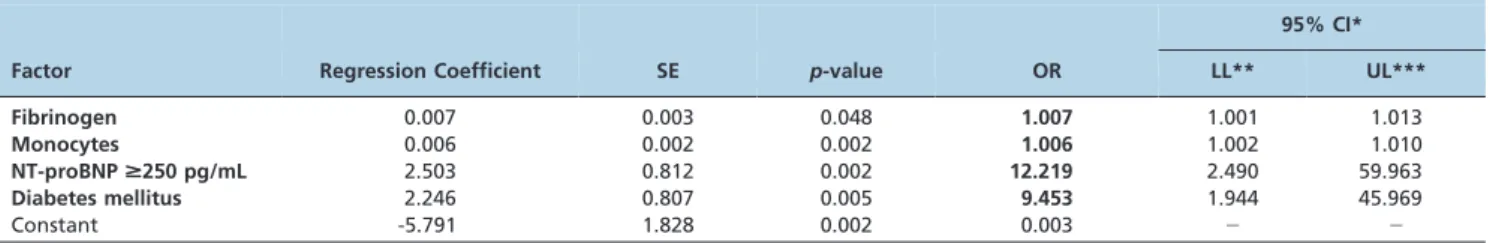
The variables chosen for inclusion in the multivariate analysis were those that were assessed in the univariate analyses and that were also significantly associated with angiographic CAD. These variables included the following: diabetes mellitus, BMI, increased abdominal circumference, systolic dysfunction on echocardiography, NT-proBNP levels$250 pg/mL, fibrinogen levels.500 mg/dL, creati-nine, statin use and a monocyte count .501/mm3. As shown in Table 6, an NT-proBNP level $250 pg/mL, the presence of diabetes, an increased fibrinogen concentration and an increased monocyte count were the only variables significantly associated with the presence of angiographic CAD in the multivariate analysis. Thus, patients with an NT-proBNP level$250 pg/mL had an 11.21-fold increased risk of angiographic CAD. The same result was also observed in patients with diabetes (8.45-fold increase) and patients with a one-unit increase in the number of circulating monocytes (regression coefficient=0.006) or a 1 mg/dL increase in the plasma fibrinogen concentration (regression coefficient=0.007).
Patients with NT-proBNP levels greater than twice the upper limit of normal ($250 pg/mL) had an odds ratio of 4.94 (confidence interval [CI]: 95% [1.91-12.76]) for angio-graphic CAD compared with individuals with a lower NT-ProBNP level (Table 4). Furthermore, the association of this increase in NT-proBNP with angiographic CAD persisted in the multivariate analysis, with an odds ratio of 12.21 (CI: 95% [2.49-59.96]) and was superior even to the association of diabetes mellitus with angiographic CAD in a statistical model that included creatinine and systolic dysfunction (Table 6).
In this study, in which 72% of patients exhibited coronary artery occlusion (111 of 153 patients), the model indicated an accuracy of 79.7%, a sensitivity of 80.4% and a specificity of 76.9% for the diagnosis of angiographic CAD, considering adjustments for prevalence.
Table 3 -Comparison of Groups A and B with respect to categorical variables.
Coronary Artery
Factor Normal
Angiographic coronary
atherosclerosis p-value
Men* 16 (38.1) 62 (55.9) 0.069
Women* 26 (61.9) 49 (44.1)
---Smokers/Ex-smokers* 23 (54.8) 68 (61.3) 0.605
Non-smokers * 19 (45.2) 43 (38.7)
---Diabetes mellitus* 9 (21.4) 46 (41.4) 0.024
BMI$30* 21 (50) 27 (24.3) 0.003
Increased abdominal circumference * 35 (83.3) 72 (64.9) 0.030
Statin users * 3 (7.1) 77 (69.4) ,0.001
Family history of early-onset atherosclerosis * 13 (31) 26 (23.4) 0.406
Hypertension* 37 (88.1) 89 (80.2) 0.343
hsCRP.1 mg/L2* (151 p) 36 (87.8) 89 (80.9) 0.111
Total leukocytes.7500/mm3* 15 (35.7) 58 (52.3) 0.064
Fibrinogen.350 mg/dL * (150 p) 7 (17.1) 42 (38.5) 0.019
NT-proBNP$125 pg/mL * (145 p) 7 (17.9) 49 (46.2) 0.002
Monocytes.500/mm3* 11 (26.2) 58 (52.2) 0.010
Metabolic syndrome * 36 (85.7) 82 (73.9) 0.136
Non-HDL-cholesterol.160 mg/dL * 17 (40.5) 40 (36.0) 0.686
Low HDL cholesterol * 30 (71.4) 75 (67.6) 0.865
Total cholesterol/HDL-C ratio,5* 16 (38.1) 47 (42.3) 0.714
LDL-C/HDL-C ratio,3.5* (148 p) 21 (52.5) 63 (58.3) 0.577
Systolic dysfunction on echocardiography * (127 p) 1 (3.4) 24 (24.5) 0.015
Abnormal chest radiography * (146 p) 7 (17.9) 25 (23.4) 0.652
Abnormal ECG * 29 (69.0) 86 (77.5) 0.299
*Absolute number (and percentage) of patients; hsCRP - High-sensitivity C-reactive protein; ECG - Electrocardiogram.
Table 4 -Odds ratios for categorical variables significantly associated with the presence of angiographic coronary atherosclerosis.
95% Confidence interval Factor OR LL* UL** Diabetes Mellitus
No 1.000 2 2
Yes 29.441 8.505 101.912
BMI kg/m2
BMI,30 1.000 2 2
BMI$30 0.321 0.153 0.677
Abdominal circumference
Normal 1.000 2 2
Increased 0.369 0.150 0.908
Statin use
No 1.000 2 2
Yes 2.595 1.134 5.940
Fibrinogen mg/dL
#350 1.000 2 2
351-500 1.685 0.701 4.053
.500 4.333 1.483 12.658
NT-proBNP pg/mL
,125 1.000 2 2
125#NT-proBNP,250 2.029 0.778 5.296
$250 4.941 1.913 12.761
Monocytes cells/mm3
#500 1.000 2 2
501-750 2.574 1.137 5.827
$751 8.189 1.027 65.323
Systolic dysfunction
No 1.000 2 2
Yes 9.081 1.172 70.337
& DISCUSSION
This study was conducted in patients commonly admitted to hospital wards, which explains why the majority of patients presented with stable angina rather than unstable angina or acute myocardial infarction. The indication for coronary angiography reveals the need to identify or exclude the presence of angiographic CAD.
The findings of angiographic CAD in 111 patients and normal coronary angiography in 42 patients were similar to those in previous reports in the literature that describe individuals with clinical signs of angina pectoris who underwent coronary angiography (19).
Diabetes mellitus was observed in more than one-third of patients and was more frequent in the group with angiographic CAD than the group with angiographically normal arteries. These results are consistent with the literature (2).
Abdominal and total obesity were more frequent in group A than in group B. Conceivably, the presence of both obesity and metabolic syndrome biased the clinical suspi-cion of angina pectoris and the indication of coronary angiography in our patients, which may help explain our findings.
Hypertension was the most prevalent risk factor among those identified in this study, but its presence did not differ between groups A and B. Although hypertension favors the occurrence of atherosclerosis (2) due to its contribution to left ventricular hypertrophy, the increase in oxygen con-sumption, the generation of endothelial dysfunction and the reduction in coronary flow reserve, it can lead to angina pectoris even in patients with normal coronary artery angiography (20).
In this study, the total leukocyte count was significantly higher in the group with angiographic CAD compared with the group with normal coronary arteries, which may indicate the important role of this factor in the underlying inflammatory condition of atherosclerotic disease. Nasir et al. reported that among the leukocytes, monocytes are most significantly and independently associated with peripheral artery disease in the presence of a reduced ankle-brachial blood pressure index (21). Increases in monocytes are also strongly correlated with CAD even after adjusting for smoking and other risk factors (22). Our findings are consistent with the literature because increased monocyte counts showed an odds ratio of 2.57 for angiographic CAD patients compared with those with normal coronary arteries.
Table 6 -Multivariate logistic regression analysis of angiographic coronary atherosclerosis - estimation of odds ratios in the presence of diabetes mellitus, N-terminal fragment of pro-B-type natriuretic peptide level.250 pg/mL, increased fibrinogen concentration and increased monocyte count.
95% CI* Factor Regression Coefficient SE p-value OR LL** UL*** Fibrinogen 0.007 0.003 0.048 1.007 1.001 1.013
Monocytes 0.006 0.002 0.002 1.006 1.002 1.010
NT-proBNP$250 pg/mL 2.503 0.812 0.002 12.219 2.490 59.963
Diabetes mellitus 2.246 0.807 0.005 9.453 1.944 45.969
Constant -5.791 1.828 0.002 0.003 2 2
*Confidence interval; ** LL-Lower Limit, UL-Upper Limit ***
Table 5 -Comparison of Groups A and B with respect to quantitative variables.
Coronary Artery
Factor Normal Angiographic CAD p-value
Age* (years) 60.23 (9.52) 63.38 (11.58) 0.090
BMI* 30.20 (4.07) 27.73 (4.48) 0.002
Abdominal circumference.* - cm 97.92 (10.84) 95.05 (9.17) 0.102
hsCRP* - mg/L (151 p) 0.26 (0.20) 0.88 (2.92) 0.386
Total leukocytes/mm3* 6859.5 (1941.1) 7662.9 (2126.2) 0.034
Fibrinogen * - mg/dL (150 p) 401.5 (80.6) 474.8 (127.3) 0.002
NT-proBNP - pg/mL* (145 p) 435.8 (1375.7) 719.3 (1272.5) 0.001
Monocytes/mm3* 413.9 (140.2) 545.2 (206.5) ,0.001
Non-HDL cholesterol - mg/dL* 150.8 (40.1) 147.0 (43.1) 0.620
HDL cholesterol* - mg/dL 34.9 (10.4) 35.7 (12.5) 0.548
Total cholesterol * - mg/dL 185.8 (43.0) 182.6 (45.7) 0.697
LDL cholesterol* - mg/dL (148 p) 117.4 (39.1) 112.4 (37.9) 0.489
VLDL cholesterol* - mg/dL (148 p) 34.1 (15.3) 32.3 (13.5) 0.481
Triglycerides* - mg/dL 188.6 (112.2) 172.7 (100.2) 0.430
Uric acid* - mg/dL 5.51 (1.4) 5.5 (1.3) 0.987
Urea* - mg/dL 35.1 (6.4) 40.0 (19.2) 0.997
Creatinine* - mg/dL 0.79 (0.22) 0.93(0.40) 0.031
EFLV - % - (127 p) 61.1 (8.58) 57.2 (11.27) 0.260
LV -DD % - (127 p) 33.1 (6.46) 31.1 (7.07) 0.441
*mean (standard deviation); hsCRP: High-sensitivity C-reactive protein; EFLV: Ejection fraction of the left ventricle; LV: Left ventricle;
A meta-analysis involving 154,211 healthy individuals demonstrated an association between increased fibrinogen and the incidence of CAD, even after adjusting for common risk factors and high-sensitivity C-reactive protein (23). Levenson et al. found that the presence and extent of asymptomatic atherosclerosis in the carotid and femoral arteries and in the abdominal aorta were independently related to the plasma fibrinogen level of a never-treated male population with increased cardiovascular risk (24).
However, it is debatable whether plasma fibrinogen is a causative factor of or merely a marker for CAD (25,26). Regardless of whether it is a marker or mediator of atherosclerosis, we demonstrated that patients in the present study with higher plasma levels of fibrinogen had an odds ratio of 4.33 for angiographic CAD compared with those with normal coronary arteries.
Epidemiological evidence shows that C-reactive protein, when considered alone, is even suggested to be a marker of atherosclerosis, exhibiting a higher value than that of LDL-C (2). In our study, the level of C-reactive protein could have been underestimated. In the angiographic CAD group, most of the patients took simvastatin; in just 14 days, this medication can reduce the plasma concentration of C-reactive protein by up to 25%, regardless of its effect on LDL-C (27) and therefore likely contributed to the similar findings regarding dyslipidemia in the two groups.
In clinical practice, asymptomatic patients and patients with chest pain who have significant risk factors for atherosclerosis are commonly diagnosed with CAD. Therefore, a noninvasive method of examination that could identify individuals most likely to be diagnosed with CAD would be useful prior to submitting them to coronary angiography. With this consideration, chest radiography is limited to the exclusion of other causes of chest pain (11). In the present study, chest radiography was only abnormal in 22.0% of subjects and did not differ between groups A and B. Additionally, electrocardiogram was also ineffective (10) and was abnormal in 75.0% of our patients, with no difference between patients with normal arteries or CAD.
Moreover, systolic dysfunction assessed by echocardio-graphy is also inappropriate for the diagnosis of CAD (12). As a categorical variable, systolic dysfunction was signifi-cantly more common in group B than in group A, but it was observed in only 20.0% of the entire patient population and was not indicative of CAD, regardless of whether it was analyzed as a quantitative variable or in the multivariate analysis.
However, the increase in plasma NT-proBNP, found in 60.0% of patients, was much more frequent than systolic dysfunction. Indeed, NT-proBNP was higher in patients with angiographic CAD than in group A, suggesting the utility of this biochemical marker as a non-invasive method for the identification of CAD (28).
These findings are consistent with the literature; increased BNP and NT-proBNP levels have been shown to be related to the severity of coronary atherosclerosis and ischemic myocardial impairment independent of ventricular function (29). Therefore, even in the absence of left ventricular dysfunction, myocardial ischemia has been shown to augment cardiac BNP gene expression and increase plasma BNP and proBNP concentrations. Thus, elevated BNP and proBNP concentrations do not necessarily reflect heart failure but may result from cardiac ischemia (30).
According to Wolber et al., who measured NT-proBNP levels in 781 consecutive patients with normal left ventricular function referred for coronary angiography due to symptoms or signs of CAD, this peptide may be a marker of non-obstructive CAD and significant coronary stenosis (28).
As acute myocardial infarction and sudden cardiac death are occasionally the first manifestations of CAD, the concentrations of these peptides may help identify patients with myocardial ischemia who are not diagnosed through routine exams. They may also help stratify the risk of acute cardiovascular events, similar to their use in the stratifica-tion of patients with diabetes or those recovering from stroke (31). However, NT-proBNP and BNP levels are also increased during kidney failure, ventricular hypertrophy, diastolic dysfunction, atrial fibrillation, valvular heart disease, cardiotoxicity, sepsis, hyperthyroidism, liver cir-rhosis, pulmonary embolism and even right heart failure secondary to chronic lung disease (32).
In the present study, NT-proBNP levels were increased to more than twice the upper limit of normal. In addition, rigorous clinical and laboratory analyses attenuated con-founding factors. In our opinion, the significant correlation found between elevated NT-proBNP levels and angio-graphic CAD most likely resulted from the pooled analysis of patients with stable angina or acute coronary syndrome because the elevation of this peptide is much higher in the latter condition (29). Notably, the correlation between increased NT-proBNP and the presence of angiographic CAD was also consistent with the release of BNP by coronary atheromatous plaques (33).
In the present study, the correlation between chronic nephropathy and angiographic CAD, although significant (p= 0.031) the quantitative analysis, detected by the increased creatinine in group B was not verified in the multivariate model, perhaps because patients with renal failure requiring dialysis were excluded from our study.
It is important to mention the lack of correlation of angiographic CAD with smoking, a positive family history of early atherosclerosis, hypertension, increased high-sensitivity C-reactive protein, metabolic syndrome, abnor-mal cholesterol and obesity. However, as previously discussed, several of these factors cause or are correlated with angina pectoris in angiographically normal coronary arteries (19,20,34).
followed the same rationale as that described in those two studies (35,36). However, it is worth noting that the population studied by Ndrepepa, namely, European individuals, and the patients evaluated by Sakai, namely, Japanese individuals, are genetically much more homoge-neous than the individuals included in our study, which was primarily composed of multiracial individuals. Despite this difference, we reached similar conclusions. As reviewed by Albert, elevations in markers of inflammation and thrombo-sis, such as high-sensitivity C-reactive protein and fibrino-gen, are also associated with increased cardiovascular disease risk, and few data are available across racial/ethnic groups given that most of the studies were performed in Caucasian populations (37). Thus, our study, together with several other studies, adds support for the use of NT-proBNP in the clinical setting as one possible marker of CAD. In our study, the association between NT-proBNP and CAD did not establish causality. We also note that the main limitation of our study is the small number of patients included. The small sample size used, compared with other studies (28), can be partially explained by the fact that our study was performed at only one institution, as well as by the exclusion criteria adopted. Despite these limitations, we were able to identify a statistically significant clinical correlation between plasma levels of NT-proBNP and coronary atherosclerosis.
Therefore, in this study, we showed that plasma NT-proBNP, diabetes mellitus, circulating monocytes and fibrinogen were positively correlated with angiographic CAD. The association of these variables in a model adjusted for the presence of systolic dysfunction and plasma crea-tinine had a sensitivity of 80.4%, specificity of 76.9% and diagnostic accuracy of 79.7% for the diagnosis of angio-graphic CAD.
& AUTHOR CONTRIBUTIONS
Ribeiro DG designed the study, collected and interpreted the data and prepared the manuscript. Silva RP designed the study and interpreted the data. Barboza DR collected the data. Lima-Ju´nior RC prepared the manuscript. Ribeiro RA is a fellow of the Conselho Nacional de Desenvolvimento Cientı´fico e Tecnolo´gico and was responsible for study design and data interpretation. All the authors read and approved the final version of the manuscript.
& REFERENCES
1. Hansson GK. Inflammation, Atherosclerosis, and Coronary Artery Disease. N Engl J Med. 2005;352(16):1685-95.
2. Ridker PM, Libby P. Risk Factors for Atherothrombotic Disease. In: BRAUNWALD, E. (Ed.). Braunwald’s Heart Disease: a textbook of cardiovascular medicine. 8th ed. Philadelphia: Saunders Elsevier, 2008:1003-27.
3. Packard RRS, Libby P. Inflammation in Atherosclerosis: From Vascular Biology to Biomarker Discovery and Risk Prediction. Clin Chem. 2008;54(1):24-38.
4. Van Ditzhuijzen NS, Van Beusekom HM, Ligthart JM, Regar E. Invasive imaging of the coronary atherosclerotic plaque. Minerva Cardioangiol. 2012;60(3):305-29.
5. Daniels LB, Maisel AS. Natriuretic Peptides. J Am Coll Cardiol. 2007;50(25):2357-68, http://dx.doi.org/10.1016/j.jacc.2007.09.021. 6. Grundy SM, Brewer Jr B, Cleeman JI, Smith Jr SC, Lenfant C. for the
Conference Participants. NHLBI/AHA Conference Proceedings. Definition of Metabolic Syndrome. Report of the National Heart, Lung, and Blood Institute/American Heart Association Conference on Scientific Issues Related to Definition. Circulation. 2004;109(3):433-8, http://dx.doi.org/10.1161/01.CIR.0000111245.75752.C6.
7. Report of the Expert Committee on the Diagnosis and Classification of Diabetes Mellitus. Diabetes Care. 1997;20(7):1183-97.
8. Chobanian AV, Bakris GL, Black HR, Cushman WC, Green LE, Izzo Jr JL, et al. The Seventh Report of the Joint National Committee
on Prevention, Detection, Evaluation, and Treatment of High Blood Pressure. JAMA. 2003;289(19):2560-72, http://dx.doi.org/10.1001/jama. 289.19.2560.
9. Selwyn AP, Braunwald E. Ischemic Heart Disease. In: Kasper DL, Braunwald E, Fauci AS, Hauser SL, Longo Dl, Jameson JL. (Eds.) Harrison’s Principles of Internal Medicine. 16th ed. New York: The McGraw-Hill Companies, Inc., 2005:1434-44.
10. Mirvis DM, Goldberger AL. Electrocardiography. In: BRAUNWALD, E. (Ed.). Braunwald’s Heart Disease: a textbook of cardiovascular medicine. 8th ed. Philadelphia: Saunders Elsevier, 2008:149-90.
11. Bettmann MA. The Chest Radiograph in Cardiovascular Disease. In: BRAUNWALD, E. (Ed.). Braunwald’s Heart Disease: a textbook of cardiovascular medicine. 8th ed. Philadelphia: Saunders Elsevier, 2008:327-43.
12. Connolly HM, Oh JK. Echocardiography. In: BRAUNWALD, E. (Ed.). Braunwald’s Heart Disease: a textbook of cardiovascular medicine. 8th ed. Philadelphia: Saunders Elsevier, 2008:227-314.
13. Friedwald WT, Levy RI, Fredrickson DS. Estimation of the concentration of low density lipoprotein cholesterol in plasma, without use of the preparative ultracentrifuge. Clin Chem. 1972; 18(6):499-502.
14. CRP (La´tex) HS Package Insert. Available at: http://www.roche-diagnostics.us. Accessed June 01, 2009.
15. proBNP Package Insert. Available at: http://www.roche-diagnostics.us. Accessed June 01, 2009.
16. Popma JJ. Coronary Arteriography and Intravascular Imaging. In: BRAUNWALD, E. (Ed.). Braunwald’s Heart Disease: a textbook of cardiovascular medicine. 8th ed. Philadelphia: Saunders Elsevier, 2008:465-500.
17. Fliess J. Statistical Methods for Rates and Proportions. 2ndEd. New York.
John Wiley & Sons. 2000.
18. Suresh K, Chandrashekara S. Sample size estimation and power analysis for clinical research studies. J Hum Reprod Sci. 2012;5(1):7-13, http://dx. doi.org/10.4103/0974-1208.97779.
19. Bugiardini R, Merz CNB. Angina With ‘‘Normal’’ Coronary Arteries. A Changing Philosophy. JAMA. 2005;293(4):477-84, http://dx. doi.org/10.1001/jama.293.4.477.
20. Opherk D, Mall G, Zebe H, Schwarz F, Weihe E, Manthey J, et al. Reduction of coronary reserve: a mechanism for angina pectoris in patients with arterial hypertension and normal coronary arteries. Circulation. 1984;69(1):1-7, http://dx.doi.org/10.1161/01.CIR.69.1.1. 21. Nasir K, Guallar E, Navas-Acien A, Criqui MH, Lima JAC. Relationship
of Monocyte Count and Peripheral Arterial Disease. Results From the National Health and Nutrition Examination Survey 1999-2002. Arterioscler Thromb Vasc Biol. 2005;25(9):1966-71, http://dx.doi.org/ 10.1161/01.ATV.0000175296.02550.e4.
22. Olivares R, Ducimetie`re P, Claude JR. Monocyte count: a risk factor for coronary heart disease? Am J Epidemiol. 1993;137(1):49-53.
23. Danesh J, Lewington S, Thompson SG, Lowe GDO, Collins R. Fibrinogen Studies Collaboration. Plasma Fibrinogen Level and the Risk of Major Cardiovascular Diseases and Nonvascular Mortality. An Individual Participant Meta-analysis. JAMA. 2005;294(14):1799-809.
24. Levenson J, Giral P, Razavian M, Gariepy J, Simon A. Fibrinogen and silent atherosclerosis in subjects with cardiovascular risk factors. Arterioscler Thromb Vasc Biol. 1995;15(9):1263-8, http://dx.doi.org/10. 1161/01.ATV.15.9.1263.
25. Reinhart WH. Fibrinogen - marker or mediator of vascular disease? Vasc Med. 2003;8(3):211-6, http://dx.doi.org/10.1191/1358863x03vm494ra. 26. Smith GD, Harbord R, Milton J, Ebrahim S, Sterne JAC. Does Elevated
Plasma Fibrinogen Increase the Risk of Coronary Heart Disease? Evidence from a Meta-Analysis of Genetic Association Studies. Arterioscler Thromb Vasc Biol. 2005;25(10):2228-33, http://dx.doi.org/ 10.1161/01.ATV.0000183937.65887.9c.
27. Plenge JK, Hernandez TL, Weil KM, Poirier P, Grunwald GK, Marcovina SM, et al. Sinvastatin lowers C-reactive protein within 14 days: an effect independent of low-density lipoprotein cholesterol reduction. Circulation. 2002;106(12):1447-52, http://dx.doi.org/10.1161/01.CIR.0000029743.68247. 31.
28. Wolber T, Maeder M, Rickli H, Riesen W, Binggeli C, Duru F, et al. N-terminal pro-brain natriuretic peptide used for the prediction of coronary artery stenosis. Eur J Clin Invest. 2007;37(1):18-25, http://dx.doi.org/10. 1111/j.1365-2362.2007.01731.x.
29. Omland T, de Lemos JA. Amino-terminal pro-B-type natriuretic peptides in stable and unstable ischemic heart disease. Am J Cardiol 2008; 101(3A):61-6, http://dx.doi.org/10.1016/j.amjcard.2007.11.025. 30. Goetze JP, Christoffersen C, Perko M, Arendrup H, Rehfeld JF, Kastrup J,
et al. Increased cardiac BNP expression associated with myocardial ischemia. FASEB J. 2003;17(9):1105-7.
32. Baggish AL, van Kimmenade RR, Januzzi Jr JL. The differential diagnosis of an elevated amino-terminal pro-B-type natriuretic peptide level. Am J Cardiol. 2008;101(3A):43-8, http://dx.doi.org/10.1016/j.amjcard. 2007.11.019.
33. Casco VH, Veinpot JP, Kuroski de Bold ML, Masters RG, Stevenson MM, de Bold AJ. Natriuretic peptide system gene expression in human coronary arteries. J Histochem Cytochem. 2002;50(6):799-809, http://dx. doi.org/10.1177/002215540205000606.
34. Hemingway H, Langenberg C, Damant J, Frost C, Pyo¨rala¨ K, Barrett-Connor E. Prevalence of angina in women versus men: a systematic review and meta-analysis of international variations across 31 countries. Circu-lation. 2008;117(12):1526-36, http://dx.doi.org/10.1161/CIRCULATIONAHA. 107.720953.
35. Ndrepepa G, Braun S, Mehilli J, von Beckerath N, Vogt W, Scho¨mig A, et al. Plasma levels of N-terminal pro-brain natriuretic peptide in patients with coronary artery disease and relation to clinical presenta-tion, angiographic severity, and left ventricular ejection fraction. Am J Cardiol. 2005;95(5):553-7, http://dx.doi.org/10.1016/j.amjcard. 2004.10.034.
36. Sakai H, Tsutamoto T, Ishikawa C, Tanaka T, Fujii M, Yamamoto T, et al. Direct comparison of brain natriuretic peptide (BNP) and N-terminal pro-BNP secretion and extent of coronary artery stenosis in patients with stable coronary artery disease. Circ J. 2007;71(4):499-505.