Contrasting Taxonomic and Phylogenetic
Diversity Responses to Forest Modifications:
Comparisons of Taxa and Successive Plant
Life Stages in South African Scarp Forest
Ingo Grass1*¤, Roland Brandl2, Alexandra Botzat3, Eike Lena Neuschulz4, Nina Farwig1
1Department of Ecology—Conservation Ecology, Faculty of Biology, Philipps-Universität Marburg, Marburg, Germany,2Department of Ecology—Animal Ecology, Faculty of Biology, Philipps-Universität Marburg, Marburg, Germany,3Department of Ecology, Technische Universität Berlin, Berlin, Germany,4Biodiversity and Climate Research Centre (BiK-F) and Senckenberg Gesellschaft für Naturforschung, Frankfurt (Main), Germany
¤ Current Address: Department of Crop Sciences—Agroecology, Georg-August-University Göttingen, Grisebachstrasse 6, Göttingen, Germany
Abstract
The degradation of natural forests to modified forests threatens subtropical and tropical bio-diversity worldwide. Yet, species responses to forest modification vary considerably. Fur-thermore, effects of forest modification can differ, whether with respect to diversity components (taxonomic or phylogenetic) or to local (α-diversity) and regional (β-diversity) spatial scales. This real-world complexity has so far hampered our understanding of sub-tropical and sub-tropical biodiversity patterns in human-modified forest landscapes. In a subtrop-ical South African forest landscape, we studied the responses of three successive plant life stages (adult trees, saplings, seedlings) and of birds to five different types of forest modifica-tion distinguished by the degree of within-forest disturbance and forest loss. Responses of the two taxa differed markedly. Thus, the taxonomicα-diversity of birds was negatively cor-related with the diversity of all plant life stages and, contrary to plant diversity, increased with forest disturbance. Conversely, forest disturbance reduced the phylogeneticα-diversity of all plant life stages but not that of birds. Forest loss neither affected taxonomic nor phylo-genetic diversity of any taxon. On the regional scale, taxonomic but not phylophylo-genetic β-diversity of both taxa was well predicted by variation in forest disturbance and forest loss. In contrast to adult trees, the phylogenetic diversity of saplings and seedlings showed signs of contemporary environmental filtering. In conclusion, forest modification in this subtropical landscape strongly shaped both local and regional biodiversity but with contrasting out-comes. Phylogenetic diversity of plants may be more threatened than that of mobile species such as birds. The reduced phylogenetic diversity of saplings and seedlings suggests losses in biodiversity that are not visible in adult trees, potentially indicating time-lags and contemporary shifts in forest regeneration. The different responses of taxonomic and
a11111
OPEN ACCESS
Citation:Grass I, Brandl R, Botzat A, Neuschulz EL, Farwig N (2015) Contrasting Taxonomic and Phylogenetic Diversity Responses to Forest Modifications: Comparisons of Taxa and Successive Plant Life Stages in South African Scarp Forest. PLoS ONE 10(2): e0118722. doi:10.1371/journal. pone.0118722
Academic Editor:M. Alex Smith, University of Guelph, CANADA
Received:July 4, 2014
Accepted:January 9, 2015
Published:February 26, 2015
Copyright:© 2015 Grass et al. This is an open access article distributed under the terms of the Creative Commons Attribution License, which permits unrestricted use, distribution, and reproduction in any medium, provided the original author and source are credited.
Data Availability Statement:All relevant data are within the paper and its Supporting Information files.
Funding:The study was funded by the Robert Bosch
Stiftung (grant number: 32.5.8043.0004.0. /www.
bosch-stiftung.de). The funders had no role in study design, data collection and analysis, decision to publish, or preparation of the manuscript.
phylogenetic diversity to forest modifications imply that biodiversity conservation in this sub-tropical landscape requires the preservation of natural and modified forests.
Introduction
Subtropical and tropical forests are hotspots of global biodiversity [1]. At the same time, they are among the most threatened ecosystems worldwide, with the ongoing intensification of human land-use posing a particularly high risk [2]. Consequently, subtropical and tropical for-ests are increasingly found only as human-modified forest landscapes [3,4]. This conversion from primary into modified forest has profound effects on the composition of forest communi-ties [4,5]. While, on the one hand, late successional species and forest specialists are highly vul-nerable [3,6], on the other, some species persist or even increase in abundance in modified
forest landscapes [6–8].
However, the assumption that some species are robust towards forest modification becomes problematic when negative effects are masked by a time-lag between habitat modification and
species extinction, resulting in an‘extinction debt’[9,10]. Time-lags are especially pronounced
in long-lived species [11]. For example, the diversity of adult tree species responds only weakly to forest modification, whereas that of saplings or seedlings can already indicate ongoing changes in the patterns of forest regeneration [12]. Furthermore, negative effects of forest mod-ification are typically more readily visible in mobile species such as birds than in sessile species such as plants [11,13].
To focus on species richness (or, more generally, taxonomic diversity; TD) only ignores im-portant aspects of the overall diversity in ecosystems. Many functional traits of species show a phylogenetic signal, such that phylogenetic diversity (PD) is often a more appropriate indicator of functional processes than TD as well as a potential surrogate for functional diversity in many ecosystems [14]. In fact, a higher PD has been shown to enhance ecosystem functioning
and stability [15,16], especially when PD is decoupled from TD [17–19]. In addition,
compari-sons of observed patterns in PD to models simulating random species’distributions allow for
the study of ecological processes that structure species communities, such as limiting similarity
or environmental filtering [20–23].
The relative effects of limiting similarity and environmental filtering on the structure of spe-cies communities may vary considerably at the landscape scale. Indeed, human-modified forest landscapes impose strong species-specific effects on the immigration, extinction, and dispersal rates of species, thereby creating a geographic mosaic of biodiversity [24]. The recognition of
diversity within a community (α-diversity) and among communities (β-diversity) helps us to
understand these processes [19,25]. However, the effects of forest modification onα- andβ
-diversity, both for TD and for PD, in subtropical and tropical forests are still poorly docu-mented, despite their relevance for conservation management and planning [19]. An
informa-tive assessment ofα- andβ-diversity for both diversity types would benefit from a focus on
multiple taxa, as indicators of historic as well as ongoing changes in forest regeneration and community diversity. Tree and bird species are ideally suited for this purpose. For the former, their long generation times and longevity, coupled with their multiple successive life stages, from seedling to adult tree, facilitate direct comparisons of past and contemporary patterns in forest diversity [12]. In fact, previous studies have demonstrated time-lags in the response of tree species to forest loss [11,12]. Birds are well-studied organisms whose local composition strongly reflects within-forest disturbance and local loss in forest cover. Forest-specialist birds
This does not alter the authors’adherence to all the
in particular are highly dependent on structurally rich and sufficiently large forests [7,26]. Fi-nally, both tree and bird species are vital to a functional forest ecosystem and to its associated services to humans [27,28].
Here we studied theα- andβ-diversity within the taxonomic and phylogenetic diversity of
trees and birds in a human-modified forest landscape in subtropical South Africa. For trees, we compared three life stages: adult trees, saplings, and seedlings. The study landscape was mainly characterized by highly diverse indigenous scarp forest. Despite being naturally fragmented and often forming small patches, scarp forests are a taxonomically and phylogenetically highly diverse forest type. In South Africa, their conservation is a priority [29,30], as they are increas-ingly threatened by the intensification and expansion of agriculture as well as by urban sprawl [31]. We selected a wide range of modifications affecting naturally occurring scarp forest that differed in its degree of within-forest disturbance and the size of forest fragments (forest loss). At the outset of the study, it was predicted that increasing forest disturbance and forest loss
would: (1) yield contrasting patterns in the TD and PD of species groups; (2) increase theβ
-diversity of TD and PD, shaping a mosaic of -diversity in this human-modified landscape; and
(3) negatively affect theα- andβ-PD of saplings, seedlings, and birds but impose weaker effects
on theα- andβ-PD of adult trees than on the other species groups, consistent with a time-lag
in the effects of forest modification on forest communities.
Methods
Ethics statement
Permission was obtained from Ezemvelo KZN Wildlife to work within protected areas. Private land owners provided permission to work on their land. The following landowners or compa-nies should be contacted for future permits: G. Archibald (Glen Rosa), M.V. Neethling (Minne-haha), and Lake Eland Game Reserve. Field studies did not involve endangered species and no protected species were sampled. All animal work was conducted according to relevant national and international guidelines. Animal studies were observant only; hence no approval by an eth-ics committee was necessary.
Study region
This study was conducted in a heterogeneous subtropical landscape situated near the eastern
coast of South Africa, within the Vernon Crookes (30°16’S, 30°35’E, 2189 ha) and Oribi Gorge
(30°40’S, 30°18’E, 1850 ha) Nature Reserves and in the surrounding agricultural areas. Seasonal
grassland were located within protected areas. Scarp forest fragments in the agricultural matrix were surrounded by either (3) eucalyptus or (4) sugarcane plantations. (5) Secondary forests whose growth followed the severe overgrazing of scarp forests by cattle were also included; these
forests mainly consist ofAcaciaspecies. Both the structural and the size characteristics of the
forest fragments were investigated as well (see section“Forest fragment characteristics”andS1
Table).
Field surveys
Fieldwork was carried out from January until April 2010 (adult trees, saplings, and seedlings) and from November 2008 until February 2009 (birds). For the plant and bird surveys, six per-manent study plots were established for each of the five above-described forest modifications (Fig. 1). Each plot was situated, wherever possible, in a different forest fragment and consisted
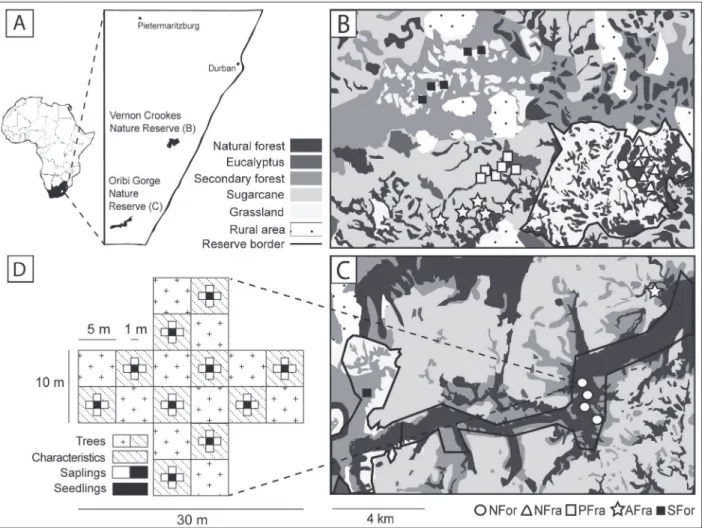
Fig 1. Map of the study area and schematic diagram showing the design of the survey of plant diversity and forest characteristics.(A) The study area in South Africa and the locations of the thirty study plots used for tree surveys within and in the surroundings of the (B) Vernon Crookes and (C) Oribi Gorge Nature Reserves. The main habitat and land-use types are depicted in different gray intensities. Symbols in (B) and (C) refer to the five types of forest modification (NFor = large natural scarp forests; NFra = natural scarp forest fragments; PFra = scarp forest fragments within eucalyptus plantations; AFra = scarp forest fragments within sugarcane plantations; SFor = secondary forests). The schematic diagram in (D) shows the study design used to map adult trees, saplings, and seedlings as well as the environmental characteristics within subplots of the 500-m2study plots. Note that only 27 out of the 30 study
plots were investigated for bird diversity, but the null model analysis of the phylogenetic diversity of plants was based on data from all 30 study plots. Map modified after [33].
of two crossing transects 10 m in width and 30 m in length (covered area 500 m2). Pairwise dis-tances between study plots ranged from 180 to 64,530 m (mean ± SD: 21,380 ± 24,530 m).
Local plant diversity was assessed across the three different successive life stages of trees: adults, saplings, and seedlings. We are aware that the following definitions of these stages are rough and may differ in their applicability within and among different tree species. However, at least in this study, they allowed an efficient assessment of the diversity of tree species with re-spect to past processes (adult trees) as well as contemporary forest regeneration (saplings and
seedlings). We defined adult trees as those with a diameter at breast height (dbh)>5 cm or a
height>4 m and mapped all adult individuals in each of the 500-m2plots. To assess sapling
diversity, ten 5-m2subplots within each study plot were established and all individuals with a
diameter<5 cm at their base or a height>75 cm were mapped. For seedlings, we established
ten 1-m2subplots, and mapped all individuals with a diameter at base<1 cm or a height<75
cm. Species were identified following [34] and [35]. Nomenclature followed the APG III sys-tem. See [33] for more information on plant surveys.
To assess local bird diversity, 15-min point counts from the center of each study plot were conducted. Birds were identified visually or by call. To minimize bias, all point counts were done by one observer (ELN). During the study period, point counts at each study plot were
re-peated three times: 6–10 a.m., 10 a.m.–2 p.m. and 2–6 p.m. Additionally, point counts were
dis-tributed randomly across study plots and carried out only on days without rain or wind. However, due to logistical constraints, only 27 out of the 30 study plots used for plant surveys were investigated for bird diversity. See [7] for more information on bird surveys.
Forest fragment characteristics
Within-forest characteristics (related to forest disturbance), the overall size of forest fragments, and shifts in the surrounding matrix (related to local loss in forest cover) were expected to dif-fer in the five types of modified forest, with subsequent effects on TD or PD. These fragment characteristics were measured as follows:
First, GPS tracking was used to measure the size and edge length of the sampled scarp (or secondary) forests. The perimeter to area ratio was calculated using the edge length and forest size. Second, within each study plot, the percentage cover of living biomass (i.e., the cumulative cover of trunks, branches, vines, and foliage) was estimated at seven layers (0.0 m, 0.5 m, 1.0 m,
2.0 m, 4.0 m, 8.0 m, and 16 m) in ten 25-m2subplots. A sighting tube was used to estimate
can-opy cover at ten randomly chosen locations within the plots. Measures of cancan-opy cover were complemented by measurements of the relative light intensity at each center of the ten subplots used for seedling surveys (in relation to a simultaneously measured reference at a nearby un-shaded spot; luxmeter ATP LX-332). The means of the characteristics (biomass at each layer, canopy cover, and relative light intensity) were then calculated for each study plot. The Shan-non index of the living biomass in the seven layers served as an estimate of vegetation heterogeneity.
decreasing canopy cover and lower biomass at high layers as well as increases in biomass at low layers and a shift from scarp to secondary forests. PC2 was mainly related to fragment size and edge length and to a shift from a natural to an agricultural matrix (S2 Table). Therefore, in the
following, PC1 and PC2 are referred to, respectively, as‘forest disturbance’and‘forest loss’and
they are used to explain the variations in the TD and PD of both the taxa and the successive plant life stages across the study plots.
Phylogenies
For plants, a phylogenetic super-tree of all mapped plant species (irrespective of their life stage) was generated with the software Phylomatic, version 3.0 [37]. The software prunes an online-available mega-tree (http://phylodiversity.net/phylomatic) of all but the requested plant spe-cies. The resulting phylogenetic tree has, however, no defined branch lengths. Branch lengths
were adjusted using the‘bladj’command. The‘bladj’algorithm uses an‘ages’file that provides
age estimates of specific nodes in the phylogeny and then evenly distributes the remaining
un-dated nodes between these estimates. In this study, an upun-dated and recently published‘ages’
file (agescl3; [38]) was used that best matched the internal node names of the most recent mega-tree (R20120829; Markus Gastauer, pers. comm.). Additionally, Bayesian polytomy reso-lution in BEAST was applied [39]. Following [40], we used a constant rate birth-death model anda prioriconstraints on the tree topology from the supplemental R-script of [40]. In total, 11,111,000 permutations were run, with the trees sampled at every 1000th permutation and the first 10% discarded as burn-in, thus yielding a posterior distribution of 10,000 trees. We then calculated a patristic distance matrix of each tree and subsequently averaged across the 10,000 distance matrices to gain a mean phylogenetic distance matrix. This mean distance matrix thus corresponded to the mean phylogenetic distribution of the plant species across the 10,000 sam-pled trees and was used as the plant species phylogeny for all subsequent analyses.
For birds, a recently published global phylogeny of bird species was used [41]. Here,
phylo-genetic trees sampled from a pseudo-posterior distribution were downloaded fromhttp://
birdtree.org. Five thousand trees (each based on the‘Hackett’backbone and covering 9993 spe-cies) were downloaded, with each one then pruned to the bird species recorded in our survey. Next, a mean phylogenetic distance matrix was calculated that was used for all subsequent analyses.
Calculation of diversity components
Diversity components were calculated using a recently proposed framework [42] that
parti-tions species diversity into independentα-,β-, andγ-components, using Rao’s quadratic
entro-py index [43]. Presently, the Rao index is the only measure of species diversity that can be used to investigate its different facets (e.g., TD and PD) within the same mathematical framework [42]. The index also incorporates information on the relative abundances of species and is therefore highly suitable to detect changes in the taxonomic or phylogenetic composition of species communities across environmental gradients. We used the corrected form of the Rao
index as presented in [42] and an additional correction for measures ofβ-diversity values as
proposed in [44]. Multiplicative partitioning was then used to separate regional species
diversi-ty (γ) into within-community (α) and among-communities (β) components. Here,γ-diversity
was defined as given byequation 1:
g ¼ X S
i ¼ 1
XS
whereSis the total number of species in the study region,PiandPjthe relative abundances of
speciesiandjin the region, anddijthe dissimilarity (taxonomic or phylogenetic) between each
pair of speciesiandj. Similarly,α-diversity was defined byequation 2:
a ¼ X S
i ¼ 1
XS
j ¼ 1 dijPiPj
whereSis the total number of species within a given community,PiandPjthe relative
abun-dances of speciesiandj, anddijthe dissimilarity (taxonomic or phylogenetic) between each
pair of coexisting speciesiandj.
To calculate pairwiseβ-diversity between study plots,αandγwere calculated for each pair
of samples, i.e., study plots. Pairwiseβ-diversity was then multiplicatively partitioned as given
byequation 3:
b ¼ gpair ameangpair100
whereγpairis the total species diversity of the two study plots, andαmeanthe mean local
diversi-ty of the pair.
Localα-diversity (Equation 2) and pairwiseβ-diversity (Equation 3) components were
cal-culated for both the TD and the PD of species communities. For PD, we used a distance matrix of the recorded species from patristic distances within their respective phylogenies. Calcula-tions were undertaken for each species group (adult trees, saplings, seedlings, and birds).
A null model analysis was then applied to calculate standardized effect sizes (SES) of PD es-timates to investigate whether the observed PD values differed from those that would be
ex-pected under random community assembly followingequation 4:
SES ¼ ðOBS mean EXPð ÞÞ sdev EXPð Þ
whereOBSare the observed values of theα- orβ-diversity components of PD, andEXPare the
similarly calculated values from a null model distribution. To obtain a distribution of expected
values under random community assembly, we shuffled the taxa labels across the tips of the
species’phylogenies, calculated the expectedα- andβ-diversities, and repeated this process
3000 times. Importantly, for plant species, the full regional phylogeny was used for the null model, i.e., a combination of the phylogenetic trees of adult trees, saplings, and seedlings. Thus, our null model allowed for the full phylogenetic variation across all successive plant life stages. In other words, a given plant species could occupy any position in the phylogeny, whether it was recorded as an adult tree, a sapling, or a seedling. Moreover, all recorded tree species were included in this phylogeny, i.e., also those species that were recorded in the three study plots where no point counts of birds had been conducted. In the following, we refer to the calculated
SES asα-PD andβ-PD. Note that, based on our null model, SES were calculated only for the
PD of the taxa and not for theα-TD orβ-TD components. Furthermore, note thatα-PD could
not be calculated for the saplings in one study plot. Here, only one sapling species was recorded
and the standard deviation of expected values was therefore zero. A statistically significant
pos-itive departure of SES from the null assumption (overdispersion) can indicate effects of limiting
similarity on community assembly [22], and a significant negative departure (underdispersion)
the effects of environmentalfiltering [23,45]. Significant overdispersion and underdispersion
of SES were calculated from the percentage of cases in which the observed values were,
Statistical analyses
Alpha-diversity components. First, differences inα-TD andα-PD among the three suc-cessive plant life stages (adult trees, saplings, seedlings) were investigated. Here, repeated mea-sures ANOVAs were fitted with study plot as random effect. Pairwise differences between successive life stages were investigated with Tukey tests, using the Bonferroni correction for multiple comparisons. Our measures of PD for plants and for birds were based on effect sizes that derived from different null models and thus were not directly comparable. Consequently,
the variations inα-PD between plant life stages and birds were not directly compared in the
same model. However, correlations in the variations ofα-TD andα-PD between plants and
birds were investigated.
Second, the effects of forest disturbance and forest loss onα-TD andα-PD were examined,
with a specific focus on the differences in the responses of the successive plant life stages and between plants and birds. For the former, linear mixed-effects models were fitted with study plot as random effect. These models additionally included the interactions of predictors with successive life stages, which allowed an assessment of the differences in the responses of adult trees, saplings, and seedlings to environmental variation. Furthermore, the UTM coordinates (easting and northing) of the study plots were included to account for spatial trends in the data. For birds, multiple linear regressions were fitted, using forest disturbance, forest loss, and the UTM coordinates as predictors. In statistical notation, the full model for plants can be
ex-pressed byequation 5:
Diversity component~life stage ðforest disturbanceþforest lossþeastingþnorthingÞ þ ð1jstudy plotÞ
and the full model for birds byequation 6:
Diversity component e forest disturbanceþforest lossþeastingþnorthing
where in each model the diversity component is eitherα-TD orα-PD.
Model dredging was used to retain the models with the most likely combinations of
predic-tors. In this approach, a model set based on a global model (Equation 5orEquation 6) is
creat-ed that includes all possible combinations of prcreat-edictors, up to a model including only the intercept [47]. Accordingly, we created a model set for each of the four global models and
com-pared the models within a given set using Akaike’s information criterion for small sample sizes
(AICc). Models withΔAICc<2.0 are generally regarded as equivalently likely [48]. Since we
found multiple models to be equivalently likely, except for the model set on theα-TD of birds
(α-TD of plants: five models;α-PD of plants: eight models;α-PD of birds: two models), we
used model averaging on the models withΔAICc<2.0 in a given model set [47]. Model
averag-ing calculates a weighted mean of parameter estimates, with weights accordaverag-ing to the likelihood of each model [47]. Furthermore, the Akaike weights of the predictors in the averaged model
were calculated as the summed Akaike weights of each model withΔAICc<2.0 in which a
given predictor appeared. Akaike weights range between 0 and 1, with higher values indicating a higher relative importance. All models were fitted using maximum likelihood to enable
com-parisons with AICc[47]. With the exception of life stage, all predictors were Z-transformed to
facilitate comparisons of effect sizes.
As stated above, the Rao index is presently the only diversity measure that can be used to in-vestigate different facets of species diversity within the same mathematical framework [42]. However, to ensure that our results were not biased by our choice of diversity measure, the data were re-analyzed using mean pairwise phylogenetic distances (MPD, see for example
of the MPD were calculated by shuffling the taxa labels across the phylogenies (999 permuta-tions). The analysis generally supported the results on the effects of forest disturbance, forest
loss and spatial trends onα-PD, thus confirming that our findings were not biased by our
choice of phylogenetic measure (S3 Table).
Beta-diversity components. Partial mantel tests were used to investigate changes in theβ
-TD orβ-PD of the successive plant life stages and of birds in response to increasing forest
dis-turbance and forest loss across study plots. Mantel correlations between pairs of study plots were conditioned on an Euclidean plot-plot distance matrix to account for spatial trends. Vari-ation partitioning was applied to assess the variance in diversity components that was ex-plained by forest disturbance, forest loss, and spatial trends [49]. Following [50], spatial eigenvectors were used to account for spatial trends in this analysis. Spatial eigenvectors are particularly suitable for partitioning the species diversity of differently mobile organisms as they capture spatial trends across a range of different spatial scales [51]. The orthogonal spatial eigenvectors of an Euclidean distance matrix of our study plots were derived using principal co-ordinates of neighbor matrices analysis (PCNM). Eigenvectors that significantly explained the
β-TD orβ-PD of species groups were then determined using forward selection based on a
RDA, employing the double-stop criterion atα= 0.050 [52].
Testing for phylogenetic uncertainties. In this study, we used mean phylogenetic
dis-tance matrices of plants and birds to investigate the variations in theα-PD andβ-PD of
taxo-nomic groups and life stages in response to forest modifications. However, this approach may mask phylogenetic variation across the posterior distribution of trees. To confirm that our sta-tistical approach was not biased by phylogenetic uncertainties, we selected 1000 trees from the
posterior distributions of plants and birds and calculated 1000 estimates ofα-PD andβ-PD
based on each of these trees for all species groups. The aforementioned statistical analyses (mixed-effects models with model averaging, partial mantel tests) were then repeated for each of these estimates. The distributions of test statistics showed that the results were similar to
those obtained from the mean phylogenetic distance matrices (S4 Table;S5 Table). Therefore,
we concluded that our findings were robust even in the case of phylogenetic uncertainties. All
statistical analyses were done in the‘R’environment [53], using packages‘lme4’[54],‘MuMIn’
[55],‘packfor’[56], and‘picante’[57].
Results
The 3637 plant individuals that were sampled covered 166 tree species. Among these individu-als, 2150 were adult trees (species richness per study plot [mean ± SD]: 16.6 ± 6.68), 691 were saplings (8.07 ± 3.97), and 796 were seedlings (7.74 ± 4.69). For birds, 738 individuals covering 85 species (13.2 ± 4.13) were recorded.
Alpha-diversity components
There were no differences inα-TD among the successive plant life stages, i.e., adult trees,
sap-lings, and seedlings (repeated measures ANOVA: F2,52= 1.32; p = 0.275;Fig. 2). By contrast, the
α-PD strongly differed (repeated measures ANOVA: F2,50= 1166; p<0.001;Fig. 2), decreasing
with the decreasing age of the trees, from adult trees (2.27 ± 0.0817; mean ± SE throughout) to
saplings (−0.617 ± 0.0586), to seedlings (−0.795 ± 0.0727). For birds, the meanα-PD was−1.45
± 0.200. In five study plots theα-PD of the adult trees was overdispersed, whereas for saplings
and seedlings either it did not differ from random community assembly or it was significantly underdispersed (one and two study plots, respectively). Bird communities were significantly
underdispersed in six of the study plots (Fig. 2). Theα-TD of birds correlated negatively with
p<0.001, saplings: r =−0.578 p = 0.00158, seedlings: r =−0.545; p = 0.00329;S1 Fig.) whereas
there was no correlation between theα-PD of birds and that of any of these life stages (adults:
r =−0.276; p = 0.164, saplings: |r| =<0.001; p = 0.996, seedlings: r =−0.219; p = 0.282;S1 Fig.).
Increasing forest disturbance did not significantly affect theα-TD of any plant life stage but it
did increase theα-TD of birds (Table 1a). For both plants and birds, forest loss had no effect on
either theα-TD or theα-PD (Table 1a, 1b). However, increasing forest disturbance led to a
sig-nificant loss inα-PD across all plant life stages but had no effect on theα-PD of birds (Table 1b,
Fig. 3). Although the latter were altered by spatial trends, the effects on plants were not signifi-cant (Table 1b).
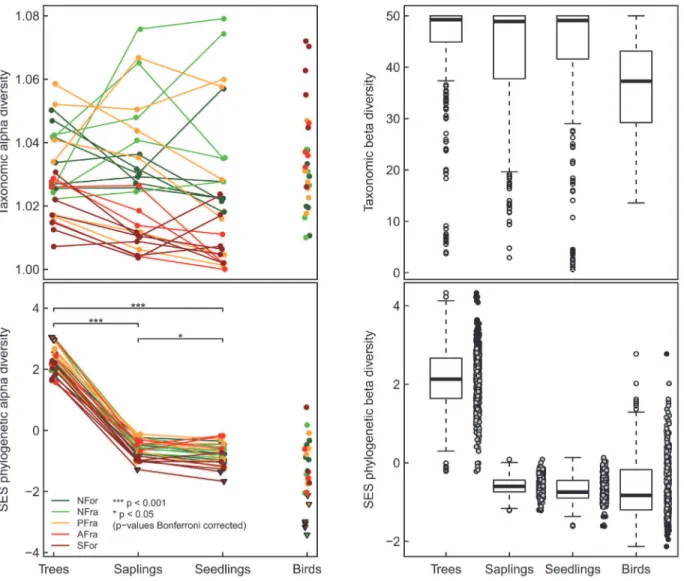
Fig 2. Differences in the taxonomic and phylogeneticα- andβ-diversity between species groups.Significant differences of between-diversity facets for the successive life stages of trees (after Bonferroni correction) are indicated by stars. No significant differences were found for taxonomicα-diversity. Different colors show the five types of forest modification (NFor = large natural scarp forests; NFra = natural scarp forest fragments; PFra = scarp forest fragments within eucalyptus plantations; AFra = scarp forest fragments within sugarcane plantations; SFor = secondary forests). Theβ-diversity facets are shown as boxplots; for phylogeneticβ-diversity, the raw data are presented as well. Note that phylogenetic diversity (gray circles) is based on standardized effect sizes (SES). Triangles (α-diversity) and black circles (β-diversity) indicate significant deviation from the null expectation.
Beta-diversity components
Partial mantel tests showed that with increasing differences in forest disturbance between pairs
of study plots theβ-TD of plants and of birds increased as well (Table 2). Comparable positive
correlations were determined for differences in forest loss and theβ-TD of adult trees and
seed-lings, but not of saplings and birds (Table 2). By contrast, the effects of site-specific differences
in forest disturbance and forest loss on theβ-PD of species groups were weak (Table 2). The
re-sults from variation partitioning confirmed those from the partial mantel tests (Fig. 4). The
cu-mulative variance inβ-TD explained by forest disturbance, forest loss, and spatial trends was in
the range of 35–39% among successive plant life stages and was 25% for birds. While the
sepa-rately explained variances of environmental variables were comparable in size, joint effects
were strongest for forest disturbance and spatial trends (Fig. 4). Unlike theβ-TD, the residual
variation in theβ-PD of species groups after variation partitioning remained considerably
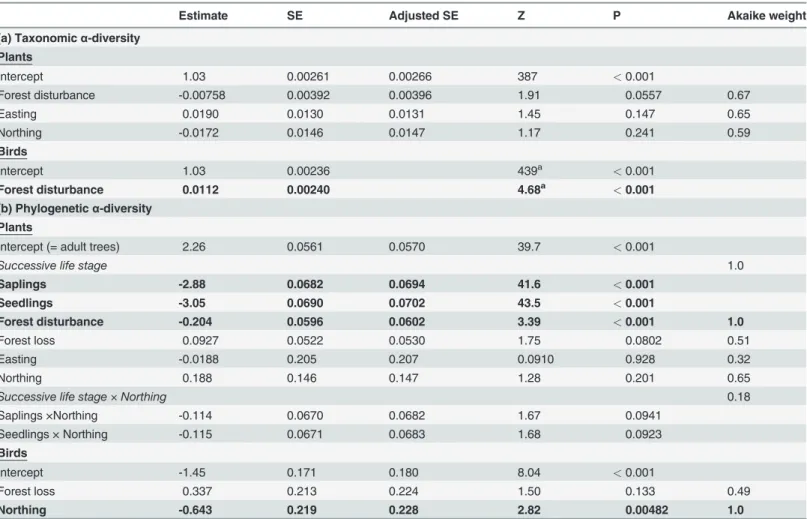
Table 1. Effects of forest disturbance, forest loss, and spatial trends (easting and northing of the study plots) on the taxonomic and phylogeneticα-diversity of species groups.
Estimate SE Adjusted SE Z P Akaike weight
(a) Taxonomicα-diversity
Plants
Intercept 1.03 0.00261 0.00266 387 <0.001
Forest disturbance -0.00758 0.00392 0.00396 1.91 0.0557 0.67
Easting 0.0190 0.0130 0.0131 1.45 0.147 0.65
Northing -0.0172 0.0146 0.0147 1.17 0.241 0.59
Birds
Intercept 1.03 0.00236 439a <0.001
Forest disturbance 0.0112 0.00240 4.68a <0.001
(b) Phylogeneticα-diversity
Plants
Intercept (= adult trees) 2.26 0.0561 0.0570 39.7 <0.001
Successive life stage 1.0
Saplings -2.88 0.0682 0.0694 41.6 <0.001
Seedlings -3.05 0.0690 0.0702 43.5 <0.001
Forest disturbance -0.204 0.0596 0.0602 3.39 <0.001 1.0
Forest loss 0.0927 0.0522 0.0530 1.75 0.0802 0.51
Easting -0.0188 0.205 0.207 0.0910 0.928 0.32
Northing 0.188 0.146 0.147 1.28 0.201 0.65
Successive life stage × Northing 0.18
Saplings ×Northing -0.114 0.0670 0.0682 1.67 0.0941
Seedlings × Northing -0.115 0.0671 0.0683 1.68 0.0923
Birds
Intercept -1.45 0.171 0.180 8.04 <0.001
Forest loss 0.337 0.213 0.224 1.50 0.133 0.49
Northing -0.643 0.219 0.228 2.82 0.00482 1.0
Separate models were calculated for (a) plants and (b) birds. The coefficients from model averaging of equivalently likely models (seeMethods) are shown. Akaike weights yield information on the relative importance of multiple predictors per model. Statistically significant predictors (p<0.050) are shown in boldface type. With the exception of life stage, all predictors were Z-transformed to facilitate comparisons of effect sizes.
aNote that these are t-values from the single
“best”multiple linear regression model; no model averaging was necessary and Z-values are reported for averaged models only.
higher (explained variance: plants = 7–27%; birds = 0%) and separate effects of forest distur-bance, forest loss, and spatial trends were in many cases not statistically significant (Fig. 4).
Discussion
In this study, different degrees of forest disturbance and forest loss imposed contrasting effects
on the taxonomic and phylogeneticα- andβ-diversity of successive plant life stages and birds
in a subtropical landscape. Theα-TD of plants correlated negatively with that of birds for all
Fig 3. Phylogeneticα-diversity of plant life stages and of birds with increasing forest disturbance.The coefficients (lines) after model averaging are shown, as are the raw data (circles) of species groups (green color: trees; yellow: saplings; black: seedlings and birds). Note that phylogenetic diversity is based on standardized effect sizes (SES) and that the scaling of the y-axes differs. Forest loss has been scaled to zero mean and unit variance.
doi:10.1371/journal.pone.0118722.g003
Table 2. Results from partial mantel tests investigating the effects of forests disturbance and forests loss on the taxonomic and phylogeneticβ -diversity among species groups.
Taxonomicβ-diversity Phylogeneticβ-diversity
Forest disturbance Forest loss Forest disturbance Forest loss
Adult trees 0.424*** 0.175** -0.286ns 0.101ns
Saplings 0.490*** 0.0962mar 0.111mar 0.0201ns
Seedlings 0.436*** 0.186** -0.00200ns 0.187*
Birds 0.291** -0.0354ns 0.0272ns -0.153ns
Correlations were conditioned on a spatial distance matrix of the study plots. The correlation coefficients are shown; asterisks indicate the significance level.
***p<0.001; **p<0.010; *p<0.050;
mar= p<0.100; ns= not signi
ficant.
Fig 4. Variation partitioning of taxonomic and phylogeneticβ-diversity of species groups.Venn diagrams illustrate the variation explained by forest disturbance (yellow), forest loss (red), and spatial trends (gray). The combined and separate effects of environmental variables are depicted. Values<0.010 are not shown. No spatial eigenvectors significantly described the variation in the phylogeneticβ-diversity of birds. Statistical significance levels are indicated for separate effects of environmental variables (significances cannot be calculated for joint effects):**p<0.010;*p<0.050;mar= p<0.100;ns= not significant.
successive life stages, whereas forα-PD there was no correlation in the SES between taxa.
For-est disturbance was not related to theα-TD of plants; however, theα-TD of birds increased
with increasing disturbance. By contrast, theα-PD of all plant life stages decreased with
in-creasing forest disturbance, whereas theα-PD of birds was unaffected. At the landscape scale,
the taxonomic, but not the phylogeneticβ-diversity of both taxa was well predicted by
varia-tions in forest disturbance and forest loss. Finally, in contrast to adult trees, the PD of saplings and seedlings showed signs of contemporary environmental filtering, indicating a time-lag in the responses of tree species to present-day changes in landscape structure.
Alpha-diversity components
There was no congruence in theα-TD andα-PD of species groups in response to forest
distur-bance or forest loss. Contemporary forest disturdistur-bance did not reduce theα-TD of any plant life
stage. In our study, forest disturbance was mainly related to a loss of canopy cover, increasing biomass at lower forest layers, and an overall loss in vegetation heterogeneity. Generally, such changes in forest structure have been shown to threaten tree diversity, either directly, via human-induced activities (e.g., logging; [58]), or indirectly, because of a loss of animal-mediated process-es related to plant regeneration (e.g., pollination and seed dispersal of plants; [59]). However, in
the study region these threats were not evident from our results on the variation in theα-TD of
the plants. Previous studies in the same region indicated a high functional connectivity of natural and modified forest fragments, as suggested by the frequent movements of seed dispersers be-tween fragments [60] and the weak effects of the surrounding matrix on forest communities [32,33]. Moreover, given the natural fragmentation of scarp forests and the frequent vegetation changes that occurred over the Pleistocene, these forest communities may have evolved such that
they are highly resistant to contemporary forest disturbance and forest loss [30,61–63]. In fact,
theα-TD of birds increased in disturbed forests, a finding consistent with studies showing that in
birds this type of diversity can be sustained in human-modified tropical landscapes [64]. None-theless, previous studies in the region showed the frequent loss of forest-specialist birds [7,65], which suggests that for these species the negative effects of forest disturbance can be masked by turnovers in community composition [7,66,67]. Interestingly, in addition to the contrasting re-sponses across species groups to forest modification, we found negative correlations between within-fragment measures of plant and bird TD. In other words, forest fragments with a high plant diversity supported a low bird diversity and vice versa. Thus, the conservation of species TD in the study region seems to depend on the preservation of a heterogeneous landscape com-position. Here, even modified forests can make valuable contributions [7,32,68].
Forest disturbance did not affect theα-TD of plants but it reduced theα-PD across their
successive life stages. Amongst others, life-history states that make species more susceptible to local extinction include a slow growth rate, high specialization on mutualistic partners, and
high habitat or resource specialization [65,69–71]. Accordingly, [72] show negative effects of
forest modification on slow-growing and late-successional tree species and increases in the off-spring of fast-growing and early-successional species in our study region. Thus, phylogenetic signal in these or other plant response traits related to forest disturbance may help to explain
the observed changes in the composition of tree communities and losses ofα-PD of plants with
forest disturbance.
Contrary to our expectations and to the reported decline in theα-PD of trees in a fragmented
Brazilian Atlantic forest [69], forest loss in the study region had no effect on theα-PD of any
spe-cies group. Potentially, contemporary and ongoing forest loss in our study was only partially cov-ered by the selected principal component. Furthermore, this result seems to contradict what
of species and areas (e.g., forest cover) are poorly understood and may diverge from more
tradi-tional TD—area relationships. For example, the spillover of distantly related species from the
ag-ricultural matrix may have buffered theα-PD within forest fragments [24]. Also, bird
communities in our study region were found to be overall robust to forest modification (despite losses in forest specialists), with bird individuals frequently dispersing across the agricultural ma-trix [7,60]. The forest fragments in the region support a high functional diversity of birds as well as associated food plants [68], which would at least in part explain the weak effects of forest
dis-turbance and forest loss on theα-PD of the bird species identified in this study.
Beta-diversity components
In contrast to our results on theα-diversities of species groups, forest disturbance and forest
loss imposed overall strong positive effects onβ-TD, but only weak relationships withβ-PD.
Forest disturbance and the loss of forest cover thus amplified a taxonomic species turnover across forest communities, shaping a mosaic of forest biodiversity. Interestingly, local
environ-mental conditions and spatial effects explained more of the variation in theβ-diversities of
plant life stages than in theβ-diversity of birds. Thus, different than in sessile plants, the
mobil-ity of many bird species in the region seems to mitigate the species turnover resulting from local forest modification or isolation by distance [60]. The weaker relationships between forest
modification and theβ-PD of species groups indicated that the taxonomic species turnover did
not follow from the phylogenetic relationships of the involved species. A previous study [73] likewise found that the environmental conditions in six temperate and tropical forest
commu-nities strongly shaped theα-diversity of tree communities, yet poorly predictedβ-PD. Here,
the lack of a phylogenetic signal in those functional traits of plant species that may have
deter-minedβ-PD seemed to be the primary explanation. Similarly, potentially important response
traits in our study system had a weak phylogenetic signal (seeDiscussionon theα-PD of taxa).
Divergent patterns inβ-TD andβ-PD across different environments can occur against a
back-ground of taxonomic species turnover of communities composed of small-range species, while simultaneously these communities are phylogenetically randomly assembled across different geographic distances [25]. Correspondingly, effects of spatial trends on forest communities in
our study were strongest forβ-TD and considerably weaker forβ-PD.
Time-lags in species responses to forest modifications?
Despite the differences in the effects of forest disturbance and forest loss on theα- andβ-PD of
all plant life stages, marked losses in both diversity facets were noted from adult trees to youn-ger life stages. While in some cases the PD of adult trees showed signs of overdispersion, indic-ative of competitive interactions within tree assemblages, the PD of saplings and seedlings suggested either random community assembly or underdispersion. As noted above, underdis-persion may reflect the contemporary effects of environmental filtering on the PD of younger plant life stages [20,21]. This finding suggests that the scarp forest fragments in this study are subject to an extinction debt [9,12]. However, it should be noted that scarp forests have been naturally fragmented since the last glacial maximum [30,61]. Specifically, tree species that are endemic to scarp forests may have evolved adaptations to forest fragmentation that allow them to persist even in an ever more human-shaped forest landscape [62,63]. Moreover, since forest disturbance negatively affected the PD of all plant life stages, it cannot have been the sole driver of the reduced PD in younger life stages. We therefore caution against the conclusion that an
extinction debt of forest communities is the only explanation for the higherα- andβ-PD of
forests there was a lag time in the responses of Myrtaceae species to a loss of forest cover [12]. Another study found that time-lags were most pronounced for tree species and that the diversi-ty of mobile taxa (birds, frogs, and mammals) was more closely related to contemporary pat-terns in forest distribution [11]. Although the effects of forest loss on historically fragmented landscapes, such as our study region, are probably different from those on recently fragmented
landscapes, such as the Brazilian Amazon [62], theα- andβ-PD of birds in our study was the
lowest among all species groups and frequently seemed to be subject to local environmental fil-tering. Following the precautionary principle and to avoid potential future losses in the PD of forest communities, we call on conservation managers and landowners to ensure the preserva-tion of forested areas, especially unprotected scarp forest fragments that may act as refuges and stepping stones within the agricultural matrix.
Supporting Information
S1 Fig. Correlations of taxonomic and phylogeneticα-diversity between life stages of plants
and birds across the 27 study plots. (EPS)
S1 Table. Matrix of environmental variables recorded across the 27 study plots. (DOC)
S2 Table. Results from the principal components analysis on the environmental variables of study plots.Shown are factor loadings of environmental variables, as well as the explained and cumulative proportion of environmental variance across components. Brocken-stick
anal-ysis was used to derive the number of components to be retained for further analanal-ysis (see
Meth-ods). The first principal components (PC1 and PC2) were retained for further analyses. (DOC)
S3 Table. Using mean pairwise phylogenetic distances (MPD) instead of the Rao index for phylogeneticα-diversity gives similar results.Shown are effects of forest disturbance, forest
loss and spatial trends on phylogeneticα-diversity of species groups. Note the similarity in
ef-fect directions and efef-fect sizes to those based on the Rao index shown inTable 1.
(DOC)
S4 Table. Means of test statistics from 1000 repetitions of statistical analyses (seeMethods) on variation in phylogeneticα-diversity of life stages of adult trees, saplings and seedlings
and of birds.Each repetition was based on one of 1000 phylogenetic trees per species group. The last column gives information on the number of analyses in which a predictor appeared in the final averaged model. Note that predictors that appeared in each analysis (n = 1000) also
appear inTable 1b, and that effect sizes are comparable to those based on mean phylogenetic
distance matrices of phylogenetic trees from the posterior distributions (Table 1b). Statistically
significant predictors (p<0.050) are shown in boldface type.
(DOC)
S5 Table. Results of 1000 partial mantel tests on changes in phylogenetic beta diversity of life stages of plants and of birds.Each test was based on one of 1000 phylogenetic trees per species group. Correlations were conditioned on a spatial distance matrix of study plots.
Shown are means and standard deviations of Pearson’s correlation coefficient and p-values.
Correlations with pmean<0.050 are shown in boldface type. Note that effect sizes are
compara-ble to those from the analysis based on a mean phylogenetic distance matrix instead of the pos-terior distribution (Table 2).
Acknowledgments
We thank Ezemvelo KZN Wildlife for research permission within the Oribi Gorge and Vernon Crookes Nature Reserves and all of the South African farmers who granted us access to their land for the purpose of this study. We are indebted to Lena Fischer for assistance with plant surveys and to Christina Potgieter at the Bews Herbarium (Pietermaritzburg) for help with specimen identification. Pravin Pillay, Friederike Voigt, and Sandy-Lynn Steenhuisen provided logistical support. We also thank the two anonymous reviewers for their valuable comments and Wendy Ran for linguistic revision of the manuscript.
Author Contributions
Conceived and designed the experiments: NF RB IG. Performed the experiments: AB ELN. An-alyzed the data: IG RB. Wrote the paper: IG NF RB AB ELN.
References
1. Dirzo R, Raven PH. Global state of biodiversity and loss. Annu Rev Environ Resour 2003; 28: 137–167.
2. Sala O, Chapin F III, Armesto J, Berlow E, Bloomfield J, Dirzo R, et al. Global biodiversity scenarios for the year 2100. Science 2000; 287: 1770–1774. PMID:10710299
3. Gardner TA, Barlow J, Chazdon R, Ewers RM, Harvey CA, Peres CA, et al. Prospects for tropical forest biodiversity in a human-modified world. Ecol Lett 2009; 12: 561–582. PMID:19504750
4. Foley JA, Defries R, Asner GP, Barford C, Bonan G, Carpenter SR, et al. Global consequences of land use. Science 2005; 309: 570–574. PMID:16040698
5. Gibson L, Lee TM, Koh LP, Brook BW, Gardner TA, Barlow J, et al. Primary forests are irreplaceable for sustaining tropical biodiversity. Nature 2011; 478: 378–381. doi:10.1038/nature10425PMID:
21918513
6. Stork NE, Coddington JA, Colwell RK, Chazdon RL, Dick CW, Peres CA, et al. Vulnerability and resil-ience of tropical forest species to land-use change. Conserv Biol 2009; 23: 1438–1447. doi:10.1111/j. 1523-1739.2009.01335.xPMID:20078644
7. Neuschulz E, Botzat A, Farwig N. Effects of forest modification on bird community composition and seed removal in a heterogeneous landscape in South Africa. Oikos 2011; 120: 1371–1379.
8. Ranganathan J, Daniels RJR, Chandran MDS, Ehrlich PR, Daily GC. Sustaining biodiversity in ancient tropical countryside. Proc Natl Acad Sci U S A 2008; 105: 17852–18754. doi:10.1073/pnas.
0808874105PMID:18981411
9. Tilman D, May R, Lehman C, Nowak M. Habitat destruction and the extinction debt. Nature 1994; 371: 65–66.
10. Ferraz G, Russell GJ, Stouffer PC, Bierregaard RO, Pimm SL, Lovejoy TE. Rates of species loss from Amazonian forest fragments. Proc Natl Acad Sci U S A 2003; 100: 14069–14073. PMID:14614134
11. Metzger JP, Martensen AC, Dixo M, Bernacci LC, Ribeiro MC, Teixeira AMG, et al. Time-lag in biologi-cal responses to landscape changes in a highly dynamic Atlantic forest region. Biol Conserv 2009; 142: 1166–1177.
12. Rigueira DMG, Rocha PLB, Mariano-Neto E. Forest cover, extinction thresholds and time lags in woody plants (Myrtaceae) in the Brazilian Atlantic forest: resources for conservation. Biodivers Conserv 2013; 22: 3141–3163.
13. Ewers RM, Didham RK. Confounding factors in the detection of species responses to habitat fragmen-tation. Biol Rev Camb Philos Soc 2006; 81: 117–142. PMID:16318651
14. Srivastava DS, Cadotte MW, MacDonald A, Marushia RG, Mirotchnick N. Phylogenetic diversity and the functioning of ecosystems. Ecol Lett 2012; 15: 637–648. doi:10.1111/j.1461-0248.2012.01795.x
PMID:22583836
15. Cadotte MW. Experimental evidence that evolutionarily diverse assemblages result in higher productiv-ity. Proc Natl Acad Sci U S A 2013; 110: 8996–9000. doi:10.1073/pnas.1301685110PMID:23674676
16. Cadotte M, Dinnage R, Tilman D. Phylogenetic diversity promotes ecosystem stability. Ecology 2012; 93: 223–233.
18. Tucker CM, Cadotte MW. Unifying measures of biodiversity: understanding when richness and phylo-genetic diversity should be congruent. Divers Distrib 2013; 19: 845–854.
19. Devictor V, Mouillot D, Meynard C, Jiguet F, Thuiller W, Mouquet N. Spatial mismatch and congruence between taxonomic, phylogenetic and functional diversity: the need for integrative conservation strate-gies in a changing world. Ecol Lett 2010; 13: 1030–1040. doi:10.1111/j.1461-0248.2010.01493.x
PMID:20545736
20. Webb CO, Ackerly DD, McPeek MA, Donoghue MJ. Phylogenies and community ecology. Annu Rev Ecol Syst 2002; 33: 475–505.
21. Cavender-Bares J, Kozak KH, Fine P, Kembel SW. The merging of community ecology and phyloge-netic biology. Ecol Lett 2009; 12: 693–715. doi:10.1111/j.1461-0248.2009.01314.xPMID:19473217
22. MacArthur RH, Levins R. The limiting similarity, convergence, and divergence of coexisting species. Am Nat 1967; 101: 377–385.
23. Cornwell WK, Schwilk LDW, Ackerly DD. A trait-based test for habitat filtering: convex hull volume. Ecology 2006; 87: 1465–1471. PMID:16869422
24. Tscharntke T, Sekercioglu CH, Dietsch TV, Sodhi NS, Hoehn P, Tylianakis JM. Landscape constraints on functional diversity of birds and insects in tropical agroecosystems. Ecology 2008; 89: 944–951. PMID:18481519
25. Graham CH, Fine PVA. Phylogenetic beta diversity: linking ecological and evolutionary processes across space in time. Ecol Lett 2008; 11: 1265–1277. doi:10.1111/j.1461-0248.2008.01256.xPMID:
19046358
26. Newbold T, Scharlemann JPW, Butchart SHM, Sekercioğlu CH, Alkemade R, Booth H, et al. Ecological traits affect the response of tropical forest bird species to land-use intensity. Proc Biol Sci 2013; 280: 20122131. doi:10.1098/rspb.2012.2131PMID:23173205
27. Sekercioglu C. Increasing awareness of avian ecological function. Trends Ecol Evol 2006; 21: 464– 471. PMID:16762448
28. Myers N. Environmental services of biodiversity. Proc Natl Acad Sci U S A 1996; 93: 2764–2769. PMID:11607645
29. Eeley HAC, Lawes MJ, Reyers B. Priority areas for the conservation of subtropical indigenous forest in southern Africa: a case study from KwaZulu-Natal. Biodivers Conserv 2001; 10: 1221–1246.
30. Lawes MJ. The distribution of the samango monkey (Cercopithecus mitis erythrarchusPeters, 1852 andCercopithecus mitis labiatusI. Geoffroy, 1843) and forest history in southern Africa. J Biogeogr 1990; 17: 669–680.
31. Mucina L, Rutherford MC. The vegetation of South Africa, Lesotho and Swaziland. Pretoria: South Afri-can National Biodiversity Institute; 2006.
32. Neuschulz EL, Grass I, Botzat A, Johnson SD, Farwig N. Persistence of flower visitors and pollination services of a generalist tree in modified forests. Austral Ecol 2013; 38: 374–382. doi: 10.1111/j.1948-7134.2013.12053.xPMID:24581368
33. Botzat A, Fischer L, Farwig N. Forest-fragment quality rather than matrix habitat shapes herbivory on tree recruits in South Africa. J Trop Ecol 2013; 29: 111–122.
34. Boon R. Pooley’s Trees of Eastern South Africa. Durban: Flora and Fauna Publications Trust; 2010.
35. Coates Palgrave M. Keith Coates Palgrave Trees of Southern Africa. 3rd ed. Cape Town: Struik; 2005.
36. Jackson D. Stopping Rules in principal components analysis: a comparison of heuristical and statistical approaches. Ecology 1993; 74: 2204–2214.
37. Webb CO, Donoghue MJ. Phylomatic: tree assembly for applied phylogenetics. Mol Ecol Notes 2005; 5: 181–183.
38. Gastauer M, Meira-Neto JAA. Avoiding inaccuracies in tree calibration and phylogenetic community analysis using Phylocom 4.2. Ecol Inform 2013; 15: 85–90.
39. Drummond AJ, Rambaut A. BEAST: Bayesian evolutionary analysis by sampling trees. BMC Evol Biol 2007; 7: 214. PMID:17996036
40. Kuhn TS, Mooers AØ, Thomas GH. A simple polytomy resolver for dated phylogenies. Methods Ecol Evol 2011; 2: 427–436.
41. Jetz W, Thomas G, Joy J, Hartmann K, Mooers A. The global diversity of birds in space and time. Na-ture 2012; 491: 444–448. doi:10.1038/nature11631PMID:23123857
42. De Bello F, Lavergne S, Meynard CN, LepšJ, Thuiller W. The partitioning of diversity: showing Theseus a way out of the labyrinth. J Veg Sci 2010; 21: 992–1000.
44. Jost L. Partitioning diversity into independent alpha and beta components. Ecology 2007; 88: 2427– 2439. PMID:18027744
45. Grime JP. Trait convergence and trait divergence in herbaceous plant communities: mechanisms and consequences. J Veg Sci 2006; 17: 255–260.
46. Cardillo M. Phylogenetic structure of mammal assemblages at large geographical scales: linking phylo-genetic community ecology with macroecology. Philos Trans R Soc Lond B Biol Sci 2011; 366: 2545– 2453. doi:10.1098/rstb.2011.0021PMID:21807735
47. Grueber CE, Nakagawa S, Laws RJ, Jamieson IG. Multimodel inference in ecology and evolution: chal-lenges and solutions. J Evol Biol 2011; 24: 699–711. doi:10.1111/j.1420-9101.2010.02210.xPMID:
21272107
48. Burnham K, Anderson DR. Model selection and multi-model inference. 2nd ed. New York: Springer; 2002.
49. Borcard D, Legendre P, Drapeau P. Partialling out the spatial component of ecological variation. Ecolo-gy 1992; 73: 1045–1055.
50. Baldissera R, Rodrigues ENL, Hartz SM. Metacommunity composition of web-spiders in a fragmented neotropical forest: relative importance of environmental and spatial effects. PLoS One 2012; 7: e48099. doi:10.1371/journal.pone.0048099PMID:23110180
51. Borcard D, Legendre P. All-scale spatial analysis of ecological data by means of principal coordinates of neighbour matrices. Ecol Modell 2002; 153: 51–68.
52. Blanchet FG, Legendre P, Borcard D. Forward selection of explanatory variables. Ecology 2008; 89: 2623–2632. PMID:18831183
53. R Development Core Team. R: A language and environment for statistical computing; 2014.
54. Bates D, Maechler M, Bolker B, Walker S. lme4: linear mixed-effects models using Eigen and S4. R package version 1.1–6; 2014.
55. Barton K. MuMIn: Multi-model inference. R package version 1.9.13; 2013.
56. Dray S, Legendre P, Blanchet G. packfor: forward selection with permutation (Canoco p.46). R package version 0.0–8/r100; 2011.
57. Kembel S, Cowan P, Helmus M, Cornwell W, Morlon H, Ackerly DD, et al. Picante: R tools for integrat-ing phylogenies and ecology. Bioinformatics 2010; 26: 1463–1464. doi:10.1093/bioinformatics/btq166
PMID:20395285
58. Brown KA, Gurevitch J. Long-term impacts of logging on forest diversity in Madagascar. Proc Natl Acad Sci U S A 2004; 101: 6045–6049. PMID:15067121
59. Albrecht J, Berens DG, Jaroszewicz B, Selva N, Brandl R, Farwig N. Correlated loss of ecosystem ser-vices in coupled mutualistic networks. Nat Commun 2014; 5: 3810. doi:10.1038/ncomms4810PMID:
24806612
60. Neuschulz E, Brown M, Farwig N. Frequent bird movements across a highly fragmented landscape: the role of species traits and forest matrix. Anim Conserv 2013; 16: 170–179.
61. Cooper KH. The conservation status of indigenous forests in Transvaal, Natal and O.F.S., South Africa. Durban: Wildlife Society of Southern Africa; 1985.
62. Lawes MJ, Lamb BCC, Boudreau S, Michael J, Brian CC. Area- but no edge-effect on woody seedling abundance and species richness in old Afromontane forest fragments. J Veg Sci 2005; 16: 363–372.
63. Kotze DJ, Lawes MJ. Viability of ecological processes in small Afromontane forest patches in South Af-rica. Austral Ecol 2007; 32: 294–304.
64. Mulwa RK, Böhning-Gaese K, Schleuning M. High bird species diversity in structurally heterogeneous farmland in western Kenya. Biotropica 2012; 44: 801–809.
65. Grass I, Berens DG, Farwig N. Guild-specific shifts in visitation rates of frugivores with habitat loss and plant invasion. Oikos 2014; 123: 575–582.
66. Menke S, Böhning-Gaese K, Schleuning M. Plant-frugivore networks are less specialized and more ro-bust at forest-farmland edges than in the interior of a tropical forest. Oikos 2012; 121: 1553–1566.
67. Luck GW, Daily GC. Tropical countryside bird assemblages: richness, composition, foraging differ by landscape context. Ecol Appl 2003; 13: 235–247.
68. Berens DG, Chama L, Albrecht J, Farwig N. High conservation value of forest fragments for plant and frugivore communities in a fragmented forest landscape in South Africa. Biotropica 2014; 46: 350–356.
70. Laurance WF, Nascimento HEM, Laurance SG, Andrade AC, Fearnside PM, Ribeiro JEL, et al. Rain forest fragmentation and the proliferation of successional trees. Ecology 2006; 87: 469–482. PMID:
16637371
71. Sodhi NS, Koh LP, Peh KS-H, Tan HTW, Chazdon RL, Corlett RT, et al. Correlates of extinction prone-ness in tropical angiosperms. Divers Distrib 2008; 14: 1–10.
72. Botzat A, Fischer L, Farwig N. Regeneration potential in South African forest fragments: extinction debt paid off or hampered by contemporary matrix modification? Plant Ecol submitted.