1 Universidade de São Paulo, Instituto de Biociências, Programa de Pós-Graduação em Ecologia, São Paulo, SP, Brazil 2 Universidade de São Paulo, Instituto de Biociências, Departamento de Ecologia, São Paulo, SP, Brazil
3 Universidade de São Paulo, Escola de Artes, Ciências e Humanidades, São Paulo, SP, Brazil
4 Universidade Presbiteriana Mackenzie, Centro de Ciências Biológicas e da Saúde, São Paulo, SP, Brazil
5 Universidade de São Paulo, Escola Superior de Agricultura ‘Luiz de Queiroz’, Departamento de Ciências Biológicas, Piracicaba, SP, Brazil 6 Author for correspondence: ral [email protected]
Structure, diversity, and spatial patterns in a permanent
plot of a high
Restinga
forest in Southeastern Brazil
RESUMO
(Estrutura, diversidade e padrões espaciais em uma parcela permanente de l oresta alta de Restinga no Sudeste do Brasil) Nós investigamos a estrutura, diversidade e distribuição de espécies arbóreas em uma parcela de 10,24 ha de uma l oresta alta de Restinga (FAR) no Sudeste do Brasil. Nós amostramos 15.040 indivíduos pertencentes a 45 famílias, 87 gêneros e 116 espécies (densidade= 1.468 árvores ha-1, e área basal= 28,0 m2 ha-1). A riqueza média foi
menor que outros tipos de l orestas tropicais e outras FAR amostradas em menor intensidade, provavelmente pela juventude e hidromori a dos solos na área de estudo. A densidade, área basal, composição e diversidade arbórea variaram consideravelmente de acordo com a classe de tamanho considerada. A parcela estudada teve uma densida-de similar a outras l orestas tropicais, mas com menor área basal (menos indivíduos > 60 cm densida-de diâmetro) e maior densidade de árvores pequenas. Fustes múltiplos não foram frequentes (11% dos indivíduos), mas foram comuns entre as espécies (74% das espécies). A distribuição espacial foi predominantemente agregada, um padrão comum a outros tipos de l orestas tropicais. Além do substrato arenoso, a parcela estudada e outras l orestas de areia branca do mundo tiveram padrões muito similares de estrutura, riqueza e diversidade. Assim, consideramos a FAR como um subtipo evidente de l oresta de areia branca.
Palavras-chave: classes de tamanho de árvores; Floresta Atlântica, fustes múltiplos; riqueza de espécies
Renato Augusto Ferreira de Lima1,6, Alexandre Adalardo de Oliveira2, Adriana Maria Zanforlin Martini2,3,
Daniela Sampaio4, Vinícius Castro Souza5 and Ricardo Ribeiro Rodrigues5
ABSTRACT
(Structure, composition, and diversity of a high Restinga forest in the Southern Atlantic Forest) We assessed the structure, diversity and distribution of tree species in a 10.24-ha permanent plot of high Restinga forest (HRF) in southeastern Brazil. We sampled 15,040 individuals belonging to 45 families, 87 genera and 116 species (density= 1,468 trees ha-1, and basal area= 28.0 m2 ha-1). Mean richness was lower than other types of tropical
forests and other HRFs that have been less intensively sampled, which is probably due to the younger age and hydromorphy of the soils in the study site. Tree density, basal area, species composition, and diversity all varied considerably depending on the size class considered. The studied plot had a density similar to other tropical forests but with a smaller basal area (fewer individuals > 60 cm in diameter), and higher density of smaller trees. Multi-stemmed individuals were not frequent (11% of the trees), though they were widespread among species (74% of the species). Spatial distribution was predominantly clumped, a pattern common to other types of tropical forests. Besides growing over white-sand soils, the PEIC plot and other white-sand forests of the world also had very similar patterns of community structure, richness and diversity. Therefore, we consider the HRF as a recognizable subtype of white-sand forest.
Introduction
One useful way to study tropical forests is via large per-manent inventory plots (Condit 1998), specially designed for the study large-sized, long-lived organisms such as trees. Recently, numerous plots have been established in a variety of types of forests around the world (Losos et al. 2004). However, these permanent plots are restricted to particular types of soils, primarily oxisols and ultisols (Ashton 2004). Still, surprisingly diverse forests grow on a larger number of soil types, including relatively nutrient-poor, white-sand soils (Newbery 1991; Phillips et al. 1994). In Brazil, besides the widespread Amazon campinaranas (Anderson 1981), some coastal forests also grow on sandy soils (mainly spo-dosols), the Restinga forests. h ese forests are known to be lower and less species rich than surrounding rain forests, although sp ecies rich Restinga forests may also be found (César & Monteiro 1995; Guedes et al. 2006; Negrelle 2006).
But what is the typical structure and composition of Restinga forests? How is it dif erent from forests that grow on non-sandy soils? How clumped are trees of dif erent species on such nutrient poor-soils? Is there any evidence of spe-cies being more associated to habitat characteristics than in forests on richer soils? h e answer to these and many other questions are still unavailable because detailed accounts of Restinga forests are largely missing. Plots over 1-ha are rare (Assis et al. 2004; Negrelle 2006), and therefore there is not enough data to properly assess general community-level pat-terns, Restinga population distributions, habitat associations or other features related to the ecology of these forests. For instance, the occurrence of multi-stemmed trees, cited as being typical of Restinga species (Sugiyama 1998;Guedes et al. 2006), has never been properly assessed. In addition, this lack of knowledge also prevents a proper comparison of Restinga forests with other forest types.
Restinga forests are part of the Restinga vegetation complex (or simply Restinga), a typical feature of Brazil-ian coastal plains. By dei nition, it is the vegetation that grows over tertiary or quaternary marine sand deposits. So, although the Restinga forest may be seen as a climax formation in the Restinga complex, it is a very young type of forest, geologically speaking. Besides its young age, the limiting soil conditions makes it a very promising setting in which the mechanisms that control the l oristic composition and structure of tropical forests can be better understand (Scarano 2009). For instance, a low degree of endemism is expected because soils are much younger than other forests on soils developed in situ (Anderson 1981). In this scenario, one may ask if the Restinga composition is the result of sim-ple historical events or if there is local and specii c ecological processes (e.g. competition, facilitation or herbivore pres-sure – Scarano 2002; Fine et al. 2009) that control species establishment and growth. h erefore, the study of tropical forests under such extreme conditions can give us a broader perspective on their structure, composition, and diversity.
In addition, Restingas are very important systems to physical and biological conservation of Atlantic Forest areas. Besides the more obvious important linked to the prevention of sea erosion, Restingas can shelter considerable populations of species that are rare in other Atlantic forest types (Scarano 2009). h is type of vegetation is restricted to narrow spaces along the Atlantic Ocean coastline, places where human settlements are major and constant threats to biodiversity (Rocha et al. 2007). More specii cally, high Restinga forests (HRF) represent one of the most rare and threatened vegetation types of the already deforested Brazil-ian Atlantic Forest (Ribeiro et al. 2009).
Aiming to describe and understand more precisely the composition, structure, diversity, and spatial patterning of Restinga forests at dif erent scales, we present a study of a 10.24-ha plot established in the high Restinga forest of the Parque Estadual da Ilha do Cardoso (PEIC), at 25o S
latitude. h e main goal of this study was to detect general community-level patterns of the plot tree community. We evaluated several dif erent characteristics of the commu-nity such as tree density, basal area, and species richness and how these characteristics vary among dif erent tree size classes. We also assess the frequency and specii city of multi-stemmed individuals in the community. Spatial analyses were carried out for the most abundant species, aiming to describe general patterns of species aggregation.
Methods
Study area
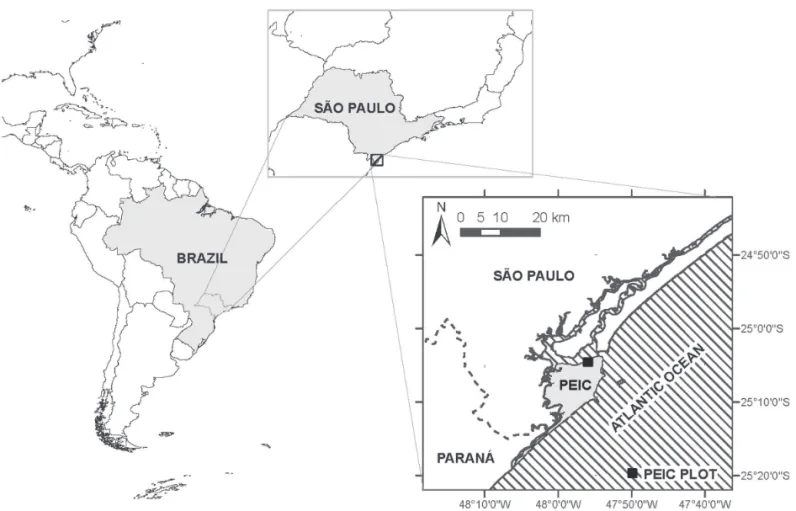
h is study was conducted in the Parque Estadual da Ilha do Cardoso (PEIC), a 13,500-ha continental island located in Cananéia County, in the extreme southern tip of São Paulo State, southeastern Brazil (Fig. 1). Although at 25o S
latitude, the climate is tropical and wet with no dry season (mean annual water surplus= 1,330 mm – Af sensu Köp pen (1948) climate classii cation). Mean annual temperature is 22.4 oC (average daily maximum and minimum are 26.1
and 18.0 oC), mean minimum temperature of the coldest
month is 12.6 oC, and average annual precipitation is 2,261
mm. Only one month (August) has an average precipitation below 100 mm and the average rainfall for the three driest months is 314 mm (DAEE/SP, 2010). Data collection was carried out in a 10.24-ha (320×320 m) permanent plot estab-lished in 2002 (25o04’41”S and 47o55’53”W), subdivided into
256 subplots of 20×20 m (400 m2). h e terrain is l at (altitude
alorthod and histic alaquod) and thionic histosols (terric suli saprists – soil maps, proi les and details on physical and chemical properties can be found in Gomes et al. 2007). h e plot vegetation represents one type of the Atlantic Forest, the high Restinga forest (HRF), a type of forest which grows over marine sand deposits and is equivalent to Lowland tropical rain forest (Holdridge et al. 1971). Vegetation over marine sand deposits covers approximately 18% of the island. h e PEIC has no main geographical barriers except riversseparating it from the continent, which is one of the largest and better conserved landscapes of the Atlantic Forest (Ribeiro et al. 2009). h erefore, there is no evidence of dispersal limitation from the continent and other forest types of the island. In addition, there is no evidence of any recent human disturbance inside the PEIC plot, although it is possible that low intensity selective timber extraction occurred before the establishment of the park in 1962.
Tree census
Tree census followed the Center for Tropical Forest Sci-ence protocol (Condit 1998) except that it only included in-dividuals with stem girth at breast height ≥ 15 cm, equivalent to diameter at breast height (dbh) ≥ 4.8 cm. All individuals were tagged, mapped and identii ed to the species level. h e diameter of each stem of each individual was measured to the nearest 1 mm and the number of stems of multi-stemmed individuals (i.e. with ramii cations of the trunk
below 1.3 m) was counted. Tree height was measured to the nearest 0.5 m for most individuals and was used to estimate mean and maximum canopy heights. Species identii cations were based on several reference collections and the relevant literature. Vouchers were deposited in the Universidade de São Paulo (Campus Piracicaba) herbarium (ESA) under the collection numbers of D. Sampaio. We followed the APG II (2003) system. h e plot was i rst censused in 2002 and then again in 2004/2005; because of improved species-level identii cations in the second census, data presented here refer to the individuals found alive during the second census.
Forest structure and diversity
cally, based on the number of samples required to estimate the total plot richness and on the tendency of stabilization of the curve, following Colwell and Coddington´s (1994) recommendations. Average values of density, basal area, richness, singletons, and Fisher´s alpha and Berger-parker index (Magurran 2004) per hectare were estimated from all possible 1-ha square plots that could be i t in the 10.24-ha plot (n= 144 plots).h e number of singletons per hectare is used here as a practical dei nition of rare species and the Berger-parker index refers to the relative abundance of the most common species. All the analyses were completed for the four size classes in order to assess possible dif erences in the vertical structure of the forest.
Multi-stemmed individuals
h e numbers of stems per individual were evaluated for each species, to detect if the distribution of the number of individuals in dif erent stem categories (1 to 10 stems per individual) was signii cantly dif erent than the distribution observed for the community as a whole. h e distribution observed for each focal species was compared to 1000 ran-dom distributions, obtained by ranran-domly selecting from the community a number of individuals equal to the abundance of the focal species in the plot. For each category of number of stem per individual, weobserved the proportion of ran-dom distributions (simulations) smaller than the number observed for the species in the category. When this propor-tion was equal to or greater than 95%, the observed number was considered to be dif erent than the expected by chance for the whole community (randomization test sensu Manly 2006). To test if the species with the highest proportions of multi-stemmed individuals were also the most abundant species in the plot, we compared the density of each species that had more multi-stemmed individuals than expected by chance with the density of all other species in the plot. Simulation procedures were also used to run this test. In both analyses, we excluded some palms (Euterpe edulis, Geonoma schottiana and Syagrus romanzoi ana) that have strictly monopodial growth habits and one gymnosperm species (Podocarpus sellowii).
Spatial distribution
To describe the spatial patterns of species, the Morisita Index of Dispersion (ID, Krebs 1999) was calculated based on the 20×20 m subplots for each species with more than 70 individuals (n = 40 species). h e observed value of the index for each focal species was compared with a null model that assumed complete spatial randomness of the individu-als (Poisson distribution). h is model was generated from 1000 simulations for the same number of individuals of the focal species. For each simulation, the null ID value was calculated and the distribution of values obtained was used to calculate the probability of the type I error on the statistical inference (Manly 2006). h is approach was only used in the ≥ 4.8 and ≥ 10 cm dbh size classes because of
the small number of individuals per species in the bigger size classes. h e routines used to generate the null models of multi-stemmed individuals (described above) and of complete spatial randomness were developed in R (R De-velopment Core Team 2008) and are available upon request from the authors.
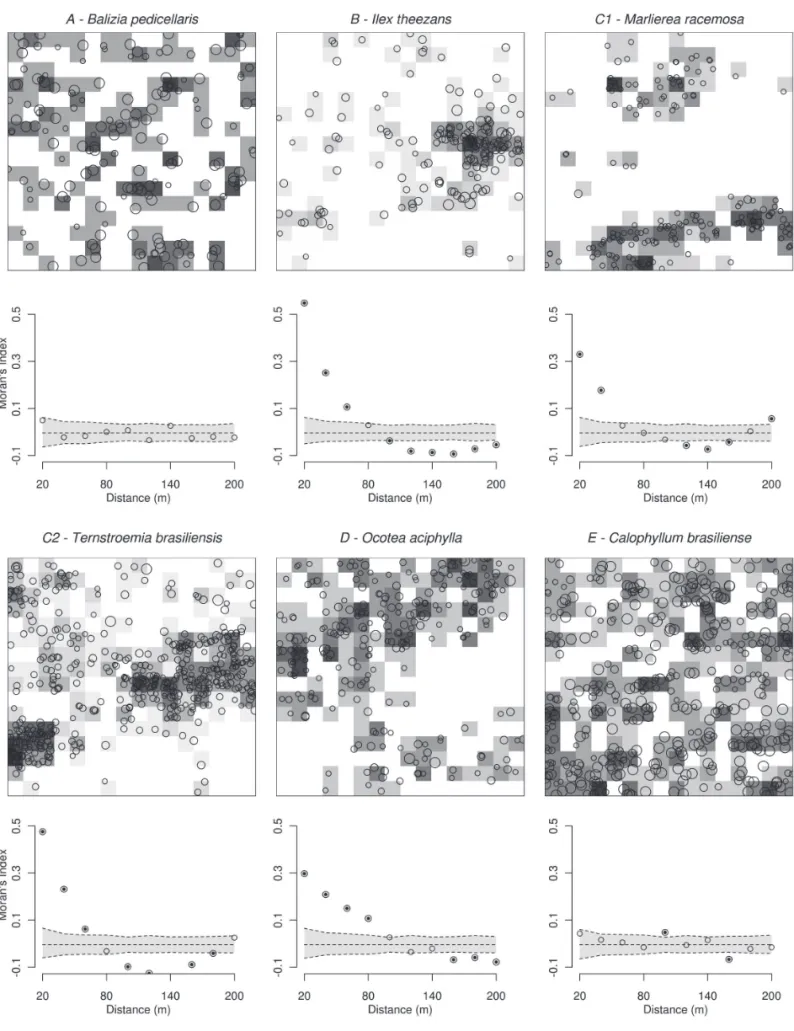
To explore spatial patterns at scales larger than 20 m, we carried out spatial autocorrelation analyses. For the same 40 species with n > 70, the Moran´s index (I) was calculated for dif erent distance classes up to 200 m (corre-lograms, Legendre & Legendre 1998) based on the distance between the 20×20 m subplots. h e global signii cance of the correlogram was tested using the Bonferroni method (Legendre & Fortin 1989) and in cases of signii cant cor-relograms, the values of the coei cients were tested for each scale individually. h is test was performed using a Monte Carlo permutation routine that assigned randomly the ob-served densities for each subplot 1000 times to construct the coni dence envelopes around the null model at each given scale. Positive and signii cant values indicate positive autocorrelation at a given distance class, whereas negative and signii cant values indicate the opposite. h e absence of signii cant values indicates a random or regular distribution at the given distance class. Finally, to illustrate the existing types of spatial distribution, species were separated into gen-eral patterns of spatial distribution (see results for patterns description). h e assignment of species to each pattern was based on the visual inspection of the correlogram and of the distribution map of the species in the plot. h e dei nition of patterns was subjective but we do believe that they are representative examples and that they may be useful to as-sess what mechanisms are inl uencing species distributions.
Results
Forest diversity and composition
We sampled 15,040 individuals that represented a total ba sal area of 290 m2 (Tab. 1). h ese individuals belonged
to 45 families, 87 genera and 116 species. Based on this sample, a total of 126 ± 3.1 (Jackknife 1) tree species was estimated for the HRF of the PEIC. Fisher´s alpha was 17.1 ± 0.6 (Shannon= 3.58) for the entire plot, but the value was slightly greater when calculated for samples of 1-ha (17.9). In the 1-ha subsamples, the number of singletons (13.7 singletons ha-1) was greater than that obtained for the
10.24-ha plot (9 singletons). In contrast, the Berger-Parker index of dominance was more or less the same independent of the sample size. h e rarefaction curve indicated 5.5 ha as the area at which 95% of the total richness was found. In addition, the number of singletons leveled-of around nine at er about 6.5 ha.
most abundant species in the plot was Euterpe edulis with 293.8 ± 154.9 trees ha-1, and a frequency of 99.6%. h e 40
most abundant species in the plot are listed in Tab. 2. Ca-lophyllum brasiliense, Ocotea pulchella, Albizia pedicellaris, Tapirira guianensis, Euterpe edulis and Manilkara subsericea were the species with the largest contribution to basal area (50.2%). Myrtaceae was the richest family (21% of species), followed by Lauraceae (10%), and Fabaceae (5%). Twenty i ve families had just one species in the plot. h e full list of species names and abundances from the 2004/2005 census can be found at http://ecologia.ib.usp.br/labtrop/doku. php?id=labtrop:01_projetos:02_pp:pp_peic:pp_peic#lista_ de_espécies.
Forest structure
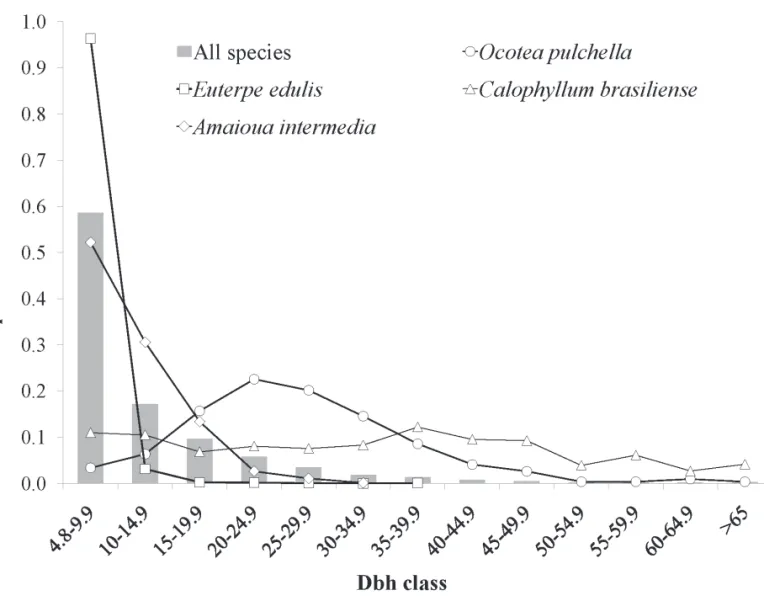
h e increase in tree diameter from 4.8 to 10 cm resulted in the exclusion of 8,811 individuals, that is, almost three i t hs of all individuals in the sample (58.6%). In turn, the total number of singletons increased with the size class considered. h ere was a tendency for higher dive rsity and smaller dominance in the ≥ 10 cm size class (Tab. 1). With respect to dominance, there was a shit in the dominant (i.e. more-abundant species) species among the size classes. Eu-terpe edulis was dominant in the size class ≥ 4.8 cm, Ocotea pulchella was dominant in the mid-size classes (≥ 10 and ≥ 20 cm) and Calophyllum brasiliense was dominant above 30 cm dbh. h e six species with the greatest contribution to basal area (cited above) were also the most common species in the plot canopy (78.3% of trees ≥ 30 cm dbh). Albizia pedicellaris attained the greater average and overall dbh in the plot (34.4 and 85.4 cm, respectively), followed
by Calophyllum brasiliense (mean dbh = 33.1 cm). Together, these two species accounted for 82% of trees ≥ 50 cm dbh in the plot. Besides these two species, only i ve others exceeded 50 cm dbh (i.e. Eugenia sulcata, Myrcia glabra, Manilkara subsericea, Ocotea pulchella, and Tapirira guianensis). All species with individuals present in the plot canopy (dbh ≥ 30 cm) had individuals < 10 cm dbh. In contrast, 26 spe-cies did not exceed 15 ch ere was considerable variance in abundance and, consequently, in species rank order among the dif erent size classes (Tab. 2). Many species´ (45%) abundances gradually declined with increasing size class (e.g.Euterpe edulis, Xylopia langsdori ana, Amaioua intermedia, Andira anthelmia and Schel era angustissima). Small-sized species, as expected, declined drastically with an increase in size class (25% of species), with no or extremely low contributions to the > 20 cm dbh size class (e.g. Mico-nia cubatanensis, Marlierea racemosa, Guatteria australis, Garcinia gardneriana, Alibertia myrciifolia, and Ilex amara). Other species, however, presented a smoother decline in abundance with size classes, rel ecting peaks of abundance at larger size classes (17.5% of species) or abundance values more similar among classes (12.5%). Ocotea pulchella, for instance, had more individuals > 40 cm than < 10 cm dbh, showing a peak of abundance between 20 and 25 cm dbh. Examples of these general patterns of species diameter distribution are illustrated in Fig. 2.
Multi-stemmed individuals
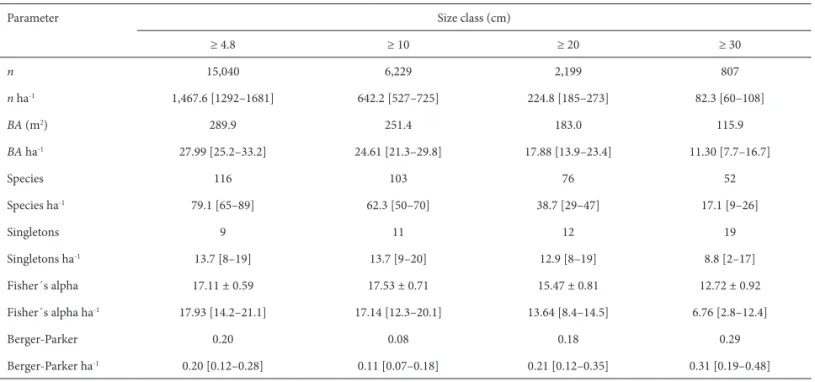
We found 84 species (72%) and 1,623 individuals (10.8%) with two or more stems (mean ± sd: 1.17 ± 0.60 stems indi-vidual-1). Only 233 trees (1.5%) of 36 species (31%) had more Table 1. Total and per hectare values of the main structure and diversity parameters in dif erent size classes in a 10.24-ha plot of high restinga forest. n = total number of individuals; BA= Basal area; Singletons= species with only one individual in the sample. Brackets refer to the 2.5 and 97.5 percentiles of the distribution obtained from 144 one-hectare plots inside the 10.24-ha plot.
Parameter Size class (cm)
≥ 4.8 ≥ 10 ≥ 20 ≥ 30
n 15,040 6,229 2,199 807
n ha-1 1,467.6 [1292–1681] 642.2 [527–725] 224.8 [185–273] 82.3 [60–108]
BA (m2) 289.9 251.4 183.0 115.9
BA ha-1 27.99 [25.2–33.2] 24.61 [21.3–29.8] 17.88 [13.9–23.4] 11.30 [7.7–16.7]
Species 116 103 76 52
Species ha-1 79.1 [65–89] 62.3 [50–70] 38.7 [29–47] 17.1 [9–26]
Singletons 9 11 12 19
Singletons ha-1 13.7 [8–19] 13.7 [9–20] 12.9 [8–19] 8.8 [2–17]
Fisher´s alpha 17.11 ± 0.59 17.53 ± 0.71 15.47 ± 0.81 12.72 ± 0.92 Fisher´s alpha ha-1 17.93 [14.2–21.1] 17.14 [12.3–20.1] 13.64 [8.4–14.5] 6.76 [2.8–12.4]
Berger-Parker 0.20 0.08 0.18 0.29
Table 2.h e 40 most abundant species found in a 10.24-ha plot of high restinga forest and their correspondent abundance, aggregation (Morisita´s index of disper-sion) and distribution pattern (DP). In parentheses, the species rank order in the size classes considered (species with the same abundance received the same rank to avoid overestimation of the real number of ranks per size class). See text for more detail on the distribution patterns of species. Legend to distribution patterns: A – no spatial autocorrelation; B – small isolated patches; C – more than one clump forming large stripes or larger patches more or less isolated; D – big patches covering large areas of the plot; E – no evident pattern.
Species and author Abundance (species rank) Morisita´s index DP ≥ 4.8 cm ≥ 10 cm ≥ 20 cm ≥ 30 cm ≥ 4.8 cm ≥ 10 cm
Euterpe edulis Mart. 3008 (1) 109 (19) 8 (30) 2 (28) 1.192*** 1.696** D
Xylopia langsdori ana A. St.-Hil. & Tul. 946 (2) 136 (15) 10 (32) 3 (26) 1.281*** 1.813*** D
Amaioua intermedia Mart. 837 (3) 400 (2) 32 (17) 1 (34) 1.410*** 1.431*** B
Schel era angustissima (Marchal) Frodin 574 (4) 287 (7) 86 (7) 23 (6) 1.219*** 1.285*** A
Andira anthelmia (Vell.) J.F.Macbr. 548 (5) 278 (8) 34 (15) 4 (18) 1.120** 1.223** D
Ocotea pulchella (Nees) Mez 537 (6) 518 (1) 400 (1) 171 (2) 1.839*** 1.876*** D
Pera glabrata (Schott) Poepp. ex Baill. 526 (7) 309 (6) 50 (11) 5 (15) 1.400*** 1.065ns D
Ternstroemia brasiliensis Cambess. 526 (7) 384 (3) 45 (13) 7 (11) 3.167*** 2.977*** C
Tapirira guianensis Aubl. 505 (9) 357 (5) 186 (3) 93 (3) 1.375*** 1.295*** B
Myrcia racemosa (O. Berg) Kiaersk. 444 (10) 72 (24) 3 (50) 1 (34) 1.479*** 2.504*** C
Calophyllum brasiliense Cambess. 410 (11) 365 (4) 294 (2) 230 (1) 1.237*** 1.279*** E
Calyptranthes concinna DC. 323 (12) 187 (11) 73 (8) 12 (7) 1.979*** 2.502*** B
Miconia cubatanensis Hoehne 267 (13) 26 (44) - - 2.732*** - D
Ocotea aciphylla (Nees) Mez 261 (14) 140 (14) 67 (9) 10 (10) 1.871*** 1.868*** D
Pouteria beaurepairei (Glaz. & Raunk.) Baehni 251 (15) 189 (10) 59 (10) 6 (13) 1.160* 1.282* D
Garcinia gardneriana (Planch. & Triana) Zappi 250 (16) 44 (31) 4 (46) 1 (34) 2.114*** - C
Psidium cattleianum Afzel. ex. Sabine 238 (17) 200 (9) 38 (14) 2 (28) 1.325** 1.376*** E
Manilkara subsericea (Mart.) Dubard 226 (18) 170 (12) 106 (5) 44 (5) 1.863*** 2.139*** D
Byrsonima ligustrifolia A. Juss. 214 (19) 124 (17) 24 (21) - (54) 2.876*** 2.216*** E
Marlierea racemosa (Vell.) Kiaersk. 190 (20) 16 (56) 3 (50) 1 (34) 4.021*** - C
Eugenia sulcata Spring ex Mart. 183 (21) 99 (20) 27 (20) 5 (15) 1.414** 1.319ns E
Ilex theezans Mart. ex Reissek 180 (22) 154 (13) 92 (6) 11 (8) 5.784*** 5.020*** B
Aparisthmium cordatum Baill. 179 (23) 21 (50) - - 3.150*** - B
Balizia pedicellaris (DC.) Barneby & J.W. Grimes 163 (24) 134 (16) 107 (4) 92 (4) 1.125ns 1.178ns A
Maytenus robusta Reissek 154 (25) 30 (39) 3 (49) - 2.488*** - D
Myrcia sp. 144 (26) 43 (32) - - 1.716*** - A
Myrcia ilheosensis Kiaersk. 134 (27) 118 (18) 48 (12) 1 (34) 5.229*** 4.932*** B
Myrcia brasiliensis Kiaersk. 119 (28) 78 (21) 31 (18) 7 (11) 1.349ns 1.193ns A
Heisteria silvianii Schwacke 115 (29) 59 (26) 12 (30) 1 (34) 3.085*** - C
Myrcia multil ora (Lam.) DC. 111 (30) 78 (21) 20 (24) - 4.491*** 5.479*** B
Guatteria australis A. St.-Hil. 104 (31) 5 (72) 2 (56) 1 (34) 1.721** - E
Clusia criuva subsp. parvil ora Vesque 101 (32) 74 (23) 23 (22) 1 (34) 3.092*** 2.843*** C
Ormosia arborea (Vell.) Harms 95 (33) 64 (25) 23 (22) 4 (18) 1.204ns - A
Myrcia bicarinata (O. Berg) D. Legrand 94 (34) 57 (28) 7 (38) 2 (28) 10.015*** - B
Matayba intermedia Radlk. 93 (35) 58 (27) 34 (15) 11 (8) 1.676** - C
Alibertia myrciifolia K. Schum. 92 (36) 4 (73) - - 1.835** - E
Myrcia glabra (O. Berg) D. Legrand 80 (37) 56 (29) 31 (18) 6 (13) 2.216*** - C
Astrocaryum aculeatissimum (Schott) Burret 79 (38) 14 (59) - - 3.656*** - C
Ilex amara (Vell.) Loes 74 (39) 22 (49) - - 1.990** - A
Posoqueria latifolia (Rudge) Schult. 74 (39) 35 (34) 4 (46) 1 (34) 1.706* - E
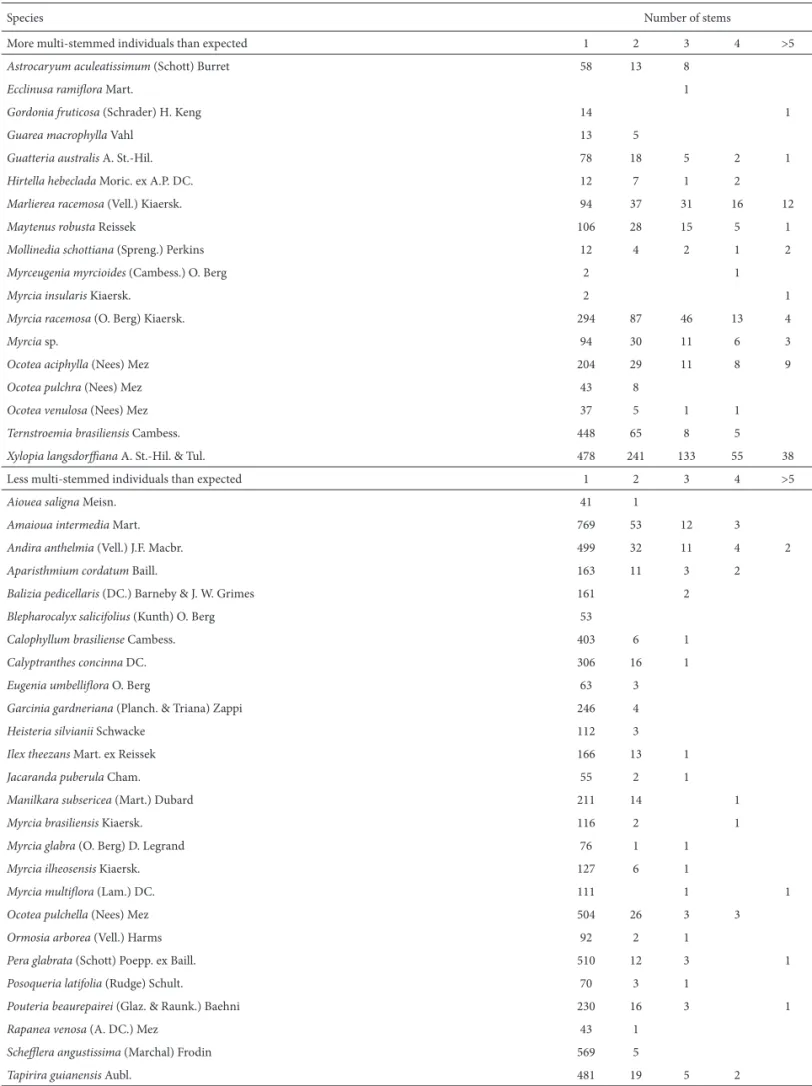
than three stems. Eighteen species had signii cantly more stem ramii cations than expected for the community as a whole, whereas another 26 species had fewer multi-stemmed individuals than expected. Marlierea racemosa had the high-est number of stems (10) and also the highhigh-est proportion of multi-stemmed individuals (50.5%). h e mean abundance of species with signii cantly more stems per individual (185.1 ± 256.7 trees) was marginally greater (p = 0.041) than the abundance of the other species in the plot (95.8 ± 154.3 trees). Among the species with signii cantly fewer multi-stemmed individuals, only Blepharocalyx salicifolius did not have any multistemmed individuals in the plot. Some of the signii -cantly less-ramii ed species had high densities in the plot (n < 500), such as Amaioua intermedia, Schel era angustissima, Andira anthelmia, Ocotea pulchella, and Tapirira guianensis (Tab. 3), besides the monopodial palm Euterpeedulis.
Spatial distribution
Among the 40 most abundant species, dispersion patterns of three (Albizia pedicellaris, Myrcia brasiliensis and Ormosia arborea, pattern A in Tab. 2) were not signii cantly dif erent from random at the 20 m scale. At larger scales, three other species (Schel era angustissima, Myrcia sp. and Ilex amara) were also not clumped. All other species had clumped
pat-terns at one or more distance classes, with Myrcia bicarinata, Myrcia ilheosensis, Myrcia multil ora, Marlierea racemosa and Ilex theezans having the highest aggregation indexes. In the size class ≥ 10 cm dbh, the random distribution was maintained for Albizia pedicellaris and Myrcia brasiliensis. h e species Peraglabrata, clumped in the ≥ 4.8 cm size class, was not dif erent from random in the ≥ 10 cm class. Other species were still clumped but had considerable increases (e.g.Myrcia racemosa and Myrcia multil ora) or decreases (e.g.Byrsonima ligustrifolia and Ilex theezans) in the Morisita index of disper-sion in the size class ≥ 10 cm dbh. Visual inspection of the auto-correlograms and the distribution maps of the most abundant species in the plot (n > 70 individuals) suggested the existence of i ve general distribution patterns (Fig. 3 and Tab. 2). For certain species the individuals were clumped in small patches (e.g.Ilex theezans, pattern B), whereas others were concentrated in larger and specii c areas of the plot (e.g. Ocotea aciphylla and Ternstroemia brasiliensis, patterns C and D). Besides a signii cant auto-correlation at some distances, eight species did not display an evident pattern of distribu-tion (e.g.Calophyllum brasiliensis, pattern E). It is noteworthy that several Myrtaceae species (e.g.Myrcia ilheosensis, Myrcia multil ora and Myrcia bicarinata) were the most strongly clumped species on the plot.
Table 3. Number of individuals per category of number of stems for species with more or less multi-stemmed individuals than expected by chance.
Species Number of stems
More multi -stemmed individuals than expected 1 2 3 4 >5
Astrocaryum aculeatissimum (Schott) Burret 58 13 8
Ecclinusa ramil ora Mart. 1
Gordonia fruticosa (Schrader) H. Keng 14 1
Guarea macrophylla Vahl 13 5
Guatteria australis A. St.-Hil. 78 18 5 2 1
Hirtella hebeclada Moric. ex A.P. DC. 12 7 1 2
Marlierea racemosa (Vell.) Kiaersk. 94 37 31 16 12
Maytenus robusta Reissek 106 28 15 5 1
Mollinedia schottiana(Spreng.) Perkins 12 4 2 1 2
Myrceugenia myrcioides (Cambess.) O. Berg 2 1
Myrcia insularis Kiaersk. 2 1
Myrcia racemosa (O. Berg) Kiaersk. 294 87 46 13 4
Myrcia sp. 94 30 11 6 3
Ocotea aciphylla (Nees) Mez 204 29 11 8 9
Ocotea pulchra (Nees) Mez 43 8
Ocotea venulosa (Nees) Mez 37 5 1 1
Ternstroemia brasiliensis Cambess. 448 65 8 5
Xylopia langsdori ana A. St.-Hil. & Tul. 478 241 133 55 38
Less multi-stemmed individuals than expected 1 2 3 4 >5
Aiouea saligna Meisn. 41 1
Amaioua intermedia Mart. 769 53 12 3
Andira anthelmia (Vell.) J.F. Macbr. 499 32 11 4 2
Aparisthmium cordatum Baill. 163 11 3 2
Balizia pedicellaris (DC.) Barneby & J. W. Grimes 161 2
Blepharocalyx salicifolius (Kunth) O. Berg 53
Calophyllum brasiliense Cambess. 403 6 1
Calyptranthes concinna DC. 306 16 1
Eugenia umbellil ora O. Berg 63 3
Garcinia gardneriana (Planch. & Triana) Zappi 246 4
Heisteria silvianii Schwacke 112 3
Ilex theezans Mart. ex Reissek 166 13 1
Jacaranda puberula Cham. 55 2 1
Manilkara subsericea (Mart.) Dubard 211 14 1
Myrcia brasiliensis Kiaersk. 116 2 1
Myrcia glabra (O. Berg) D. Legrand 76 1 1
Myrcia ilheosensis Kiaersk. 127 6 1
Myrcia multil ora (Lam.) DC. 111 1 1
Ocotea pulchella (Nees) Mez 504 26 3 3
Ormosia arborea (Vell.) Harms 92 2 1
Pera glabrata (Schott) Poepp. ex Baill. 510 12 3 1
Posoqueria latifolia (Rudge) Schult. 70 3 1
Pouteria beaurepairei (Glaz. & Raunk.) Baehni 230 16 3 1
Rapanea venosa (A. DC.) Mez 43 1
Schel era angustissima (Marchal) Frodin 569 5
Discussion
Forest diversity and composition
h e mean richness obtained (79 species ha-1) was lower
than other Brazilian sites of HRF (92 and 128 species ha-1 –
Assis et al. 2004 and Negrelle 2006, respectively; note that both studies used non-co ntiguous plots). Even the studies with much smaller sampling ef orts attained similar or higher species richness (César & Monteiro 1995; Guedes et al. 2006). One possible explanation for this result may lie in the particularities of the PEIC plot substratum, which is young (< 5000 years), very acid, hydromorphic and periodically l ooded (Gomes et al. 2007). Besides the little time that species had for colonization, such features impose important constraints on the establishment of some species (Dumont et al. 1990; Marques et al. 2009). Lower richness was also found when comparing trees ≥ 10 cm dbh of two nearby non-HRF sites (109 – Melo 2000; and ca. 108 species ha-1 – R.A.F. Lima, unpublished data).
h e number of rare species (i.e. singletons) per hectare represented 17% of the plot richness, a value quite similar to other HRFs (14 to 17%, Assis et al. 2004; Negrelle 2006) and lower than that observed values for forests on non-sandy soils (> 23% - Melo 2000, Melo et al. 2000; Guilherme et al. 2004; Losos 2004). In addition, Fisher´s alpha were much smaller than in 10 other tropical forest plots (values from 23 to 181) evaluated by Condit et al. (2004), except by the Mudumalai dry deciduous forest plot (5.9). h erefore, lower richness, rarity and diversity may be characteristic to HRFs relative to forests on richer soils. However, studies with standardized sampling methods and in HRF on soils with dif erent features (age, acidity and/or l ooding regime) are still needed to test this suggestion.
Arecaceae was the most abundant family, a common i nding in many other Atlantic Forests. Exceptions are found where there is illegal palm-heart harvesting (César & Monteiro 1995; Guilherme et al. 2004; Guedes et al. 2006), an activity not seen inside the plot. Myrtaceae also deserves special mention because it harbored twice as many species as the second richest family of the plot. h is pattern was not observed in other CTFS plots (Ashton et al. 2004), or inventories of forests on white-sand soils in South America (Phillips & Miller 2002) and Asia (Proctor et al. 1983; Newbery 1991; Davies & Becker 1996), where Myrtaceae does not exceed 7% of the total tree richness. However, nearby Atlantic Forest types have similar rich-ness per family, with similar or higher Myrtaceae richrich-ness (Melo et al. 2000; Guilherme et al. 2004), suggesting an important ef ect of the geographic region on the general pattern of HRF l oristic composition.
To the best of our knowledge, this is the largest survey ever carried out in a high restinga forest or in any other forest on white-sand soils. Magurran (2004) has suggested that sample sui ciency is attained when the species
ac-cumulation curve crosses the Michaelis-Menten model curve, which was observed around 4.4 ha. h is also can be interpreted as the sampling area needed to coni dently estimate the richness observed in the plot. According to the i rst and second order Jackknife estimators, these areas would be 3.4 and 2 ha, respectively. h e suggestion of Col-well & Coddington (1994) that sample sui ciency is attained when all species have at least two individuals proved to be impracticable because the number of singletons virtually leveled-of at er about 6.5 ha. h is indicates that the presence of naturally rare species (≤1 trees ha-1) in the PEIC plot is
not merely a sampling artifact. h erefore, the 10.24-ha plot was appropriate to describe the composition of the studied HRF, but it was insui cient to characterize the population structure of rare species. Anyhow, these results indicate the use of contiguous plots of at least 6 ha to properly assess species richness and composition of HRF on similar soils.
Forest structure - h e PEIC plot had a density similar to other non-HRF Atlantic Forest sites (Melo 2000, R.A.F. Lima, unpublished data) but with less basal area. In addition, among the other 42 sites consulted (e.g. Philips et al. 1994; Losos et al. 2004), only four had basal areas smaller than the one found here, three of them also being found on white-sand soils. h is result corroborates the connection between forest structure and soil properties suggested by Phillips et al. (1994) and Uhl & Murphy (1981). h e pattern found here was also found by other authors when comparing white-sand forests to other types of tropical forests (Proctor et al. 1983; Davies & Becker 1996; Nebel et al. 2001; Miyamoto et al. 2003) and it is primarily due to the higher proportion of trees < 10 cm dbh and to the smaller proportion of large trees. In the PEIC plot the mean number of trees ≥ 60 cm dbh per hectare was six, whereas in other forest types it varied between eight and 33 trees (mean ± sd: 19 ± 7, Losos et al. 2004). h ree factors are probably impeding species to attain large sizes: low soil fertility, higher light availability at ground level, which may induce individuals to cease vertical growth earlier, and lower potential size of Restinga species (Luizão et al. 2007; Scarano 2009). Future studies monitoring Restinga species growth controlling these three factors would be particularly useful to better understand the mechanisms giving rise to structure in such forests.
abun-dant in forest borders or in younger successional stages of Restinga vegetation of PEIC (Sugiyama 1998). On the other hand, species that had densities more constant among size classes were ot en emergent tree species (e.g.Calophyllum brasilense, Albizia pedicellaris, Manilkara subsericea), which may have regeneration strategies dif erent from other spe-cies, including dif erent mortality and growth rates and/ or seed production strategies (Clark & Clark 1987; Swaine & Hall 1988). So, the successional stage of the community (i.e. age of the substratum) and the regeneration strategies of its species are perhaps the two main determinants of the vertical composition and structure of HRFs.
Multi-stemmed individuals
h e occurrence of multi-stemmed individuals has been noted by dif erent authors as a common feature of Restinga species (Sugiyama 1998;Guedes et al. 2006) and as an important regeneration mechanism in Restinga forests (As-sumpção & Nascimento 2000). Indeed, 74% of the species showed at least one multi-stemmed individual in the PEIC plot, a proportion that was higher than the one found for three other types of tropical forests of southeastern Brazil (ca. 44 – 68% – Lima et al., unpublished data). Nevertheless, the total number of multi-stemmed individuals was quite close to the numbers obtained for these forests, showing no evidence that this phenomenon is more common in the HRF tree individuals. Why there would be more species with multi-stemmed individuals in the HRF than in other comparable types of forest remains unclear.
h ere was evidence that the average abundance of species with more multi-stemmed individuals was larger than other species, suggesting that this trait may inl uence species survival. For instance, a larger number of stems per individual may be benei cial in terms of light interception ei ciency and survival at er physical damage, an advantage which is well documented for species able to survive and resprout at er being damaged (Paciorek et al. 2000; Martini et al. 2008). However, among the ten most abundant species in the plot (n > 400) only three had a greater number of stems than expected. Hence, the ability to produce multi-stemmed trees is not mandatory for successful establishment, at least in terms of density. In addition, resprout-ing at er damage is not the only reason why individuals have more than one stem. Multi-stemmed individuals, for instance, may be linked to a higher availability of light that would stimu-late a premature ramii cation. In any case, our prediction is that species with a high proportion of multi-stemmed individuals would show a smaller number of stems per individual in shaded environments. And if the species also have a lower density of individuals, then we could start to infer about the competitive benei ts of multi-stemmed individuals.
Spatial distribution
Although some studies indicate that species´ dispersion patterns are predominantly aggregated (e.g. Armesto et al. 1986), there is little information on multi-species patterns
of dispersion at dif erent scales. Li et al. (2009) found that 92% of species were aggregated at scales <50 m, and Condit et al. (2000) found similar results for scales <30 m. h ese scales correspond to our patterns B and C, but in the PEIC plot 25% of the most abundant species were aggregated at scales >70 m. Clumped distributions are generally the result of association to discrete habitats, patterns of seed dispersal, interspecii c interactions (e.g. competition, facilitation), and/or expanding or contracting distributions (Hutchings 1997; Valencia et al. 2004; Law et al. 2009; Li et al. 2009), whereas large clumps can be related to environmental het-erogeneity. In the PEIC plot, species distributed over large patches (patterns C and D) suggested species associated with habitat, probably soil. Species with distributions practi-cally opposite in respect to particular places were relatively common and intriguing (e.g.Ocotea pulchella and Ternstro-emia brasiliensis). Such places may indicate (un)favorable abiotic conditions where more stress-tolerants do well, or where more competitive species (e.g. ground bromeliads) may exclude others. Or it may indicate an association with resource availability (nutrients or light). It is noteworthy that similar distribution patterns can be generated from dif erent mechanisms (Harms et al. 2001).
In forests with restrictive soil conditions, such as the HRF, patterns of aggregation are particularly interesting. Higher aggregation in the larger size classes, for instance, would in-dicate a greater degree of habitat association (Condit et al. 2000). Examples of this result in the PEIC plot are Myrcia racemosa and Myrcia multil ora. h e opposite could indicate dispersal-limited species, such as Byrsonima ligustrifolia and Ilex theezans. Although the number of individuals in the larger size classes was limited to properly assess such processes, this approach should be extended to a larger number of species, perhaps including individuals < 4.8 cm dbh. Condit et al. (2000) suggested that changes in the patterns of aggregation among size classes are small (although the proportion of species with signii cant values of aggregation presented by these authors was considerably lower for dbh ≥ 10 cm). Examples from other types of forests also suggest that the abiotic conditions are not able to explain the distribution of the majority of forest species (Harms et al. 2001; Valencia et al. 2004). Nevertheless, in the PEIC plot we believe that there is a higher degree of habitat association, particularly regarding the type of soil, l ooding regime, and canopy gap distribution that combined generate very distinct habitats for tree establishment.
Concluding remarks
generate forests whose characteristics are shorter stature, lower species diversity, and roots more concentrated in the superi cial soil horizons (Davies & Becker 1996; Mi-yamoto et al. 2003; 2007). For these reasons, we recognize the Atlantic HRF as a type of white-sand forest. Although forest structure and probably functioning are similar among white-sand forests, species composition seems to be linked to local biogeographical issues. h is is in accordance with the Walter´s biome classii cation (Walter 1986), in which the HRF should be classii ed as a Psammobiome I, i.e. a pedo-biome within the Tropical Rain Forest Zonopedo-biome, which is functionally and structurally determined by the sandy soil condition. Finally, we do believe that this similarity may be extended to other Neotropical forests over white-sand soils, such as the Brazilian muçunungas (Simonelli et al. 2008) or the ‘river’ HRF of Peru (Nebel et al. 2001).
Acknowledgements
We thank the project “Diversidade, dinâmica e con-servação em Florestas do Estado de São Paulo: 40 ha de parcelas permanentes” (Process no: 99/09635–0, Fundação
de Amparo à Pesquisa do Estado de São Paulo - FAPESP) and Petrobrás (Process no: 0050.0023163.06.4) for i nancial
support. h e i rst author was supported by a grant from the “Coordenação de Aperfeiçoamento de Pessoal de Nível Su-perior” (CAPES - Demanda Social program). We also thank the PEIC administration (Instituto Florestal – SP) and the help of taxonomic experts, namely Evelyn Lucas, Fiorella Mazine, Marcos Sobral, Inês Cordeiro, João Baitello, Luís Bernacci, Milton Groppo Jr., Reinaldo Monteiro and Sérgio Romaniuc. Finally, we thank Jerome Chave, Stuart Davies, Kyle Harms, Egbert Leigh Jr., and Flaviana Maluf for their valuable comments.
References
Anderson, A.B. 1981. White-sand vegetation of Brazilian Amazonia. Biotropica 13: 199-210.
APG (Angiosperm Phylogeny Group) 2003. An update of the angiosperm phylogeny group classii cation for the orders and families of l owering plants: APG II. Botanical Journal of the Linnean Society 141: 399-436 Armesto, J.J.; Mitchell, J.D. & Villagran, C. 1986. A comparison of spatial patterns
of trees in some Tropical and Temperate Forests. Biotropica 18: 1-11. Ashton, P.S. 2004. Soils in the tropics. Pp. 57-68. In: Losos, E.C. & Leigh
Jr. E.G. (Eds). Tropical forest diversity and dynamism: Findings from a large-scale plot network. Chicago, University of Chicago Press. Ashton, P.S. & CTFS Work Group. 2004. Floristics and vegetation of the
forest dynamics plots. Pp. 90-102. In: Losos, E.C. & Leigh Jr. E.G. (Eds). Tropical forest diversity and dynamism: Findings from a large-scale plot network. Chicago, University of Chicago Press.
Assis, A.M.; Pereira, O.J. & h omaz, L.D. 2004. Fitossociologia de uma l oresta de restinga no Parque Estadual Paulo César Vinha, Setiba, município de Guarapari (ES). Revista Brasileira de Botânica 27: 349-361.
Assumpção, J. & Nascimento, M.T. 2000. Estrutura e composição l orística de quatro formações vegetais de Restinga no Complexo Lagunar Grussaí/Iquipari, São João da Barra, RJ, Brasil. Acta Botanica Brasilica 14: 301-315.
César, O. & Monteiro, R. 1995. Florística e i tossociologia de uma Floresta de Restinga em Picinguaba (Parque Estadual da Serra do Mar), município de Ubatuba – SP. Naturalia 20: 89-105.
Clark, D.B. & Clark, D.A. 1987. Population ecology and microhabitat distribution of Dipteryx panamensis, a Neotropical rain forest emergent tree. Biotropica 19: 236-244.
Colwell, R.K. 2006. EstimateS: statistical estimation of species richness and shared species from samples. version 8. http://purl.oclc.org/estimates. (Accessed in 25/01/06)
Colwell, R.K. & Coddington, J.A. 1994. Estimating terrestrial biodiversity through extrapolation. Philosophical Transactions of the Royal Society B 345: 101-11Condit, R. 1998. Tropical forest census plots: methods and results from Barro Colorado Island, Panama and a comparison with other plots. Berlin, Springer-Verlag.
Condit, R.; Ashton, P.S. & Baker, P. 2000. Spatial patterns in the distribution of tropical tree species. Science 288: 1414-1418.
Condit, R. & CTFS Work Group. 2004. Species-area relationships and diversity measures in forest dynamics plots. Pp. 79-89. In: Losos, E.C. & Leigh Jr. E.G. (Eds). Tropical forest diversity and dynamism: Findings from a large-scale plot network. Chicago, University of Chicago Press.
DAEE/SP. 2007. Banco de Dados Pluviométricos do Estado de São Paulo. Disponível em: <http://www.daee.sp.gov.br/hidrometeorologia/ bancodados.htm.>. (Acesso em: 03/02/10).
Davies, S.J. & Becker, P. 1996. Floristic composition and stand structure of mixed dipterocarp and heath forests in Brunei Darussalam. Journal of Tropical Forest Science 8: 542-569.
Dumont, J.F.; Lamotte, S. & Kahn, F. 1990. Wetland and upland forest ecosystems in Peruvian Amazonia: plant species diversity in the light of some geological and botanical evidence. Forest Ecology and Management 33/34: 125-139.
Fine, P.V.A.; Mesones, I. & Coley, P.D. 2009. Herbivores promote habitat specialization by trees in Amazonian forests. Science 305: 663-665. Gomes, F.H.; Vidal-Torrado, P.; Macías, F.; Gherardi, B. & Perez, X.L.O.
2007. Solos sob vegetação de restinga na Ilha do Cardoso (SP). I - Caracterização e classii cação. Revista Brasileira de Ciência do Solo 31: 1563-1580.
Guedes, D.; Barbosa, L.M. & Martins, S.E. 2006. Composição l orística e estrutura i tossociológica de dois fragmentos de l oresta de restinga no Município de Bertioga, SP, Brasil. Acta Botanica Brasilica 20: 299-311. Guilherme, F.A.G.; Morellato, L.P. & Assis, M.A. 2004. Horizontal and
vertical tree community structure in a lowland Atlantic Rain Forest, Southeastern Brazil. Revista Brasileira de Botânica 27: 725-737. Harms, K.E.; Condit, R.; Hubbell, S.P. & Foster, R.B. 2001. Habitat
associations of trees and shrubs in a 50-ha Neotropical forest plot. Journal of Ecology 89: 947-959.
Holdridge, L.R.; Grenke, W.C.; Hatheway, W.H.; Liang, T. & Tosi, J.A. Jr. 1971. Forest environments in tropical life zones: a pilot study. Oxford. Pergamon Press.
Hutchings, M.J. 1997. h e structure of plant populations. Pp. 325-358. In: Crawley, M.J. (Ed.). Plant ecology. Oxford, Blackwell Scientii c. Kenfack, D.; h omas, D.W.; Chuyong, G. & Condit, R. 2007. Rarity and
abundance in a diverse African forest. Biodiversity and Conservation 16: 2045-2074.
Köppen, W.P. 1948. Climatología: con un estudio de los climas de la tierra. México DC, Fondo de Cultura Económica.
Krebs, C.J. 1999. Ecological methodology. 2nd ed. New York, Addison-Wesley Longman.
Law, R.; Illian, J.; Burslem, D.F.R.P.; Gratzer, G.; Gunatilleke, C.V.S. & Gunatilleke, I.A.U.N. 2009. Ecological information from spatial patterns of plants: insights from point process theory. Journal of Ecology 97: 616-628.
Legendre, P. & Legendre, L. 1998. Numerical ecology. 2nd ed. Amsterdam, Elsevier Science BV.
Legendre, P. & Fortin, M.J. 1989. Spatial pattern and ecological analysis. Vegetatio 80: 107-138.
Losos, E.C. 2004. Habitat specialization and species rarity. Pp. 103-106. In: Losos, E.C. & Leigh Jr. E.G. (Eds). Tropical forest diversity and dynamism: Findings from a large-scale plot network. Chicago, University of Chicago Press.
Losos, E.C. & CTFS Work Group. 2004. h e structure of tropical forests. Pp. 69-78. In: Losos, E.C. & Leigh Jr. E.G. (Eds). Tropical forest diversity and dynamism: Findings from a large-scale plot network. Chicago, University of Chicago Press.
Luizão, F.J.; Luizão, R.C.C. & Proctor, J. 2007. Soil acidity and nutrient dei ciency in central Amazonian heath forest soils. Plant Ecology 192: 209-224.
Magurran, A.E. 2004. Measuring biological diversity. Oxford, Blackwell Publishing.
Martini, A.M.Z.; Lima, R.A.F.; Franco, G.A.D.C. & Rodrigues, R.R. 2008. h e need for full inventories of tree modes of disturbance to improve forest dynamics comprehension: An example from a semideciduous forest in Brazil. Forest Ecology and Management 255: 1479-1488. Manly, B.F.J. 2006. Randomization, bootstrap and Monte Carlo methods
in biology. 3rd edn. London. Chapman and Hall/ CRC Press. Marques, M.C.M.; Burslem, D.F.R.P.; Britez, R.M. & Silva, S.M. 2009.
Dynamics and diversity of l ooded and unl ooded forests in a Brazilian Atlantic rain forest: a 16-year study. Plant Ecology & Diversity 2: 57-64.
Melo, M.M.R.F. 2000. Demografia de árvores em Floresta Pluvial Tropical Atlântica, Ilha do Cardoso, SP, Brasil. PhD thesis. Universidade de São Paulo. São Paulo.
Melo, M.M.R.F.; Oliveira, R.J.; Rossi, L.; Mamede, M.C.H. & Cordeiro, I.2000. Estrutura de um trecho de Floresta Atlântica de Planície na Estação Ecológica Juréia-Itatins, Iguape, SP, Brasil. Hoehnea 27: 299-322.
Miyamoto, K.; Suzuki, E.; Kohyama, T.; Seino, T.; Mirmanto, E. & Simbolon, H. 2003. Habitat dif erentiation among tree species with small-scale variation of humus depth and topography in a tropical heath forest of Central Kalimantan, Indonesia. Journal of Tropical Ecology 19: 43-54.
Miyamoto, K.; Rahajoe, J.S.; Kohyama, T. & Mirmanto, E. 2007. Forest structure and primary productivity in a Bornean heath forest. Biotropica 39: 35-42.
Mueller-Dombois, D. & Ellenberg, H. 1974. Aims and methods of vegetation ecology. New York, John Wiley and Sons.
Nebel, G.; Kvist, L.P.; Vanclay, J.K.; Christensen, H.; Freitas, L. & Ruíz, J. 2001. Structure and l oristic composition of l ood plain forests in the Peruvian Amazon I. Overstory. Forest Ecology and Management 150: 27-57.
Negrelle, R.R.B. 2006. Composição l orística e estrutura vertical de um trecho de Floresta Ombrói la Densa de Planície Quaternária. Hoehnea 33: 261-289.
Newbery, D.M.C. 1991. Floristic variation within kerangas (heath) forest: re-evaluation of data from Sarawak and Brunei. Vegetatio 96: 43-86.
Paciorek, C.J.; Condit, R.; Hubbell, S.P. & Foster, R.B. 2000. The demographics of resprouting in tree and shrub species of a moist tropical forest. Journal of Ecology 88: 765-777.
Phillips, O. & Miller, J.S. 2002. Global patterns of plant diversity: Alwyn H. Gentry’s forest transect data set. St. Louis, Missouri Botanical Garden Press.
Phillips, O.L.; Hall, P.; Gentry, A.H.; Sawyer, S.A. & Vazquez, R. 1994. Dynamics and species richness of tropical rain forests. Proceedings of the National Academy of Science 91: 2805-2809.
Proctor, J.; Anderson, J.M.; Chai, P. & Vallack, H.W. 1983. Ecological studies in four contrasting lowland rain forests in Gunung Mulu National Park, Sarawak: I. Forest environment, structure and l oristics. Journal of Ecology 71: 237-260.
R Development Core Team (2008) R: A language and environment for statistical computing. http://www.R-project.org (Accessed in 12/11/2008).
Ribeiro, M.C.; Metzger, J.P.; Martensen, A.C.; Ponzoni, F.J. & Hirota, M.M. 2009. h e Brazilian Atlantic Forest: How much is let , and how is the remaining forest distributed? Implications for conservation. Biological Conservation 142: 1141-1153.
Rocha, C.F.D.; Bergallo, H.G.; van Sluys, M.; Alves, M.A.S. & Jamel, C.E. 2007. h e remnants of restinga habitats in the Brazilian Atlantic Forest of Rio de Janeiro state, Brazil: habitat loss and risk of disappearance. Brazilian Journal of Biology 67: 263-273.
Scarano, F.R. 2002. Structure, function and l oristic relationships of plant communities in stressful habitats marginal to the Brazilian Atlantic Rainforest. Annals of Botany 90: 517-524.
Scarano, F.R. 2009. Plant communities at the periphery of the Atlantic rain forest: Rare-species bias and its risks for conservation. Biological Conservation 142: 1201-1208.
Simonelli, M.; Souza, A.L.; Peixoto, A.L. & Silva, A.F. 2008. Floristic composition and structure of the tree component of a muçununga forest in the Linhares Forest Reserve, Espírito Santo, Brazil. Memoirs of the New York Botanical Garden 100: 351-370.
Sugiyama, M. 1998. Estudo de l orestas da restinga da Ilha do Cardoso, Cananéia, São Paulo, Brasil. Boletim do Instituto de Botânica 11: 119-159.
Swaine, M.D. & Hall, J.B. 1988. h e mosaic theory of forest regeneration and the determination of forest composition in Ghana. Journal of Tropical Ecology 4: 253-269.
Uhl, C. & Murphy, P.G. 1981. Composition, structure, and regeneration of a Tierra Firme forest in the Amazon basin of Venezuela. Tropical Ecology 22: 219-237.
Valencia, R.; Foster, R.B.; Villa, G.; Condit, R.; Svenning, J.-C.;Hernández, C.; Romoleroux, K.; Losos, E.; Magård, E. & Balslev, H. 2004. Tree species distributions and local habitat variation in the Amazon: large forest plot in eastern Ecuador. Journal of Ecology 92: 214-229. Walter, H. 1986. Vegetação e zonas climáticas: tratado de ecologia global.
São Paulo, EPU.