Optimality of Fiscal Policy in Romania
in Terms of Laffer Curve
Adina TRANDAFIR “Spiru Haret” University, Bucharest [email protected]
Petre BREZEANU Bucharest Academy of Economic Studies [email protected]
Abstract. Optimality of fiscal policy is an issue widely debated in the literature from multiple perspectives. One way to address this problem is with the Laffer curve, causing the correlation between tax burden and tax revenue. This paper addresses the correlation with Laffer curve for income tax made during the period 2000-2010, highlighting the fact that the Romanian economy lies in the inadmissible slope of the curve, both in analyzing the entire period, and in the part of each year. Moreover, this result reveals the existence of unnecessary redistribution of income in the Romanian economy during the period under review.
Keywords: fiscal policy; Laffer curve; tax burden.
JEL Codes: E62, E63. REL Codes: 8K, 8M.
1. Introduction
Taxation is one of the areas that suffered most changes in the last two decades in our country. Unfortunately, these changes were either too thick or too slow or too sudden, so that the Romanian fiscal environment is perceived by all taxpayers as a factor of instability in the Romanian economy.
It is true that there has been some progress in legislative matters, and regulatory harmonization with the EU or the flat, but insufficient administrative capacity makes the Romanian tax system to represent a weakness of the national economy. Providing a unified framework (Fiscal Code) has been overshadowed by the state's inability to respect fundamental principles assumed, and the imposition of efficiency and certainty, stability and predictability, essential principles on which a tax system must satisfy a viable economy.
Payment of taxes and the tax burden is sustained for the taxpayers to the state budget of Romania, most often suffocating. The taxpayer agrees to pay the tax and is subject to this burden willingly, but at a time when taxes exceed certain limits of endurance, occur phenomena that without serious detrimental state capacity to collect this revenue. The desire to secure taxpayers' income before increased tax pressure without additional effort contribute to the development of parallel economy, which gradually replaces the real economy activity, giving way to the emergence of parallel economy (economy). The consequences of this are fewer taxpayers and material reduction in the tax base and ineffective macroeconomic policies in the field.
This article addresses to the optimality issue of Romanian fiscal policy during the period 2000-2010, from the perspective of Laffer curve, causing the slope of the the mentioned period in area roumanian fiscal policy.
In the second section, the article presents existing research literature and theories in the Laffer curve. Section Three examines the Laffer curve slope for Romania on the basis of general consolidated budget, both for the entire period, and each individual year.
2. The current state of knowledge
In 1776, A. Smith has established that high tax rates will damage the tax base. This concept was embodied by the American economist Arthur Laffer(1) who built a curve linking the tax rate and tax base.
The arithmetic effect refers to the fact that when tax rates decrease, the tax revenues (expressed per unit of taxable income) will also decrease. Otherwise, when the tax rate increases, the effect makes arithmetic will cause tax revenue collected per unit of taxable income to increase.
The economic effect, however, lead to a positive impact of lower tax rates on labor and production and therefore also on the tax base. In contrast, increasing the tax rate will have an economic effect, conversely, the penalty for participating in taxable activities. Therefore, the arithmetic effect will always act to reverse the economic effect. When combining the two types of effects, the consequences of tax rate change on tax revenues are not so obvious.
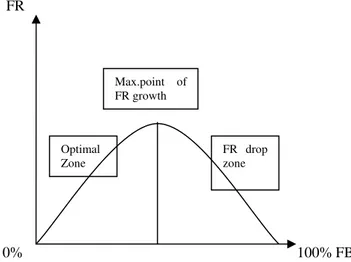
The theoretical model of Laffer curve is presented in the figure below:
FR
0% 100% FB
Source: Arthur B. Laffer (2004), "The Laffer Curve: Past, Present, and Future", The Heritage Foundation.
Figure 1.The Laffer curve
In public finance literature one meets classical reversed form (U) of the Laffer curve(2). However, Malcolmson (1986, pp. 263-279) argues that there are potential discontinuities at high tax rates.
Feige, Edgar L., and Robert T. McGee (1982, pp. 499-519) say that studies suggest that the phenomenon observed economy has important implications both for macroeconomic policy and public finances. In their paper the attention is focused on the implications of public finances by developing a simple macromodel that is possible to obtain a Laffer curve. This model shows that the shape and position of the Laffer curve for Sweden depend on the power supply, the progressivity of the tax system and the size of the observed economy. Also, they
Optimal Zone
Max.point of FR growth
simulated Laffer curve for the UK and answered the question regarding the costs of establishing rates for obtaining the maximum revenue.
In dynamic, the Laffer curve was studied by Jonas Agell and Mats Persson (2000), and Jesús Alfonso Novales and Ruiz (2002, pp. 181-206). Jonas Agell and Mats Persson (2000) analyze the government budget balance in a simple endogenous growth model, by conducting an empirical study of transfer-adjusted tax rates in OECD countries to see which country has the greatest potential for improvement tax. Jesús Alfonso Novales and Ruiz (2002) analyze the potential welfare gains that can come from substituting debt for taxes in the management deficit. They find that tax cuts on labor and capital income have a positive effect on growth rate of the economy, thus gradually increasing the long term tax base.
In quantitative terms, the Laffer curve was analyzed by Trabandt Mathias and Harald Uhlig (2006, pp. 1-69) using a simple model of the neoclassical growth, calibrated for the US, and EU-15 economy. They showed that in the US and the EU-15 labor and capital are located on the left side of Laffer curve, but the EU-15 economy is much closer to the slopes than the United States prohibited. They also found that the slope of the Laffer curve for the EU-15 economy is much flatter than in the US, citing a much higher degree of distortions in the EU-15.
3. The Laffer curve and the optimality of Romanian fiscal policy during the 2000-2010 period
In what follows we will try to determine the shape of the Laffer curve general government budget tax revenues of we Romania. Analyzing the effects of increase or decrease the gross tax burden, one can reveal which part of the curve lies the Romanian economy: the permissible or the prohibited area.
Variables taken into account in determining the Laffer curve in Romania during 2000-2010, are:
Realized tax revenues at current prices;
GDP in current prices;
GDP deflator;
Real tax revenue, converted by GDP deflator;
Real GDP;
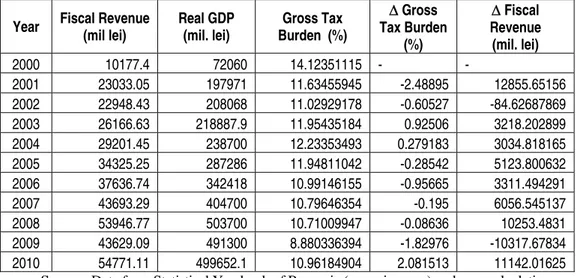
Table 1
Laffer curve shape variables for the consolidated general government fiscal revenue in Romania for the period 2000-2010
Year Fiscal Revenue (mil lei)
Real GDP (mil. lei)
Gross Tax Burden (%)
Δ Gross Tax Burden
(%)
Δ Fiscal Revenue
(mil. lei)
2000 10177.4 72060 14.12351115 - -
2001 23033.05 197971 11.63455945 -2.48895 12855.65156 2002 22948.43 208068 11.02929178 -0.60527 -84.62687869 2003 26166.63 218887.9 11.95435184 0.92506 3218.202899 2004 29201.45 238700 12.23353493 0.279183 3034.818165 2005 34325.25 287286 11.94811042 -0.28542 5123.800632 2006 37636.74 342418 10.99146155 -0.95665 3311.494291
2007 43693.29 404700 10.79646354 -0.195 6056.545137
2008 53946.77 503700 10.71009947 -0.08636 10253.4831
2009 43629.09 491300 8.880336394 -1.82976 -10317.67834 2010 54771.11 499652.1 10.96184904 2.081513 11142.01625
Source: Data from Statistical Yearbook of Romania (www.insse.ro) and own calculations.
Based on data from the previous table we built the Laffer curve for realized tax revenue.
Source: own processing of data taken from Statistical Yearbook of Romania (www.insse.ro).
Figure 2.Income tax Laffer curve for Romania during 2000-2010
As shown in the figure above, the Laffer curve constructed on the basis of gross tax burden and real tax revenue during 2000-2010 stands the Romanian economy on profibited slope of the curve, in the prohibited area. During the period under review, in 2010 reaches the peak of the realized tax revenue from a 10.96% gross tax burden.
0 10000 20000 30000 40000 50000 60000
0 5 10 15
Analyzing the problem, we noticed that the slope varies from year to year. Thus, the following will be displayed in real tax revenue changes, in correlation with changes in gross tax burden every year to see if, during the period under review, income tax burden was real or not above the optimal level and what is this optimal level. 2000-2001 2000 2001 0 5000 10000 15000 20000 25000
0 5 10 15
Gross Tax Burden (%)
Fiscal Re ven ue (mil. lei) 2002-2003 2002 2003 22000 23000 24000 25000 26000 27000
10.5 11 11.5 12 12.5
Gross Tax Burden (%)
(mil. lei) Fiscal Re ven ue 2003-2004 2003 2004 26000 27000 28000 29000 30000
11.9 12 12.1 12.2 12.3
Gross Tax Burden (%)
(mil. lei) Fiscal Re ven ue 2004-2005 2004 2005 28000 29000 30000 31000 32000 33000 34000 35000
11.9 12 12.1 12.2 12.3
Gross Tax Burden (%)
(mil. lei) Fiscal Reve nu e 2005-2006 2005 2006 34000 35000 36000 37000 38000
10.5 11 11.5 12
Gross Tax Burden (%)
(mil. lei) Fiscal Re ven ue 2001-2002 2001 2002 22940 22960 22980 23000 23020 23040
10.8 11 11.2 11.4 11.6 11.8
Gross Tax Burden (%) (mil.lei)
Fiscal Reve
nu
Source: own processing of data taken from Statistical Yearbook of Romania (www.insse.ro).
Figure 3.Annual Laffer Curve for tax revenues of general government budget of Romania, 2000-2010
Looking at the graphs we can see that the gross tax burden generated by the realized tax revenue was in prohibited area in years: 2000, 2001, 2004, 2005, 2006, 2007, 2008 and 2009. To gain more detailed, analysis should be broken down components of tax revenue.
4. Conclusions
Increase or decrease the tax burden on a given period is linked with confidence economic and social role of the state, its intervention in order to ensure coverage of the source of public spending. The debate generated by excessive state intervention in the economy have generated a new economic thinking, thinking that we observe and the American economist Arthur Laffer, who used as a market analysis of the US economy, through a curve showing the relationship between rate pressure tax and tax revenue stream.
In the previous section we built Laffer curve for the Romanian economy on tax revenues incurred during the period 2000-2010. The analysis results show that Laffer curve slope for the entire period places the Romanian economy in the inadmissible or prohibited area, an area where an increasingly important part of the income factor is taken over by the state. Therefore, subjects in economics restrict their taxable activities and, consequently, reduce
2006-2007 2006 2007 36000 38000 40000 42000 44000
10.7 10.8 10.9 11 11.1
Gross Tax Burden (%)
Fiscal Re ven ue (mil. lei) 2007-2008 2007 2008 0 20000 40000 60000
10.7 10.7210.74 10.7610.7810.810.82
Gross Tax Burden (%)
Fiscal Re ven ue (mil. lei) 2008-2009 2008 2009 0 20000 40000 60000
0 5 10 15
Gross Tax Burden (%)
Fiscal Re
ven
ue
(mil. lei) 2009-2010
2009 2010 0 20000 40000 60000
0 5 10 15
Gross Tax Burden (%)
Fiscal Re
ven
ue
the tax basis. Subjects in the economy reject public utilities, private utilities preferred. This result reflects the economic realities of Romanian. Analyzing the optimality of Romanian tax policy, during the time, in 2010 reaches the peak of the real tax revenue realized from a 10.96% gross tax burden.
Laffer curve slope varies from year to year, which led to its construction each year in part obtaining the following results: in 2000, 2001, 2004, 2005, 2006, 2007, 2008 and 2009, the Laffer curve slope was located in prohibited (inadmissible) area. The slope of the Laffer curve for the general government budget of Romania in the prohibited area instability finds its explanation in the fiscal area, the weak administrative capacity of the Romanian authorities and the fact that, most times, this area was used as a political tool.
As the pressure increases there is a tax decrease of production and, hence, tax revenue. The fiscal pressure area determined inadmissible unnecessary redistribution of income smoothing through public coercion and deterrence subjects of economic activities, individual initiatives and risk taking. To obtain more accurate results, the analysis in this article could use components of realized tax revenue, as provided in the general government budget of Romania.
Notes
(1)
The "Laffer curve" concept was introduced by Jude Wanniski, who in 1974 published an article in The Public Interest, entitled "Taxes, Revenues, and the "Laffer Curve".
(1)
See Fullerton, D., (1982), "On the possibility of year inverse relationship between tax rates and government revenues", Journal of Public Economics, 19, pp. 3-22.
References
Agell, J., Mats, P., „On the Analystics of the Dynamic Laffer Curve”, Working paper, 2000, pp. 1-26 Feige, E.L., McGee, R.T., „The Unobserved Economy and the UK 3. Laffer Curve”, Journal of
Economics, 85 (4), 1983, pp. 499-519
Fullerton, D., „On the possibility of an inverse relationship between tax rates and government revenues”, Journal of Public Economics, 19, 1982, pp. 3-22
Laffer, A.B., „The Laffer Curve: Past, Present, and Future”, The Heritage Foundation, 1765, 2004 Malcolmson, J.M., „Some analytics of the Laffer curve”, Journal of Public Economics, 29,
1986, pp. 263-279
Novales, A., Ruiz, J., „Dynamic Laffer curves”, Journal of Economic Dynamics & Control, 27, 2002, pp. 181-206
Smith, A. (1776). An Inquiry into the Nature and Causes of the Wealth of Nations, ed. Edwin Cannan, London: Methuen & Co., Ltd.
Statistical Yearbook of Romania, www.insse.ro
Trabandt, M., Uhlig, H., „How Far Are We From The Slippery Slope? The Laffer Curve”, SFB 649 Discussion Paper, 2006-023 April 3, 2006, pp. 1-69