www.hydrol-earth-syst-sci.net/14/2507/2010/ doi:10.5194/hess-14-2507-2010
© Author(s) 2010. CC Attribution 3.0 License.
Earth System
Sciences
Establishment of a catchment monitoring network through
a participatory approach in a rural community in South Africa
V. M. Kongo1,*, J. R. Kosgei1,**, G. P. W. Jewitt1, and S. A. Lorentz1
1School of Bioresources Engineering and Environmental Hydrology University of KwaZulu-Natal, PB X01, Scottville,
Pietermaritzburg, South Africa
*now at: Stockholm Environment Institute-Africa Centre, Institute of Resource Assessment, University of Dar es Salaam,
P.O. Box 35097, Dar es Salaam, Tanzania
**now at: Masinde Muliro University of Science & Technology, Department of Civil & Structural Engineering,
P.O. Box 190-50100, Kakamega, Kenya
Received: 10 September 2007 – Published in Hydrol. Earth Syst. Sci. Discuss.: 16 October 2007 Revised: 10 November 2010 – Accepted: 22 November 2010 – Published: 13 December 2010
Abstract.The establishment of a catchment monitoring
net-work is a process, from the inception of the idea to its imple-mentation, the latter being the construction of relevant gaug-ing structures and installation of the various instruments. It is useful that the local communities and other stakeholders are involved and participate in such a process, as was high-lighted during the establishment of the hydrological monitor-ing network in the Potshini catchment in Bergville District in the KwaZulu-Natal Province, South Africa. The paper highlights the participatory establishment of a hydrological monitoring network in a small rural inhabited catchment, in line with the overall objective of the Smallholder System In-novations (SSI) research programme, to monitor hydrolog-ical processes at both field and catchment scale for water resources management research purposes. The engagement and participation of the Potshini community precipitated a learning opportunity for both the researchers and the local community on (i) the understanding of hydrological pro-cesses inherent in the catchment (ii) appreciating the inherent dynamics in establishing a catchment monitoring network in the midst of a community (iii) paradigm shift on how to en-gage different stakeholders at different levels of participa-tion. The participatory engagement in the monitoring process led to appreciation and uptake of some of the research results by the Potshini community and ensured continued support from all stakeholders. This paper is of the view that the par-ticipation of the local community and other stakeholders in catchment monitoring and instilling a sense of ownership and
Correspondence to:V. M. Kongo (vickongo@gmail.com)
management of natural resources to the local communities needs to be encouraged at all times. Success stories in water resources management by local communities can be realized if such a process is integrated with other development plans in the catchment at all forums, with due recognition of the social dynamics of the communities living in the catchment.
1 Introduction
Sound decision making for water resources and environmen-tal management has to be based on good knowledge and fac-tual information regarding the dominant hydrological pro-cesses, together with bio-physical characteristics of a catch-ment and in combination with socio-economic aspects. Such information, especially on hydrological processes, can only be obtained through establishing networks that are capable of monitoring hydrological processes at different temporal and spatial scales. Such a process is normally driven by a motive to meet certain research objectives (e.g. Wigmosta and Burges, 1997; Gilvear and Bradley, 2000; Hodgson et al., 2002; Ireson et al., 2006), but with consideration of the cost implications with regard to construction and acquisition of the various instruments and their maintenance. However, research catchments are typically established in uninhabited areas. In fact, people are usually excluded from such catch-ments as they add uncontrollable variables to the experiment as well as present the risk of theft and vandalism.
2508 V. M. Kongo et al.: Establishment of a catchment monitoring network through a participatory approach instruments while engaging relevant stakeholders, but that
this forms only the first few steps of an ongoing engagement with the community. This perspective has become increas-ingly important in the context of initiatives to ensure food se-curity at the household and smallholder level where detailed understanding of water dynamics is imperative, but largely unknown. From the farmer’s perspective, to decide that a water use innovation is worthy of investment, they also need a realistic understanding of its risks and benefits, including factors such as time and monetary input requirements, but very importantly, potential effects on yield and soil and wa-ter conservation. This reduces the risk of wasted expenditure on an innovation that is not suited to their specific situation, which could lead to reluctance towards trying other poten-tially beneficial innovations (Sturdy et al., 2008). In order to realize these benefits, the involvement of the smallholder farmers from the onset is imperative.
There are few case studies in the available literature on the establishment of detailed catchment monitoring networks through a participatory approach involving the local commu-nity and other stakeholders. Moriarty (2000) reported the es-tablishment of the Romwe catchment in Zimbabwe through the involvement of the local community, but the participa-tory approach that was applied in due process was not high-lighted. A survey study by Loreta et al. (2006) indicated the desire by local communities and other stakeholders to be in-volved in water quality monitoring and surveillance in the Mzingwane catchment in Zimbabwe, even though they were not aware of the existence of such a monitoring programme in their locality.
It is perceived that the participatory approach in catchment monitoring has long term benefits, including the opportunity for the relevant stakeholders, notably the local community, to gain insight into the hydrological regime of their local-ity. This in turn provides a better basis for decision making for catchment based activities and understanding the impact of anthropogenic activities on water resources in the catch-ment, thus contributing to environmental education. The lat-ter is key to effective community involvement in participa-tory research and development of research products that are relevant and acceptable to the community (Marshke and Sin-clair, 2009). Thus, a participatory approach requires a con-stant effort to initiate a learning process, through which the local community is able to appreciate and recognize the im-portance of catchment monitoring, notwithstanding the will-ingness of the community to participate in the monitoring exercise.
This paper highlights the participatory establishment and monitoring of a hydrological network in the midst of a rural community, the Potshini community, in the upper Thukela river basin in South Africa. The catchment monitoring network was established in line with the overall objective of the Smallholder System Innovations (SSI) in integrated watershed management research programme (Rockstr¨om et al., 2004) of addressing the challenges of increasing food
production and improving rural livelihoods while safeguard-ing critical ecosystem functions and services. The approach used to establish the monitoring network supports the con-tention of Wagener et al. (2010) that a key element of a “paradigm shift” in our approach to understanding the hy-drological functioning of coupled human-nature systems is to move from a perspective of humans being intrinsic, rather than external to the hydrologic system and to research catch-ments which are not pristine, but rather reflect the places where humans live and interact. Thus, the paper provides a good case study for considering the many issues and chal-lenges (social, scientific and engineering) that need to be ad-dressed in the process of establishing the monitoring network in a populated rural catchment in a developing region. The paper shares experience which is often not documented in literature, but of great value in water resources management, especially in developing countries.
1.1 The study area
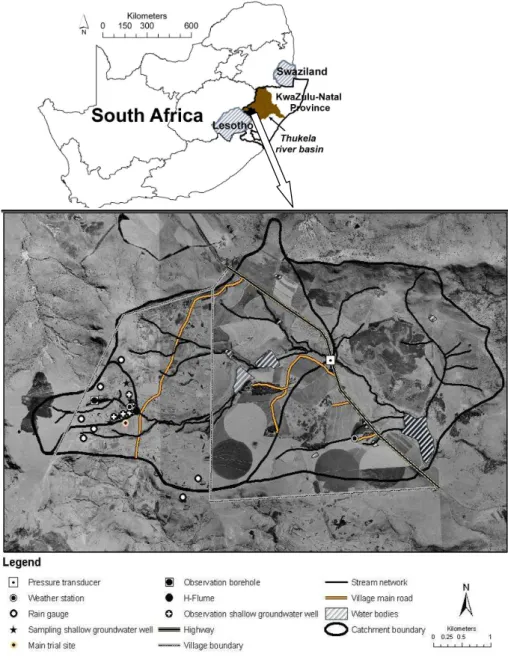
The Potshini catchment, Figs. 1, 2 and 3, is located in the foothills of the Drakensberg mountains in South Africa (29.3679◦E, 28.8145◦S) at an average altitude of 1310 m
and is predominantly a smallholder farming area and a sub-catchment of the Quaternary Catchment1 number V13D (Emmaus catchment) in the Thukela River basin in South Africa. The Thukela river basin is comprised of 86 Qua-ternary Catchments with a total area of 29 036 km2, with the Quaternary Catchment V13D having an area of 285 km2. The Potshini catchment comprises 2-nested catchments, with an area of 1.2 km2 (gauged by an H-Flume) and 10 km2
(gauged by a pressure transducer), respectively (cf. Figs. 1 and 3). The mean annual precipitation at Potshini is esti-mated to be 700 mm a−1and the estimated mean annual
po-tential evaporation is between 1600 to 2000 mm a−1(Kongo
and Jewitt, 2006). The rains occurs during the summer sea-son (September to April), with heavy rains being character-ized by thunderstorms and occasional hailstorms.
The maximum and minimum temperatures recorded in the catchment since 2004 are 34 and−4◦C respectively. Frost is common during the dry winter season (May to August) and has often destroyed vegetative materials in the catchment, including vegetables in homestead gardens. Due to local topography and high summer rainfall, a good drainage net-work has developed in the Potshini catchment with some of the streams being perennial and providing water for domes-tic use to the upper part of the catchment, while replenishing reservoirs for commercial farmers downstream. The main land uses in the catchment include the predominant small-holder farming (crop production) during summer, which con-stitutes approximately 60% of the total land in the catchment,
Fig. 1.An overview of the Thukela River basin and the nested Potshini catchment.
and grazing. The smallholder farms are individually owned while grazing areas and boreholes that were installed by the local authorities are considered common property. The main sources of water for domestic use in the community are bore holes, springs and the Potshini stream.
2 Objectives for establishing the Potshini catchment
monitoring network
The inclusion of people in research catchments has many challenges. Nevertheless, one cannot carry out convinc-ing studies on the interaction between water resources and food security of any rural community without considering
the livelihoods of the rural community and the dominant hy-drological processes taking place in the locality. It is with this understanding that the Potshini catchment monitoring network was established, to address some of the scientific and developmental objectives of the Smallholder System In-novations programme. The main objectives of establishing the Potshini catchment monitoring network were:
2510 V. M. Kongo et al.: Establishment of a catchment monitoring network through a participatory approach
H-Flume
Fig. 2.An overview of the households in the Potshini catchment.
– Establishing a capacity to assess, monitor, and man-age water and environmental resources in the Potshini community in collaboration with various stakeholders through training on the basic methodologies of catch-ment monitoring.
– Providing information to scientists and community members alike on the potential for improved productiv-ity from water resources of the catchment.
– Providing an opportunity for future and further research through the establishment of a catchment monitoring network with a potential for upscaling and integrating into other larger networks in the country. This is due to the fact that the network comprises several permanent structures which other researchers may use in their stud-ies in the future after the completion of the SSI research programme2.
The SSI research programme was focused on investigating the potential of small-scale water system innovations for up-grading rainfed farming in semi-arid agro-ecosystems, in-cluding aspects such as the need for local adaptations of these techniques, adoption of them among smallholder farmers and possible trade-offs between water for agriculture and water for surrounding ecosystems. It must be noted that SSI was both a scientific programme and as such dedicated to the livery of innovative and high quality research, albeit in a de-velopmental setting, as well as a development and outreach programme, dedicated to the improvement of human liveli-hoods through the application and uptake of water system in-novations (Sally, 2010). The instrumentation which formed the Potshini hydrological monitoring network ranged in so-phistication from simple manual rain guages, to state of the art instruments such as the Large Aperture Scintillometer.
2an aim which is being achieved through ongoing research initiative
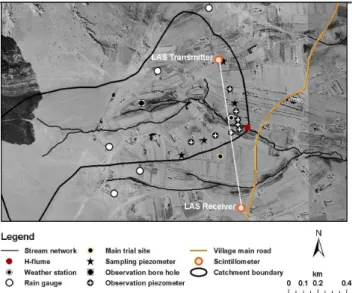
Fig. 3.The 1.2 km2Potshini catchment.
2.1 Main stakeholders
KwaZulu-Natal Provincial Department of Water Affairs and Forestry in providing monitoring and domestic boreholes.
The Potshini catchment was previously ungauaged and the catchment monitoring network already has provided benefits to both the local community on the upstream (as elaborated in subsequent sections of this paper) and to the downstream water users, e.g. the commercial farmers who rely on the water yields from the upper Potshini catchment for replen-ishing their farm dams (cf. Figs. 1 and 2). Any change in land use or water use, e.g. intensification of rainwater har-vesting on the upper catchment could significantly affect the catchment response, including water quality e.g. sediment load, which is an important parameter with regard to man-agement of the downstream reservoirs. It is also acknowl-edged that the water quality of the water filling the down-stream reservoirs could be impaired due to the anthropogenic activities on the upstream, e.g. washing clothes in streams using phosphorous-enriched detergents and intensive appli-cation of fertilizers on the smallholder farms in the commu-nity. Thus, the downstream water users were also important stakeholders in the hydrological research undertakings in the SSI research programme.
The Potshini catchment monitoring network comprised gauging structures and instrumentation, mostly automated, for measuring and monitoring stream flows, overland flow from experimental runoff plots, sediment load, shallow and deep ground water bodies, subsurface resistivity using Elec-trical Resistivity Tomography (Loke, 2003), isotopic com-position (Deuterium and Oxygen-18) in both surface and subsurface water, volumetric soil moisture content dynam-ics, soil hydraulic characteristdynam-ics, crop transpiration rates and meteorological variables. The application of scintilla-tion techniques (Large Aperture Scintillometer) in estimating total evaporation in the Potshini catchment formed an inter-mediate observation and a local-scale calibration for remote sensed estimates of total evaporation from satellite images in the catchment and the Thukela river basin at large, using the Surface Energy Balance Algorithm for Land (SEBAL) (Bastiaanssen et al., 1998a,b; Bastiaanssen, 2000). Initial results on hydrological studies based on data obtained from the Potshini catchment monitoring network are reported in Kongo and Jewitt (2006), Kosgei et al. (2007) and Kongo et al. (2010). In addition, various experiments in crop water use and land preparation were conducted where farmers were directly involved in assessing different land preparation and crop production techniques at field scale. Here, the research team provided detailed measurements of soil hydraulic char-acteristics and monitoring crop water use in close collabo-ration with the owner/smallholder farmer who kept detailed records of application and yield.
2.2 Overview of a logical hydrological measurement
sequence
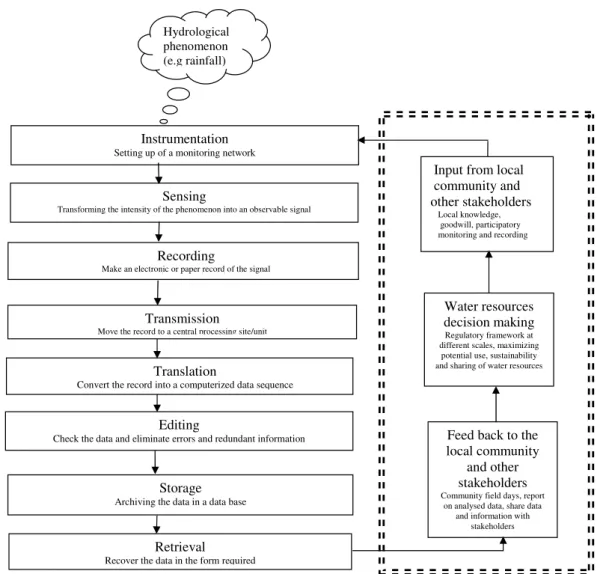
Although hydrological processes vary continuously in time and space, they are often described and derived from point measurements. The resulting data form a time series, which is typically subjected to further processing, including sta-tistical analysis and or hydrological modelling. Chow et al. (1988) highlighted a sequence of logical steps which are commonly followed for hydrological measurements and monitoring, beginning with the instrumentation of a physi-cal device that senses or reacts to the physiphysi-cal phenomenon and ending with the delivery of data to the users. Such a se-quence was adapted during the establishment of the Potshini catchment monitoring network with an additional participa-tory component where the input from the local community and other stakeholders was sought and incorporated as in-dicated in Fig. 4. In the absence of the participatory com-ponent, the sequence describes a scenario which is biased to understanding the hydrological processes in a catchment, but void of the social dimension of how the local community understand and respond to the hydrological processes being monitored. The social dimension is valuable for several rea-sons, including (i) the understanding by the researchers of the community’s knowledge base with regard to the dominant hydrological processes e.g. rainfall patterns, stream flows, temperatures etc.; (ii) creation of a platform for the commu-nity to learn more in quantifiable terms about the dominant hydrological processes taking place in their midst and the importance of understanding such processes and (iii) facil-itation and enhancement of the community’s willingness to invest time and effort in the monitoring activities, not with-standing their goodwill in maintaining and securing the vari-ous equipment and instruments in their midst.
2512 V. M. Kongo et al.: Establishment of a catchment monitoring network through a participatory approach
Hydrological phenomenon (e.g rainfall)
Retrieval
Recover the data in the form required
Sensing
Transforming the intensity of the phenomenon into an observable signal
Recording
Make an electronic or paper record of the signal
Transmission
Move the record to a central processing site/unit
Translation
Convert the record into a computerized data sequence
Editing
Check the data and eliminate errors and redundant information
Storage
Archiving the data in a data base
Instrumentation
Setting up of a monitoring network
Input from local community and other stakeholders
Local knowledge, goodwill, participatory monitoring and recording
Water resources decision making
Regulatory framework at different scales, maximizing
potential use, sustainability and sharing of water resources
Feed back to the local community
and other stakeholders
Community field days, report on analysed data, share data
and information with stakeholders
Fig. 4.Hydrological measurement sequence with a participatory component indicating the role of the local community and other stakehold-ers.
3 Monitoring network establishment
3.1 The participatory process
A communication process and dialogue was initiated be-tween the researchers and the relevant stakeholders in the catchment and the research approach applied in establish-ing the Potshini catchment monitorestablish-ing network followed a Participatory Research approach (Bhatt et al., 2006), where the smallholder farmers and other stakeholders were involved from the initial preparatory stages to the actual construction and instrumentation of the various structures and instruments and thereafter actively participated in the monitoring.
Local input was sought regarding the siting of structures and instruments and permission to develop a monitoring net-work was sought from the local farmers’ forum, individual farmers as well as from the traditional and local leaders of the area. Local artisans and masons were purposely involved in construction of various structures and installation of some
The local community continued to be a key stakeholder in the SSI research programme and an effort was made to-wards creating and maintaining a cordial relationship with the community based on respect, trust and friendship, an as-pect which is expanded upon in Sect. 4 of this paper.
3.2 Siting of stream flow gauging structures
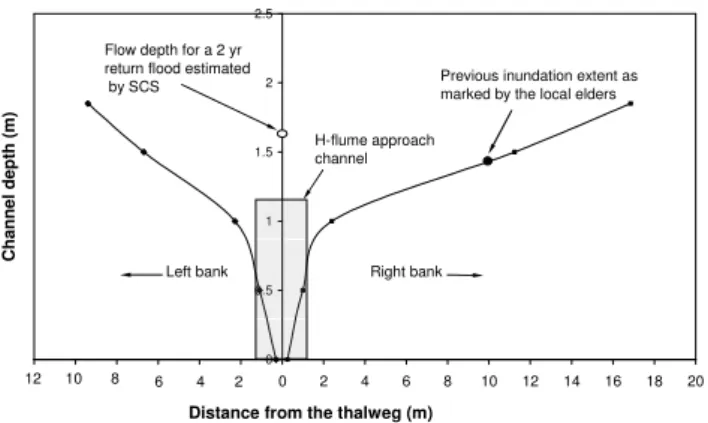
The establishment of the Potshini catchment monitoring net-work involved the initial stage of reconnaissance surveys to gain a general understanding of the catchment before detailed and specific site surveys were performed as per requirements of each structure or instrument. The siting of the stream flow gauging sites and design of the gauging structures in the Pot-shini catchment involved the application of the local knowl-edge, scientific and engineering techniques. In particular, the local knowledge on the historical peak flows and flood prone areas was vital during the design and construction of one of the stream flow measuring structures, i.e. an H-Flume, where community members, especially the elders, were involved in some of the reconnaissance surveys in the catchment with re-gard to siting for an appropriate section along the stream for its construction. For example, the elders were asked how of-ten the stream in the Potshini catchment overtopped its banks and whether the sites that had been identified as ideal for constructing the H-flume, based on the criteria highlighted in Kongo et al. (2007), were safe from flooding and inunda-tion. According to the elders, the site where the H-flume was eventually constructed was prone to inundation at most every three years and they even marked the inundation extent for flooding event at this section as indicated in Fig. 5. This in-formation was useful in the design of the H-flume, especially the orientation of the instrumentation house as discussed in Sect. 3.3 of this paper.
Even though the stream-section on which the H-flume was constructed was prone to inundation (based on local knowl-edge), it was preferred due to the structural stability of its narrow banks, presence of underlying rocky material for sta-bility of the approach channel, and most importantly enough bed slope for preventing downstream inundation, which is an important parameter in construction of H-flumes (Ackers et al., 1978). It is interesting to note that the information obtained from the local community with regard to historical peak flows (cf. Fig. 5), i.e. stream flow depth during histori-cal peak flows, was in close agreement with results obtained from a modeling exercise, using the Soil Conservation Ser-vices (SCS) methodology (Schulze et al., 1992), in determin-ing peak floods from the Potshini catchment.
3.3 Design and construction of the H-flume
The main reason for using an H-flume rather than a weir in the 1.2 km2Potshini catchment was to facilitate accurate monitoring of the sediment load and low flows. The flume was designed to carry a maximum flow of 3.4 m3/s at a depth
0 0.5 1 1.5 2 2.5
-12 -10 -8 -6 -4 -2 0 2 4 6 8 10 12 14 16 18 20
Distance from the thalweg (m)
C
h
a
n
n
e
l
d
e
p
th
(
m
)
2 4 6 8 10 12
Left bank Right bank
Previous inundation extent as marked by the local elders H-flume approach
channel Flow depth for a 2 yr
return flood estimated by SCS
Fig. 5.Schematic diagram of the cross section at the H-flume gaug-ing site (with a vertical exaggeration). See Figs. 1 and 2 for location.
of 1.2 m. Necessary precautionary features and safety fac-tors, together with advice and knowledge from the local peo-ple, were incorporated in the design and construction of the instrumentation house and the approach channel to allow the safe passage of a 2-year return period flood without affect-ing its structural stability. In particular, the orientation of the H-flume’s instrumentation house was influenced by the local knowledge from the elders of the Potshini community on in-undation extent at the site where the gauging structure was constructed as illustrated in Fig. 5.
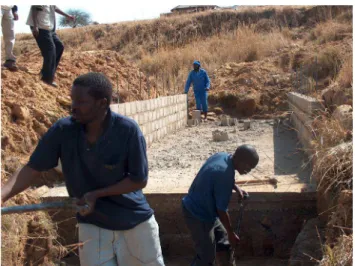
The H-flume was constructed with active participation of the local Potshini community, where the local leaders were asked to identify the suitable masons in the community based on the quality of their past workmanship, especially in build-ing brick/block houses in Potshini and surroundbuild-ing commu-nities. It turned out that three masons had unique experi-ence in certain construction aspects, e.g. foundation, concrete works etc. and hence the SSI research team found it prudent to involve the three as the lead technical team in construc-tion of the H-flume and asked them to find four other per-sons from different parts of the community to provide labour. Such an approach perpetuated a sense of cohesiveness and team work to the construction team and which turned out to be beneficial after the construction works under the SSI research programme where the same team continued to pro-cure local tenders for construction of both traditional (grass thatched with mud walls) and permanent (block walls with galvanized or tile roofing) houses in the Potshini community, neighbouring communities and the nearby Bergville town.
2514 V. M. Kongo et al.: Establishment of a catchment monitoring network through a participatory approach structure before and above all it was to be built in a flowing
stream. In this regard, the SSI researchers sought to know the cost of constructing a house in the community, using the same number of building blocks as the H-flume, and added 30% of such a cost to take care of the extra labour input that was to be required especially in excavation and reinforce-ment works. In all, the total cost of constructing the H-flume, in 2004, was approximately US$ 4000.00, with the labour cost constituting 32% of the total cost i.e. US$ 1300.00.
The local construction team portrayed impressive skills, from reading an engineering design drawing to brick and re-inforcement works. The SSI researchers managed to point out in advance the few construction errors that were ob-served, and which were corrected accordingly. Figure 6 shows the construction of the H-flume in progress. Signif-icantly, the construction team appreciated some important procedures and skills that they learnt during the construction exercise, including the importance of precision in measure-ments, timeliness and above all their ability to construct a hydraulic structure in a flowing stream, an endeavor they had not undertaken before. Such skills were beneficial later to some members of the construction team when the same team was contracted later in 2005 and 2006 to construct subsur-face rainwater harvesting tanks in the community by the SSI researchers and another community development project in Potshini, funded by the Water Research Commission (WRC) of South Africa. One of the criteria that was used to recruit the construction team members in constructing the tanks was their previous experience, which had been demonstrated by those who had constructed the H-flume.
3.4 Monitoring stream flow
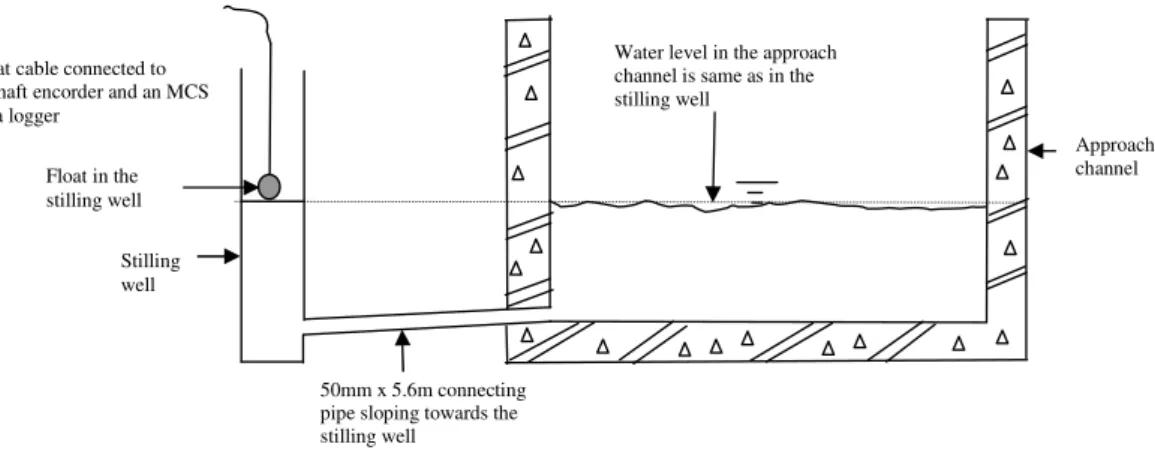
Stream flow at the larger 10 km2nested Potshini catchment (cf. Fig. 1) was gauged by monitoring the stage water level fluctuations, at a road culvert, using a pressure transducer. A rating curve was developed at this road culvert gauging site after carrying out velocity transect surveys, using a pro-peller current meter, on discrete days between 2005 and 2007 and for different discharges. Some members of the Potshini community voluntarily participated in the discharge mea-surement exercise and benefitted from an understanding of the various controls on streamflow in the catchment. For ex-ample, the flows at the culvert bridge are controlled by the upstream farm-dams (cf. Figs. 1 and 2) and most often the flows that are observed at this section are low flows with lim-ited sediment loads and hence there was no need to monitor sediment fluxes at this point except for stage measurements. Level of discharge at the Potshini H-flume (cf. Figs. 1, 2 and 3) was monitored via a tube, connecting the open ap-proach channel discharge to a stilling well as illustrated in Fig. 7.
The Potshini community was also involved in the ongoing monitoring. Every Monday of each week, and after a rain-fall event, a designated community member, who was also
Fig. 6.Constructing the H-Flume in the Potshini catchment.
the SSI programme facilitator in the community, took man-ual readings of the depth of flow, date and time at the H-flume gauging site using a stainless steel tape measure. It is useful to note that the community facilitator was elected by the Potshini community in a well attended community meet-ing, to assist or facilitate the SSI researchers on behalf of the community, during the initial stages of implementing the SSI programme. The manual measurements were used to check the stage readings recorded by the data logger. It was inter-esting and encouraging to note that the community facilita-tor urged his fellow community members, especially those who had manual rain gauges installed in their homesteads, (Sect. 3.6), to accompany him to the H-flume gauging site when taking the stage readings. This had the benefit of mak-ing them aware of the quantifiable relationship between rain-fall, which they were recording at their homesteads, and the stream flow recorded at the H-flume. Only the community facilitator was compensated for his continuous monitoring efforts; all the other community members participated in the monitoring activities in the SSI programme out of their inter-est and goodwill.
3.5 Monitoring of sediment load and isotopic
composition of stream flow
It is always a challenge to obtain a representative water sam-ple in streams at the desired time and hydraulic conditions, for analytical work on water quality. This is compounded by the fact that stream flows emanating from head water catch-ments of relatively small area in semi-arid areas are highly variable, with rapid overland flows and interflows (Kongo, 2008). Thus a good sampling scheme should take into con-sideration such variations of flow by taking frequent samples during a changing flow.
50mm x 5.6m connecting pipe sloping towards the stilling well
Stilling well Float in the stilling well
Water level in the approach channel is same as in the stilling well
Float cable connected to a shaft encorder and an MCS data logger
Approach channel
Fig. 7.A schematic diagram indicating the mechanism for monitoring the approach channel flow depth using a stilling well and float at the Potshini H-Flume. The length and width of the approach channel are 11.5 m and 2.7 m respectively.
analyzed from samples obtained from the 1.2 km2catchment
which was gauged by an H-fume and equipped with an ISCO sampler, the latter being controlled by a data logger as illus-trated in Fig. 7. The sampler had a capacity of 24 bottles of 500 ml each and the sampling-trigger parameters in the data logger were varied, depending on the season, to achieve the desired sampling scheme. The local community had a signif-icant role in this monitoring exercise where three members of the community, including the community facilitator, took turns to check on number of bottle samples already filled in the ISCO and notified the researchers by sending a cellphone text messages (SMS) when the number of remaining empty sample bottles in the ISCO was less than 10.
The community facilitator was trained to remove samples from the ISCO, label the samples, replace the empty bot-tle cartridge in the right position and to reset the sampling scheme in the data logger. This had the benefit of ensuring that there were always empty sampling bottles in the ISCO, especially during the wet season if by any chance the re-searchers were not in the catchment. Manual samples for isotopic analysis (18O and 2H) were taken at the outlet of both the 1.2 km2 and 10 km2 catchments. These samples were mainly taken by the local community once every week (on a Monday) and labeled accordingly (i.e., site name and time of sampling). It should be noted that the main rea-sons for automating the measurement and sampling of stream flows were (i) for convenience purposes, especially during the night when it was difficult for both the researchers and community members to take samples and measurements and (ii) for continuous monitoring, thus accounting for extreme events e.g. big rainfall events which led to increased stream flows and sediment loads.
The water samples were temporarily stored in the instru-mentation house of the H-Flume before being taken to the relevant laboratories for analysis. Some of these samples were displayed during field days in the community when other neighbouring communities (smallholder farmers) were
invited. It was interesting for the smallholder farmers to note the clear difference between samples taken: (i) before a rain-fall season (low flows); (ii) at the beginning of rainrain-fall sea-son; (iii) during a storm event; (iv) after a rainfall event and (v) the end of a rain season. Samples taken at the beginning of the rainfall season and during a storm event had more sed-iment material (dark brown in colour) compared to the rest. The samples taken during the low flows, dry winter season, were clear and void of sediments. From these visual observa-tions, the smallholder farmers appreciated the fact that there was a relationship between the type of land cover on their farms, rainfall intensity and the sediment load, the latter be-ing an indicator of loss of good fertile soil. This aspect was further reinforced through quantitative results which were graphically presented to the community during farmer’s field days. The communication and feedback mechanism that was used in this study is highlighted in Sect. 4 of this paper.
3.6 Climatic parameters
2516 V. M. Kongo et al.: Establishment of a catchment monitoring network through a participatory approach the identified households and training to record and keep the
daily rainfall records undertaken. The smallholder farmers recorded rainfall twice a day, i.e. at 09:00 h and 17:00 h, from which the total daily rainfall was computed as the sum of the morning and evening readings. One of the profound state-ments made by one of the smallholder farmers who partici-pated in monitoring rainfall in the catchment using a manual rain gauge was the fact that he was now in a position to tell, in quantifiable terms, how much it had rained and confidently share this information with his peers, unlike before he had a rain gauge.
One of the main factors that determine the planting date of the maize crop in Potshini, the main food source in the community, is the onset of rainfall. Farmers have been ad-vised by the extension personnel in the district Department of Agriculture that they should sow their seeds after receiving a cumulative of 30 mm of rainfall. Thus, this underpins the im-portance which the most of the community members attach to monitoring of rainfall but which had previously been per-ceived as too difficult or complicated to undertake. The peer to peer learning and engagement process on rainfall monitor-ing in the Potshini community paid dividends when some of the other smallholders bought their own raingaguges and re-quested the SSI researchers to facilitate their installation and data recording. It was interesting to note the enthusiasm, in most community members, in participating in the monitor-ing of rainfall after the SSI researchers highlighted the fact that the daily television weather bulletin uses similar rain-fall measurements to generate information on the distribution of rainfall in the country. Such an understanding increased the enthusiasm of the community members and engendered a feeling of importance of the monitoring exercise at both village and national level, and in fact raised hopes of hosting a national monitoring station in their midst.
The daily rainfall data was collected from the smallholder farmers by the SSI researchers on a weekly basis, during the rainfall season, and incorporated in a database for the Pot-shini catchment. Thus, voluntary participation of the local community in data collection promoted the philosophy of participatory catchment monitoring to the Potshini commu-nity as envisioned in the SSI research programme.
Rainfall data from the manual raingauges were augmented by climatic records from two automatic weather stations in-stalled in the two nested Potshini catchment (cf. Fig. 1). One of the weather stations was installed in 2005 in the middle of the village (community weather station) and upstream of an existing telemetric weather station which was operational since 2002 on a nearby commercial farm and managed by the Agricultural Research Council (ARC) of South Africa. In 2007, a rainfallcollectorwas attached to the automatic rain-gauge in the community weather station to collect rainwater for analysis of isotopic composition of18O and2H. The col-lectorcomprised six-400 ml bottles which filled sequentially during a rainfall event and is designed to prevent evaporation of the collected samples. The community members assisted
Tipping bucket
Drainage channel
Fig. 8.A set of runoff plots under different treatments in a farmer-managed trial.
in storing and labeling of the rainwater samples after a rain-fall event and emptied the bottles to allow fresh rainwater samples to fill the bottles during a subsequent rainfall event. Since its installation, the weather station in the middle of the village was maintained by the local Potshini community, in-cluding fencing of the station and maintaining tidiness within and on the surrounding area. Fencing of the weather station was necessary to safeguard the instrumentation against the cattle which grazed freely, especially during the dry winter season. Otherwise the security of the weather station was en-trusted to the local community, through the traditional leader-ship of the community and the goodwill generated by the par-ticipatory engagement of the Potshini community and other stakeholders at the initial stages. The climatic data from these two stations was accessible to researchers in the ARC, the SSI programme and any other interested stakeholder.
3.7 Runoff plots
One of the research themes in the SSI research programme was aimed at investigating the hydrological processes and de-termine water balance in smallholder farmers’ fields (<1 ha)
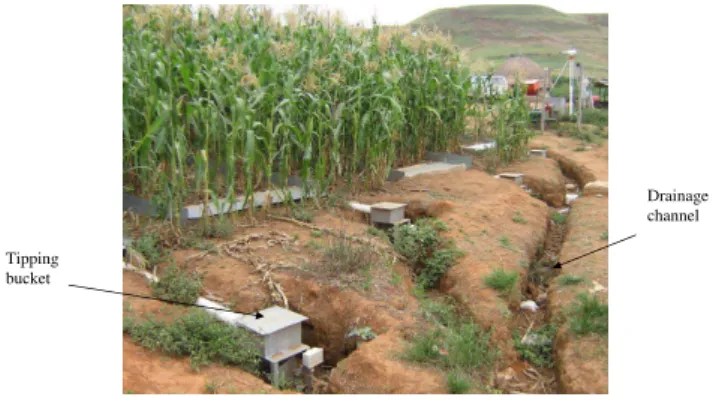
and hence runoff plots were installed for this purpose; as con-trolled micro-catchments. Seventeen runoff plots, with sim-ilar slopes and under different treatments, i.e. conservation and conventional tillage practices were installed at three dif-ferent smallholder farms and one researcher-managed trial. The latter was a controlled site where experimental set up and trials, with some of the treatments being similar to the farmer- managed trials, were carried out in an effort to com-pare and validate the results from the farmer managed trials (Kosgei, 2009). Figure 8 shows a set of runoff plots at a farmer managed trial site.
3.7.1 Surface runoff
crop transpiration rates, crop phenological properties and biomass production. Three members of the Potshini com-munity were trained and participated in the installation of the runoff plots, including the automation system in mon-itoring some of the processes e.g. surface runoff, sediment load, soil moisture, etc. These members of the community appreciated the convenience of automating the data record-ing process and took interest in understandrecord-ing the principles applied. Payment for services was not the norm, but in most cases, when working in the field, the SSI researchers either organized packed lunch for all i.e. the members of commu-nity working with them and themselves, or arranged for food to be prepared for all in a homestead of one of the commu-nity members. Such an approach further perpetuated a sense of togetherness and cohesion between the community and re-searchers.
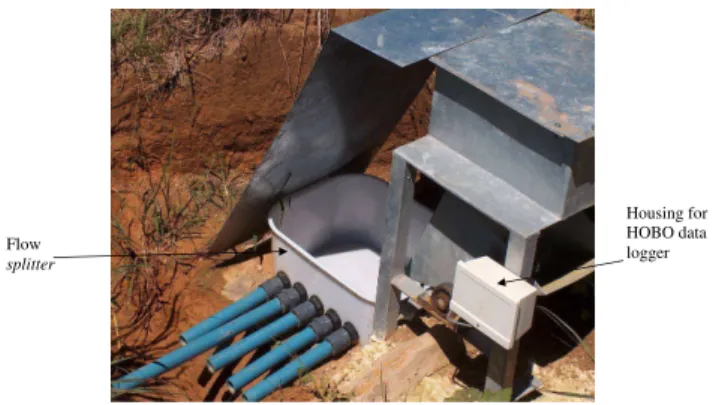
The tipping buckets (cf. Fig. 9), in all the runoff plots had both manual counters, for counting the number of tips on each bucket, and an electronic recording system with a proxy switch connected to a data logger. The manual coun-ters were very useful when explaining the impact of the dif-ferent tillage treatments on runoff generating characteristics to farmers during field days. The farmers could clearly see from the manual counters the comparative difference in the number of tips in the runoff plots under conservation and conventional tillage systems, of which the latter had more tips (Kosgei, 2009). Thus, the community appreciated the fact that more water is conserved under conservation tillage practices compared to conventional tillage practices.
3.7.2 Sediment load
Sediment loads were recorded from the different treatments, using a sediment sampler, in the five treatments at the re-search managed trial site. The sediment samplers consisted of flow splitting containers (flowsplitters) and a sample stor-age tank. The flowsplitters, Fig. 9, captured the discharge from one side of a tipping bucket (half of the total flow from a runoff plot) during each runoff event.
After each runoff event, and after vigorous stirring, 500 ml discharge samples were manually taken from the sample tank and labeled by members of the local community for sedi-ment load analysis and composition of stable isotopes of wa-ter. The sample tanks were emptied by the members of the community after the sampling exercise to allow fresh dis-charge to drain into the tanks in subsequent runoff events. The smallholder farmers were also shown, during field days, some of the samples taken from each treatment after rain-fall events and it was clear that samples obtained from runoff plots under conventional tillage systems had more sediment compared to those from conservation tillage.
The smallholder farmers appreciated the results obtained from the runoff plots experiment, including the potential to conserve soil moisture and soil nutrients when using conser-vation tillage system. Some of the results obtained from
Flow
splitter
Housing for HOBO data logger
Fig. 9.A tipping bucket with flowsplitter.
this experimental set-up are highlighted in Kongo and Je-witt (2006) and Kosgei et al. (2007). However, the small-holder farmers noted two main challenges, i.e. the cost im-plication of implementing conservation tillage compared to the conventional system and the inability to keep sufficient crop residues on their farms (mulching) due to uncontrolled grazing of livestock in the community during the dry winter season.
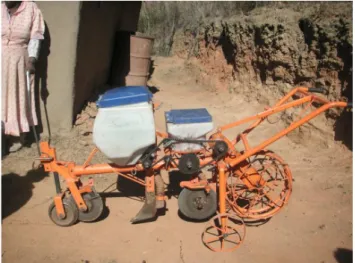
Despite these challenges, the farmers noted and appreci-ated the potential benefits of conservation tillage systems in ensuring their food security and took a proactive stance in procuring a community No-Till planter. In early 2010, the Potshini community leadership approached the SSI re-searchers and requested the University of KwaZulu-Natal, through the School of Bioresources Engineering and Envi-ronmental Hydrology (SBEEH), to assist them in purchasing the planter. The school of BEEH and the Potshini commu-nity agreed to share equally the cost of purchasing the planter (cf. Fig. 10), the total of which was R12 000 (currently ap-proximated at US$ 1720). Such a proactive endeavour by the smallholder farmers, in investing resources as a result of lessons learnt from the conservation tillage experiments, is evidence of the contribution of research to improving liveli-hoods of the local people in the Potshini community.
It was interesting to note that two of the three members of the community who participated in installing the runoff plots under the SSI research programme were hired a year later by another research project in the same area to install runoff plots for monitoring runoff and sediment load under different engineered slopes e.g. roads embankments etc. The training further gave these community members an insight into the systematic process of setting a field experiment including the rigour required in ensuring good representative samples and measurements.
3.7.3 Soil moisture profiling
2518 V. M. Kongo et al.: Establishment of a catchment monitoring network through a participatory approach
Fig. 10.The Potshini community No-Till planter.
in all runoff plots. The installation of access tubes, for guid-ing the Time Domain Reflectometry (TDR) probe along the soil profile, were installed with the participation of the local community, who also took soil moisture reading on a weekly basis. Notably, each owner of the smallholder farms where the runoff plots were installed took part in the installation process and also in taking the measurements at their own site through a process formulated by the community facil-itator. The facilitator was the custodian of the TDR probe and most often, during community meetings, field days and peer farmer’s visits, he showed his fellow community mem-bers the process of taking soil moisture readings. The com-munity members were able to appreciate the fact that it was possible to quantify soil moisture and the effect of differ-ent tillage systems on soil moisture. The weekly soil mois-ture data obtained from all runoff plots indicated that conser-vation tillage conserved more soil moisture, especially dur-ing the dry season, compared to conventional tillage prac-tices. This was clearly evident in plots that had sufficient mulch and crop residues. The soil moisture results obtained from these experimental plots, and graphically presented to the community, motivated other smallholder farmers to use mulching in their kitchen gardens during the dry winter sea-son. The gardens were promoted by the SSI researchers in the Potshini catchment as one of the strategies to improve livelihoods in the community where the smallholder farmers were introduced to rainwater harvesting techniques to store rainwater for irrigating kitchen gardens during the dry win-ter season (Kosgei, 2009). The weekly soil moisture data on these experimental plots was complemented with data from Watermark sensors (Allen et al., 2000; Hanson and May, 2006), where a nest of three sensors were installed in all the 17 runoff plots in the catchment at depths of 30, 60 and 90 cm. The data sets from the Watermark sensors were pre-sented to the community members, during farmer’s days, and through this instrumentation set-up the smallholder farmers
appreciated the fact that soil water takes time to percolate and move down the soil profile and that percolation is a function of soil type and surface cover.
3.8 Monitoring of shallow ground water
Subsurface flows constitute an important component in de-veloping a water balance for a catchment and hence the need to monitor their occurrence and magnitude. The shallow ground water in the Potshini catchment was monitored via 12 shallow ground water wells (piezometers), which were installed through the collaboration and participation of the local community. Figure 3 shows the layout of the shallow groundwater wells in the catchment. Since the intensively-monitored upper sub-catchment (cf. Fig. 1 and 3) is predom-inantly an agricultural area for smallholder farmers, permis-sion was sought from the local leaders and individual farm-ers to allow the augering of the 100 mm diameter holes in some of the farms before inserting special 63 mm diameter pipes. The wells were located along transects, and strategi-cally installed on sites where they could not interfere with the farming activities, since most of the farming operations in the area make use of animal and or tractor drawn imple-ments. Pressure transducers were then installed in 8 of the shallow ground water wells and HOBO data loggers recorded the fluctuation of the water table at a time step of 30 min. The installation of the 12 shallow groundwater wells, like any other installation in the community, was preceded by a meeting with the community where the SSI researchers ex-plained the objective and approach of the experimental set-up. It was interesting to note that some community members had previously thought that the wells could be used for ir-rigating their farms, a point which was clarified during the meeting. Some of the community members were interested to know how deep the groundwater was in their farms and possibly its quality and hence they enquired about the possi-bility of extending the installation of the wells to their own farms. Thus, the farmers were not compensated for installing these wells in their farms but rather were all looking forward to having the wells in their midst. Labour was sought from the community in augering these wells and paid at the stan-dard national rate at the time of R75 per day (about US$ 10 in 2005). However, as highlighted in Sect. 3.71, this payment was considered more of an appreciation of their time and not exchange for labour as it is in most cases.
these observations with the filling of their pit latrines with subsurface water during the wet season, especially those in the low lying areas, and failure of foundation in some houses in the community. The community members also mentioned the fact that some of the crop failure in the community was attributed to water logging during the peak of the rainfall sea-son. The SSI researchers highlighted the fact that there was a potential danger of polluting the shallow groundwater re-source in the community through the direct contact and mix-ing of the waste in pit latrines and the shallow ground water. This cautious remark was supported by the fact that the soils in the catchment had a relatively high hydraulic conductivity (Kongo, 2008). These results and observations were benefi-cial to the community as some members started using con-crete blocks to build their pit latrines and also reinforcing the foundation of their houses.
3.9 Monitoring of deep groundwater
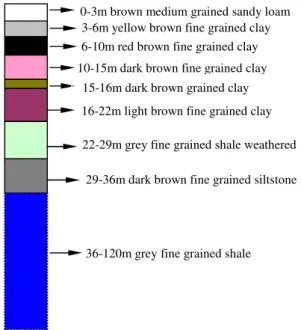
Through funding from the KwaZulu-Natal Provincial De-partment of Water Affairs and Forestry3(DWAF), and in col-laboration with the local community, two deep ground water observation well sites were identified and the boreholes sub-sequently sunk in the Potshini catchment. It should be noted that the main source of domestic water in the community is groundwater. However, there was uneven distribution of water supply wells in the catchment, especially towards the southern part. Thus, the community requested that one of the boreholes to be used for supplying domestic water especially in the area with no water supply wells. It was then agreed, between the SSI researchers, DWAF and the Potshini com-munity that one of the boreholes was to be dedicated to mon-itoring of deep groundwater table and the researchers were to decide where to install it in the catchment, after conducting geophysical measurements, while the community was to de-cide where to install the second borehole. The borehole log information of the 120 m deep well that was installed solely for research purposes is as shown in Fig. 11.
The community was happy with this arrangement and fur-ther gave the researchers’ permission to monitor the ground-water levels in the new community borehole as well as three other boreholes, previously installed by the local authorities, which were being used by the community for water supply. Thus, through the participatory engagement, the researchers were able to expand the spatial coverage of monitoring deep ground water in the catchment including monitoring for the stable isotopes. However, it was apparent that the commu-nity would still have agreed to the researcher’s request even if there were limited funds to sink only one observation well for research purposes, thus highlighting the good working re-lationship that had been established between the researchers and the community at that time. DWA continue to sup-port the monitoring of the deep groundwater in the Potshini
3Now Department of Water Affairs
29-36m dark brown fine grained siltstone
36-120m grey fine grained shale 22-29m grey fine grained shale weathered 16-22m light brown fine grained clay 10-15m dark brown fine grained clay
6-10m red brown fine grained clay 3-6m yellow brown fine grained clay 0-3m brown medium grained sandy loam
15-16m dark brown grained clay
Fig. 11.Borehole log information including the lithology, grain size and colour for a 120 m deep observation ground water well in the Potshini catchment.
catchment, even after the end of the SSI research programme, as part of an initiative to monitor ground water in the larger Thukela river basin and hence meeting the community’s de-sire for a nationally relevant monitoring site to be established in their midst.
3.10 Electrical Resistivity Tomography (ERT) survey
2520 V. M. Kongo et al.: Establishment of a catchment monitoring network through a participatory approach
Fig. 12.Location of resistivity survey transects in the Potshini catchment.
Five members of the community were engaged and paid the standard daily wages in the mapping exercise. It was interesting to note the curiosity that this exercise generated in the community. Occasionally, a group of anxious mem-bers of the community would join the mapping team for an explanation on the measurement procedures and data inter-pretation. This prompted the SSI researchers to arrange for a demonstration exercise to the community where all the de-tails on the protocol, measurements and validation of the resistivity data were highlighted. The community members understood the concept of ERT mapping on the explanation that it was synonymous to a medical X-ray examination, with which they were familiar. Thus, they appreciated the fact that
3.11 Monitoring of total evaporation using a Large Aperture Scintillometer
The conventional approaches for quantifying total evapora-tion (ET) have been based on localized point measurements and hence constrain the estimation of the flux over large ge-ographical areas. A Large Aperture Scintillometer (LAS) is an instrument that measures sensible heat flux, a component of the surface energy balance, over a transect (typically less than 10 km). With known net radiation (obtained from net radiometers in weather stations) and soil heat flux (obtained from field soil heat flux measurements), the latent heat flux can be computed as a residual in the energy balance equation as indicated in Eq. (1).
λ Et =Rn −H −G (1)
whereλEtis the latent heat flux (W m−2),Rnis the net
radi-ation (W m−2),His the sensible heat flux (W m−2) andGis
the soil heat flux (W m−2). The total evaporation can then be computed from the latent heat flux.
The measurement of total evaporation in the Potshini catchment using LAS at the Potshini catchment, Fig. 13, started in April 2006 and continued until early 2007, though the exercise was occasionally interrupted after the LAS was damaged by local lightning strikes, especially during the wet summer season, and it took some time to get the instrument repaired due to technical and logistical problems. The fre-quency of measurement with the LAS was every minute and the instrument was left in the field throughout the measure-ment period. The installation and siting of the LAS was done in collaboration with the local community in the Potshini catchment. The community members were amazed when they were informed of the cost of purchasing the LAS, which in 2004 was around US$ 60 000, and appreciated the trust the SSI programme had in them by installing such expen-sive equipment in their midst. By 2004, there were less than 5 Large Aperture Scintillometers in Africa and one of them was running in the rural Potshini community in South Africa. Thus, the LAS became a status symbol for the community. This was evident when the community leadership suggested, during installation, that the receiver and transmitter to be in-stalled in homesteads of good reputation for safety purposes. This suggestion was adhered to by the SSI researchers and the goodwill of the whole community was sought with regard to the safety and security of this state of the art instrument.
Consequently, the transmitter and the receiver were sta-tioned at homesteads in the community, and the owners vol-unteered to maintain and ensure the security of this expensive instrumentation. The whole community was involved during the initial stages of installing the LAS through community meetings which were mobilised by the local leadership. The transmitter was powered by mains power supply, from one of the homesteads, and the the SSI research programme paid for both its power consumption and that of the homestead as a form of appreciation for the commitment by the head of the
Fig. 13.The receiver of the Large Aperture Scintillometer in one of the homesteads in the Potshini catchment.
homestead to safeguard the equipment in his homestead. The LAS was an attraction to many visitors in the community, in-cluding Government department officials.
The SSI researchers had to furnish the community facili-tator with sufficient information on the LAS to enable him respond effectively to questions from visitors. The facilita-tor also used such inquisitive visits to the LAS to inform the visitors of the other SSI research initiatives and instrumen-tation in the catchment and hence it provided a platform for communication and outreach. The data sets obtained from the LAS were presented to the community members together with the remote sensing estimates of total evaporation as highlighted in Sect. 3.12.
3.12 Remote sensing
There are many applications of remote sensing in water re-sources management including hydrogeologic mapping, lan-duse change studies, estimation of total evaporation, map-ping and monitoring of wetlands etc. One of the main appli-cation of remote sensing in the Potshini catchment was the estimation of total evaporation (ET) in the catchment and a larger part of the Thukela river basin using the Surface En-ergy Balance Algorithm for Land (SEBAL), (Bastiaanssen et al., 1998a,b; Bastiaanssen, 2000). Some results on the vali-dation of SEBAL, using data from the LAS, in the Potshini catchment is highlighted in Kongo et al. (2010).
2522 V. M. Kongo et al.: Establishment of a catchment monitoring network through a participatory approach the smallholder farmers comprehended the results in the
con-text of their land uses. The smallholder farmers managed to identify and highlight from the map that there was less ET over the grazing areas compared to cultivated areas. They attributed this to lack of good vegetative cover of which is important in protecting the soil from erosive forces.
4 Communication and feedback platforms for learning
and sustainable adoption
In the SSI programme, some of the participatory techniques used included case studies, informal discussions, work shar-ing, village presentations, field days, process notes, personal diaries, semi-structured interviews, key informants and ma-trix scoring (Sturdy et al., 2008). An effective participatory learning process must involve a feedback mechanism where continuous updating and response are integrated in the learn-ing process. Such feedback mechanisms should accommo-date as much as possible, the opinions and ideas from the various stakeholders. In the Potshini catchment, feedback forums were promoted and encouraged for all stakeholders, at the various levels of participation, where the respective stakeholders were continuously updated on the main research findings, progress on data collection and upcoming research activities within a year. It is during such feedback sessions that the respective stakeholders obtained an in-depth under-standing of the ongoing research activities, and appreciation of their contribution to the SSI research programme and to understand the vagaries of hydrological processes in their catchment. As highlighted by (Liniger and Critchley, 2007), dissemination of information is a socio-cultural process and a critical component of developing sustainable change in a community and the spontaneous spread of innovations occurs almost exclusively through farmer-to-farmer information ex-change.
A monthly Farmers Forum, established as a communica-tion and management platform for farmers in the Emmaus ward (the administrative ward in which Potshini falls) in the Bergville District under the then Agricultural Research Council’s (ARC) Landcare Project, proved to be a useful platform for the researchers, for dialogue with farmers and for other stakeholders in the area. This forum provided an entry point for the SSI team and through it, the researchers were able to outline the objectives of the SSI programme in the area, its implementation and most importantly the use-fulness of voluntary participation of farmers in the research programme. The researchers managed to effectively use the farmer-to-farmer learning structures previously put in place by the ARC Landcare project (Smith et al., 2004) for estab-lishing contact with individual smallholder farmers who were willing to participate in the SSI research programme, espe-cially in the catchment monitoring exercise. It is through such forums that a good working relationship between the
local statutory organizations (both Provincial and District of-fices) and the research team were established. Since then, the SSI Programme continued to benefit and enjoyed the support of these organizations and the SSI researchers attended or were represented at relevant provincial and municipal level functions, which provided a forum for all stakeholders and development projects working in the District on food secu-rity, home economics, community resources and the agricul-tural sector. The SSI research team participated in all nearby field days organized by these bodies in Potshini and other nearby wards in the Bergville District and likewise, these bodies actively participated, and even facilitated some of the field days organized by the SSI research programe in Pot-shini.
5 Key lessons from the participatory catchment
monitoring in Potshini
Engaging stakeholders is a process, with varying challenges depending on who is engaged and the basis for engagement. Most of rural communities in sub-Saharan Africa are en-gaged in either agricultural or pastoral activities and often support or adopt initiatives that are geared towards enhancing their livelihoods. These communities have governance struc-tures, formal or informal, of which the leadership and the community at large expect to be recognized and respected by all including visitors. This was the case in the Potshini community. From our perspective, the SSI programme man-aged to achieve more in the various projects that were im-plemented in the Potshini catchment, including the partic-ipatory catchment monitoring, through the recognition and appreciation of the governance structures in the community and working within these structures. A similar approach was used when engaging the various government departments in Bergville district and the KwaZulu-Natal Province. Thus, there is always a process to follow (informal and or infor-mal) when engaging stakeholders, which needs to be based on trust, honesty and friendship.
results from the various tillage trails in the Potshini catch-ment, including the farmer-managed trials, gave the Potshini community the confidence to invest their resources to buy a No-Till planter, with the help of the University of KwaZulu-Natal as discussed in Sect. 3.72.
Engaging the learning institutions in the local area has both immediate and long term benefits as was realized in the Potshini community. The Potshini secondary school was en-gaged in the monitoring process where the final year students were always given a practical overview of the various exper-imental set ups and the larger integrated monitoring network. This was implemented through the school curriculum’s Life Science subject. Such an approach created a learning mecha-nism in the community and had a much wider impact, reach-ing many more people in the community than previously thought.
In most social or development processes, the ultimate ben-efits to the community are not necessarily known. How-ever, the process creates a platform for other opportunities. This is normally the case where various development part-ners and stakeholders are actively engaging with the local community. The initiation of rainwater harvesting and stor-age in the Potshini catchment was received positively by the local community and other development stakeholders includ-ing government departments. This was evident after the three farmers (homesteads), who had been facilitated by the SSI programme to harvest and store rainwater for supplemen-tal irrigation for their kitchen gardens, managed to improve their livelihoods through sale of vegetables during the dry winter season. This success story precipitated the commis-sioning of a community development project in Potshini by the Water Research Commission (WRC) of South Africa. The WRC project provided 20 000 L water storage tanks to 40 homesteads in Potshini for storing rainwater for supple-mental irrigation in their kitchen gardens and there were plans to outscale the WRC project to other nearby communi-ties. Thus, starting a useful and beneficial process brings or attracts other unexpected and or indirect benefits. However, the challenge is to be able to identify whether a process is useful, beneficial and relevant to the target community.
Generally, researchers are expected to own their respective processes including information emanating from their find-ings. However, undertaking a research initiative in a rural community brings a fairly amount of responsibility to the re-searchers given the lack of capacity in these communities to counter check research findings in their midst. This is criti-cal when the research findings are communicated to the ru-ral community at or during decision making forums as was the case with the SSI programme. This is an ethical issue in science that needs to be given more attention in this con-text, while at the same time communicating effectively on both complex and simple issues without raising false hopes or raising unnecessary alarms to the community. In most cases, the rural community will always attribute any devel-opment in their midst to the person (e.g. researcher, engineer
etc.) who brought the idea. Thus, in a rural community set-ting, it is the responsibility of the respective researchers to own to their processes and respective findings.
One question that one could ask is whether the SSI re-searchers had an alternative to the time consuming but useful process of engaging the local community and other stake-holders in establishing the catchment monitoring network and implementing the SSI programme at large. The an-swer to this question is a big “YES”. One of the obvious approaches could have been paying people for their services e.g. taking rainfall readings, guarding all the installations in the catchment etc. However, this process is not sustainable as has been proven in other research catchments in the region. Sustainability requires endurance of purpose while having a long-term objective as was the case in establishing the Pot-shini catchment monitoring network. The engaging with the local community and other stakeholders did not necessarily change too much on the design of the network but rather pro-vided an opportunity for ownership, learning and appreci-ation, to the researchers, local community and other stake-holders. There are cases in the region where catchment mon-itoring networks have been regarded as a “threat” by rural communities and hence vandalized. Unfortunately, the miss-ing link in such cases is information sharmiss-ing (between re-searchers and local communities) and appreciation of other people’s diversity, strengths and weaknesses.
2524 V. M. Kongo et al.: Establishment of a catchment monitoring network through a participatory approach
6 Conclusions
Catchment monitoring is fundamental to understanding the various hydrological processes in a catchment. Using this understanding, researchers formulate catchment responses which aid in water resources management. This paper high-lighted and underscored the importance of applying Partici-patory Research techniques in hydrological research studies where other stakeholders are involved. The feedback process where various stakeholders were updated on the research ac-tivities including visual interpretation of the data collected from the catchment monitoring network proved to be a useful tool in instilling a sense of ownership to the local community while the other stakeholders appreciated their contribution and participation in the SSI research programme, thus en-hancing sustainability of the catchment monitoring initiative in the community.
The experience drawn from establishing the catchment monitoring network in Potshini, a rural community in Bergville District in South Africa, has proved that there are more opportunities and gains (both material and ideas) to benefit from involving other stakeholders. In particular, the establishment of the goodwill of the local community in Potshini avoided, to a large extent, problems of vandal-ism or theft that have plagued several research catchments in South Africa and other parts of the world. The level and stage of participation of each stakeholder differs but ulti-mately contributes to the success of such a process. The Potshini catchment monitoring network had several perma-nent structures and instrumentation which continue to bene-fit researchers. The structures and instruments were installed in individual farms belonging to willing smallholder farmers in the Potshini community. A number of the farmers vol-unteered to monitor some of the hydrological processes and take readings accordingly. The traditional leadership in Pot-shini agreed to host and support the SSI research programme and the local elected leaders facilitated, to a great extent, the linking of the SSI researchers to the local municipality of-ficials while the extension personnel from the Agricultural statutory bodies and the ARC-Landcare project in Bergville played a key role in linking the SSI research programme with other similar projects and stakeholders in the Bergville dis-trict and beyond.
Additional data collection by community members can be of significant value in building an understanding of the bio-physical system by the community members involved. This does limit the control a researcher may have over the exper-iment, leading to a need for careful cross-referencing and quality control of data. However, this is outweighed by the immediate benefit of aligning the project with the socio-economic as well as biophysical conditions present within the community involved (Sturdy et al., 2008). The result is an experiment that community members understand and can explain to others, and that is suitable for local condi-tions. Thus, the participation of a local community in a
hydrological monitoring programme need not compromise the quality of the scientific endeavour nor the level of so-phistication of the instrumentation used. The participatory process of establishing the Potshini catchment monitoring network emerged as a positive impact on the local commu-nity and other stakeholders with regard to appreciating the re-search findings and above all, the ability to sustain the good-will of the local community in safeguarding the instruments and structures comprising the network.
Acknowledgements. The work reported here was undertaken as part of the Smallholder System Innovations in Integrated Watershed Management (SSI) Programme funded by the Netherlands Foun-dation for the Advancement of Tropical Research (WOTRO), the Swedish International Development Cooperation Agency (SIDA), the Netherlands Directorate-General of Development Coopera-tion (DGIS), the InternaCoopera-tional Water Management Institute (IWMI) and UNESCO-IHE Institute for Water Education and Stockholm University (SU). The authors are grateful to the Stockholm Environment Institute (SEI) for granting the lead author a research grant, through the Research Capacity Fund, towards accomplishing this paper. The authors are also grateful for the goodwill and support from the Potshini community, the District Department of Agriculture and Environment office in Bergville, Department of Water Affairs and Forestry in KwaZulu-Natal Province, the Okhal-hamba Municipality and the Agricultural Research Council of South Africa. Lastly, we are grateful to Stacey Noel of SEI-Africa Centre for proof-reading this manuscript.
Edited by: M. Sivapalan
References
Ackers, P., White, W. R., Perkins, J. A., and Harrison, A. J. M.: Weirs and flumes for flow Measurement, Wiley Interscience Pub-lication, USA, ISBN No 0 471 99637 8, 1978.
Andreas, E. L.: Two-wavelength method of measuring path-averaged turbulent surface heat fluxes, J. Atmos.c Ocean Tech., 6, 280–292, 1989.
Bastiaanssen, W. G. M.: SEBAL-Based Sensible and latent heat fluxes in the irrigated Gediz Basin, Turkey, J. Hydrol., 229, 87– 100, 2000.
Bastiaanssen, W. G. M., Menenti, M., Feddes, R. A., and Holtslag, A. A. M.: A remote sensing Surface Energy Balance Algorithm for Land (SEBAL), Part 1: Formulation, J. Hydrol., 212–213, 198–212, 1998a.
Bastiaanssen, W. G. M., Pelgrum, H., Wang, J., Ma, Y., Moreno, J., Roerink, G. J., and van der Wal, T.: The Surface Energy Bal-ance Algorithm for Land (SEBAL), Part 2: Validation, J. Hy-drol., 212–213, 213–229, 1998b.