E
E
evaluation
of
logistic
performance
indexes
of
brazil
in
the
international
trade
1ROSANE NUNES DE FARIA
Doutora em Economia pela Escola Superior de Agricultura “Luiz de Queiroz” da Universidade de São Paulo (Esalq-USP). Professora do Departamento de Economia do Centro de Ciências em Gestão e Tecnologia
da Universidade Federal de São Carlos (CCGT-UFSCar). Rodovia João Leme dos Santos, Km 110, Itinga, Sorocaba – SP – Brasil – CEP 18052-780 E-mail: [email protected]
CAIO SILVESTRE DE SOUZA
Graduado em Engenharia de Produção pelo Departamento de Engenharia de Produção do Centro de Ciências em Gestão e Tecnologia da Universidade Federal de São Carlos (CCGT-UFSCar). Rodovia João Leme dos Santos, Km 110, Itinga, Sorocaba – SP – Brasil – CEP 18052-780 E-mail: [email protected]
JOSÉ GERALDO VIDAL VIEIRA
Doutor em Engenharia de Produção pela Escola Politécnica da Universidade de São Paulo (USP). Professor do Departamento de Engenharia de Produção do Centro de Ciências em Gestão
e Tecnologia da Universidade Federal de São Carlos (CCGT-UFSCar). Rodovia João Leme dos Santos, Km 110, Itinga, Sorocaba – SP – Brasil – CEP 18052-780 E-mail: [email protected]
1 This research was financially supported by Fundação de Amparo à Pesquisa do Estado de São Paulo –
214
A B S T R A C T
215
K E Y W O R D S
International trade. Logistic performance indexes. Cluster analysis. Logistic. Customs clearance.
1
I N T R O D U C T I O N
International trade of goods has been moved by a network of increasingly global logistic operators that deal with a number of functions in the international supply chains: ocean shipping, air freight, land transport, warehousing, and third party logistics (Korinek & Sourdin, 2011; World Trade Organization, 2012). According to the World Bank (2010, 2012) the importance of efficient logis-tics for trade and growth is now widely acknowledged. Analysis has shown that better logistics performance is strongly associated with trade expansion, export diversification, ability to attract foreign direct investments, and economic growth. On the other hand, international trade represents a challenge to logistic opera-tions to transport and store products. The high logistic costs and low quality of ser-vices may be considered obstacles to international trade. According to Hummels and Schaur (2012) the lead time to delivery has been a barrier in the international trade. These findings are especially relevant for developing countries such as Brazil that needs to invest in logistics in order to emerge in a more competitive position in international trade (Faria, Souza, & Vieira, 2011).
Despite the importance of Brazil as one of the largest global economies, there has been a small participation of it in international trade. According to the International Monetary Fund (2012) the share of Brazil in the world export is 1.2%. Brazil stands out as the nineth global economy but it is on the twenty-second position on the exporters ranking.
Brazil presents inefficiency in quality infrastructure of warehouse, trans-port, use of information technology, management ability in planning, search and execution of the shipment handling and warehousing. In addition to this, there is a lack of logistic collaboration to provide more integration among the transac-tion process (Vieira, Yoshizaki, & Lee, 2009).
216
In order to get the benefits of the globalization process, countries might have to identify the key aspects of logistic performance, particularly in terms of its impact on competitiveness. The empirical literature has showed that a good transport infrastructure, institutional quality, low transportation costs and other logistic indexes in international business provide positive impacts on the export performance and trade facilitation (Limão & Venables, 2001; Levchenko, 2004; Djankov, Freund, & Pham, 2006; Portugal-Perez & Wilson, 2010).
The major purpose of this research is to use the logistics performance index (LPI) which has been produced by the World Bank to analyse the Brazilian logis-tics performance regarding to its main competitors in the international trade. The research questions of this paper are threefold:
• What are the main logistic areas in which Brazil has inefficiency comparing
with its competitors?
• What are the top logistics performers in the international market?
• And what are the most important logistic indexes to distinguish between high and low performers?
Therefore, the main contribution of this paper is to reveal logistical aspects in which Brazil has shown large inefficiencies. The difference among the logis-tic peformance indexes also appears to be relevant to governments in order to address their public policies, and also to highlight the logistic obstacles of Brazil.
The remainder of the paper is structured as follows. Section 2 presents the literature review. In section 3 we present the variables and statistical analyses which have been applied. Section 4 shows the main results and section 5 con-cludes the paper.
2
L I T E R AT U R E R E V I E W
2 . 1
L O G I S T I C S A S P E C T O N I N T E R N AT I O N A L T R A D E217
chart 1
LOGISTIC ASPECTS FOUND IN THE LITERATURE
LOGISTIC ASPECT DESCRIPTION AUTHORS
Infrastructure
It involves the entire transportation network for the physical movement of goods, telecommunications networks necessary to speed up the exchange of information, suitable structure of customs posts and other services to facilitate customs clearance, cargo terminals, disposal and storage to maintain quality product and agility of the process of moving the goods.
Wilson, Mann and Otsuki (2004), Portugal-Perez and Wilson (2010), Francois and Manchin (2007), Limão and Venables (2001) and Soloaga, Wilson and Mejía (2006)
Logistics competence
It involves the quality of services delivered by the private sector that include cargo storage services, transportation agencies, information technology services, packaging services, consultancy management.
Levchenko (2004) and Francois and Manchin (2007)
Domestic logistic costs
It can be divided into direct and induced costs. The first is a result of freight loads and other costs associated with shipments. The second is due to system failures which may result in fees, longer time of storage, need of transporting higher volumes after the deadline or payment of a more expensive transport.
Bougheas, Demetriades and Morgenroth (1999), Hummels (2001) and Hoekman and Nicita (2008)
Predictability and reliability of supply chain
Predictability is a central issue in logistic performance and its lack may be the
consequence of several other deficiencies such as poor information technology and obsolete transportation infrastructure. On the other hand, the lack of predictability might increase induced costs and may become trade barriers.
Nordas, Pinali and Grosso (2006), Persson (2007), Helble, Shepherd and Wilson (2007) and Djankov et al. (2006)
Source:Elaborated by the authors.
218
Levchenko (2004) has found that institutional differences across countries are an important determinant of trade patterns. However, when the institu-tions are endogenised to capture long-run effects, international trade leads to an improvement in institutional quality.
In general, the results of these studies have shown that is crucial to increase the countries logistics performance to expand international trade mainly for developing ones.
2 . 2
L O G I S T I C S P E R F O R M A N C E I N D E X O F W O R L D B A N KThe World Bank has been published the LPI every two years since 2007. The proposal is to identify the opportunities and logistic obstacles faced by the coun-tries in the international trade. Hence, LPI helps to understand the challenges of the countries that they and their trading partners face in making their national logistics perform stronger (World Bank, 2014). The World Bank LPI summari-zes the performance of countries on six dimensions or indexes which are cus-toms, infrastructure, international shipments, logistics quality and competence, tracking and tracing and timeliness (World Bank, 2007, 2010).
2 . 2 . 1
C u s t o m s i n d e xThe customs clearance procedures involve import and export agencies and different services at borders. These procedures represent on average one third of the time of import or export, and their efficiency depends on the managers of the agencies and the service providers involved in the process. According to the World Bank (2010) the customs index encompasses information such as: 1. if the cus-toms declarations are processed electronically and this process is clear and trans-parent, 2. if the information is complete and available on time due to changes in regulations, 3. if imports and exports occur according to schedule, 4. if the time between submission of the documentation in customs clearance is expensive, among others. In terms of transparency this index is crucial, especially regarding the customs clearance time and bribery (Souza & Burnquist, 2011). According to Cipolla (2013) the customs variables have the highest impact on the trade flow of Brazil and its main partners.
2 . 2 . 2
I n f r a s t r u c t u r e i n d e x219
(Keedi, 2007). Maintaining good conditions in these sectors is important to busi-ness processes due to the physical handling of goods and it implies an efficient exchange of information due to the link between the material and information flow. High quality infrastructure may contribute to improve the communication among the actors of a supply chain. A considerable challenge lies in responding to the increasing demand for physical structure especially in low income countries.
2 . 2 . 3
L o g i s t i c s q u a l i t y a n d c o m p e t e n c e i n d e xThe logistic service providers, typically the third party logistics (3PL) and carriers, are carried out by road, rail and air transport. These companies, cus-toms brokers and companies responsible for border procedures provide logistics services of high quality and they are urged to work together to fulfil the cus-tomer requirements with the highest logistics performance. According to the World Bank (2007) the countries with higher logistic performance present pri-vate sector well developed. On the order hand, countries with low performance have problems in both public and private sectors. Regardless of which group of countries has the best logistics performance, the lack of competition among companies may contribute to the corruption at border posts. The corruption may inhibit the emergence of new competitors which can work more effectively with international operations.
2 . 2 . 4
Ti m e l i n e s s i n d e xThe lack of timeliness and reliability in the trading system is central to the logistic performance, and they can restrict the trade through increasing costs and lowing competitiveness. Timeliness is also an important measurable com-ponent of quality (Hummels & Schaur, 2012). Delivery delays, lack of shipment, need for physical inspections, use of obsolete communication technology and transportation infrastructure in poor condition are crucial factors to determine timeliness index. According to the World Bank (2007) the difference in satisfac-tion among countries of high and low performance is higher for timeliness index compared to any other indexes. Data about thefts, bribes and fraud, percentage of physical inspection among others are used to compare countries.
2 . 2 . 5
Tr a c k i n g a n d t r a c i n g i n d e x220
key to competitiveness. This index stresses the quality of information technology in logistics processes, transparency of customs procedures and continuous inno-vation in communication technologies as the main factors to reach high level in cargo transportation system.
2 . 2 . 6
I n t e r n a t i o n a l s h i p m e n t s i n d e xThis index analyses the management of flow of goods regarding the ability to organize shipments efficiently in terms of deliveries and competitive costs (World Bank, 2010). Timeliness and flexibility are key aspects in this background because companies may benefit itself from changes in the trade environment when they are able to satisfy the customers and provide services at a reduced cost.
3
M E T H O D O L O G Y
In order to identify the main competitors of Brazil, we have to answer three questions:
• Who are the most important buyers (partners) of Brazil?
• Which are the main products that these countries (partners) buy from Brazil? • Which countries also sell these products to the partners of Brazil?
For the purpose of selecting the most important buyers of Brazil, we have adopted their participation in total exports from Brazil. We have included on the sample 20 countries whose participation was more than 1% in 2008. We have identified the top 5 products which have been bought by each partner from Brazil. The criterion to select the top 5 products was their importance for the total Brazilian exports and they held at least 50% in 2008. Finally, we have listed the 5 main countries that also export the top 5 products to the partners of Brazil and therefore they stand for the direct competitors.
To calculate the competition grade (CG) which measures the share of each k
competitor in the i Brazilian partner purchases of the 5 products j, we have used the following equation:
i = 1 20
CGk = Shareij
j = 1 5
(1)
221
The data about international trade have been obtained from Ministry of Development, Industry and Foreign Trade for Brazil (Secex) and from the United Nations Commodity Trade Statistics Data Base – UN Comtrade database) of the United Nations Statistics Division (Unsd). We have used the indexes values of LPI relating the year 2010 provided by the World Bank (2010) and additional variables provided by the World Bank (2007) to measure logistic performance. Chart 2 shows the indexes and variables and the measurement scale for each ones.
chart 2
DESCRIPTION OF VARIABLES USED
INDEXES DESCRIPTION CLASSIFICATION
Customs Efficiency of the clearance process by customs
and other border agencies
5 – point scale 1 (worst) and 5 (best) performance
Infrastructure Quality of transport and information technology
infrastructure for logistics
Logistics quality and
competence Competence of the local logistics industry
Tracking and tracing Ability to track and trace international shipments
Timeliness Timeliness of shipments in reaching destination
International shipments Ease and affordability of arranging international
shipments
OTHER VARIABLES QUANTITATIVE
Export agencies Number of export agencies at the border Number
Import agencies Number of import agencies at the border Number
Physical inspection Physical inspection of shipments imported Percentage
Multiple inspection Multiple inspection of the shipments physically
inspected Percentage
Export documents Documents required to allow exports
(customs procedures) Number
Import documents Documents required to allow imports
(customs procedures) Number
222
INDEXES DESCRIPTION CLASSIFICATION
Customs clearance with
inspection Customs clearance time with physical inspection Days
Customs clearance without inspection
Customs clearance time without physical
inspection Days
Source: World Bank (2007, 2010).
We have applied cluster analysis to verify the ranking of Brazil in relation to its main international trade competitors. The aim is to set up groups of homoge-neous countries related to its logistic performance. Therefore, it has been asses-sed whether the means of indexes are statistically different among the clusters using one-way analysis of variance and Turkey’s HSD tests.
4
R E S U LT S
4 . 1
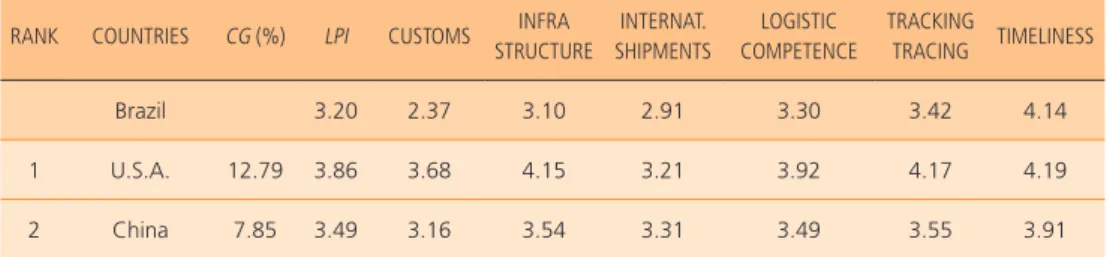
C O M PA R AT I V E R A N K O F B R A Z I L T O I T S C O M P E T I T O R SBased on the criteria described in the methodology we have selected 39 major competitors of Brazil which are also important players in international trade. These countries together held 81.45% of total world exports in 2008. Table 1 presents the scores (5 – point scale) of the six indicators and of LPI for the 39 countries which have been ranked according to its CG.
table 1
MAIN COMPETITORS OF BRAZIL WITH INDEXES AND LPI SCORES
RANK COUNTRIES CG (%) LPI CUSTOMS INFRA
STRUCTURE
INTERNAT. SHIPMENTS
LOGISTIC COMPETENCE
TRACKING
TRACING TIMELINESS
Brazil 3.20 2.37 3.10 2.91 3.30 3.42 4.14
1 U.S.A. 12.79 3.86 3.68 4.15 3.21 3.92 4.17 4.19
2 China 7.85 3.49 3.16 3.54 3.31 3.49 3.55 3.91
chart 2 (conclusion)
DESCRIPTION OF VARIABLES USED
223
RANK COUNTRIES CG (%) LPI CUSTOMS INFRA
STRUCTURE
INTERNAT. SHIPMENTS
LOGISTIC COMPETENCE
TRACKING
TRACING TIMELINESS
3 Germany 3.87 4.11 4.00 4.34 3.66 4.14 4.18 4.48
4 Japan 2.97 3.97 3.79 4.19 3.55 4.00 4.13 4.26
5 Canada 2.73 3.87 3.71 4.03 3.24 3.99 4.01 4.41
6 France 2.67 3.84 3.63 4.00 3.30 3.87 4.01 4.37
7 Australia 2.19 3.84 3.68 3.78 3.78 3.77 3.87 4.16
8 Argentina 1.95 3.1 2.63 2.75 3.15 3.03 3.15 3.82
9 Korea,
Republic of 1.85 3.64 3.33 3.62 3.47 3.64 3.83 3.97
10 Colombia 1.48 2.77 2.50 2.59 2.54 2.75 2.75 3.52
11 Netherlands 1.41 4.07 3.98 4.25 3.61 4.15 4.12 4.41
12 Mexico 1.36 3.05 2.55 2.95 2.83 3.04 3.28 3.66
13 Belgium 1.03 3.94 3.83 4.01 3.31 4.13 4.22 4.29
14 South Africa 0.95 3.46 3.22 3.42 3.26 3.59 3.73 3.57
15 India 0.95 3.12 2.7 2.91 3.13 3.16 3.14 3.61
16 Italy 0.94 3.64 3.38 3.72 3.21 3.74 3.83 4.08
17 Russia 0.88 2.61 2.15 2.38 2.72 2.51 2.60 3.23
18 Indonesia 0.79 2.76 2.43 2.54 2.82 2.47 2.77 3.46
19 Chile 0.79 3.09 2.93 2.86 2.74 2.94 3.33 3.80
20 United
Kingdom 0.66 3.95 3.74 3.95 3.66 3.92 4.13 4.37
21 Venezuela 0.65 2.68 2.06 2.44 3.05 2.53 2.84 3.05
22 Vietnam 0.61 2.96 2.68 2.56 3.04 2.89 3.1 3.44
23 Malaysia 0.61 3.44 3.11 3.50 3.50 3.34 3.32 3.86
24 Kuwait 0.61 3.28 3.03 3.33 3.12 3.11 3.44 3.70
table 1 (continuation)
MAIN COMPETITORS OF BRAZIL WITH INDICATORS AND LPI SCORES
224
RANK COUNTRIES CG (%) LPI CUSTOMS INFRA
STRUCTURE
INTERNAT. SHIPMENTS
LOGISTIC COMPETENCE
TRACKING
TRACING TIMELINESS
25 Thailand 0.58 3.29 3.02 3.16 3.27 3.16 3.41 3.73
26 Spain 0.57 3.63 3.47 3.58 3.11 3.62 3.96 4.12
27 Peru 0.51 2.80 2.50 2.66 2.75 2.61 2.89 3.38
28 Saudi Arabia 0.49 3.22 2.91 3.27 2.8 3.33 3.32 3.78
29 New Zealand 0.37 3.65 3.64 3.54 3.36 3.54 3.67 4.17
30 Sweden 0.32 4.08 3.88 4.03 3.83 4.22 4.22 4.32
31 Ukraine 0.32 2.57 2.02 2.44 2.79 2.59 2.49 3.06
32 Guatemala 0.29 2.63 2.33 2.37 2.16 2.74 2.71 3.52
33 Switzerland 0.25 3.97 3.73 4.17 3.32 4.32 4.27 4.20
34 Honduras 0.23 2.78 2.39 2.31 2.67 2.57 2.83 3.83
35 Angola 0.23 2.25 1.75 1.69 2.38 2.02 2.54 3.01
36 Turkey 0.20 3.22 2.82 3.08 3.15 3.23 3.09 3.94
37 Denmark 0.20 3.85 3.58 3.99 3.46 3.83 3.94 4.38
38 Poland 0.20 3.44 3.12 2.98 3.22 3.26 3.45 4.52
39 Portugal 0.20 3.34 3.31 3.17 3.02 3.31 3.38 3.84
Source: Elaborated by the authors using data from Secex, Comtrade and World Bank (2010).
The United States has presented as the most important competitor of Brazil followed by China, Germany and Japan. It might be observed that among 15 top competitors of Brazil in international trade there have been countries that stand out as the best logistic performers such as Germany, Japan, Netherlands and Belgium. In general, these major competitors have been presented LPI higher than Brazil that has overcome only Argentina, Colombia, Mexico and India. High logistic performance might increase the export competitiveness from these countries and Brazil might lose business in international market.
Considering the six performance indexes, we might state that Brazil has pre-sented a relatively good timeliness index overcoming countries like China, Italy
table 1 (conclusion)
225
and Argentina. On the other hand, the results for customs show lower perfor-mance compared to its main competitors. From this logistic aspect Brazil has only overcome Russia, Venezuela, Ukraine, Guatemala and Angola. This low performance may be explained by excessive bureaucracy such as the high num-ber of documents required by many different agencies of import and export. Moreover the other indexes with lower performance are international shipments and infrastructure.
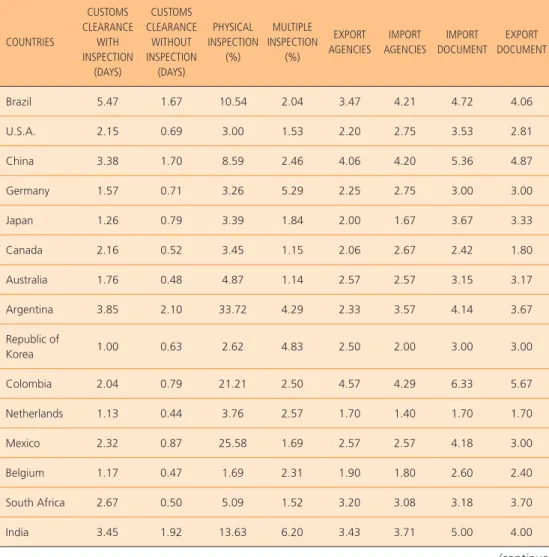
Table 2 presents the variables of customs index of which Brazil has shown serious deficiencies.
table 2
VARIABLES ACCORDING TO THE WORLD BANK
COUNTRIES
CUSTOMS CLEARANCE
WITH INSPECTION
(DAYS)
CUSTOMS CLEARANCE
WITHOUT INSPECTION
(DAYS)
PHYSICAL INSPECTION
(%)
MULTIPLE INSPECTION
(%)
EXPORT AGENCIES
IMPORT AGENCIES
IMPORT DOCUMENT
EXPORT DOCUMENT
Brazil 5.47 1.67 10.54 2.04 3.47 4.21 4.72 4.06
U.S.A. 2.15 0.69 3.00 1.53 2.20 2.75 3.53 2.81
China 3.38 1.70 8.59 2.46 4.06 4.20 5.36 4.87
Germany 1.57 0.71 3.26 5.29 2.25 2.75 3.00 3.00
Japan 1.26 0.79 3.39 1.84 2.00 1.67 3.67 3.33
Canada 2.16 0.52 3.45 1.15 2.06 2.67 2.42 1.80
Australia 1.76 0.48 4.87 1.14 2.57 2.57 3.15 3.17
Argentina 3.85 2.10 33.72 4.29 2.33 3.57 4.14 3.67
Republic of
Korea 1.00 0.63 2.62 4.83 2.50 2.00 3.00 3.00
Colombia 2.04 0.79 21.21 2.50 4.57 4.29 6.33 5.67
Netherlands 1.13 0.44 3.76 2.57 1.70 1.40 1.70 1.70
Mexico 2.32 0.87 25.58 1.69 2.57 2.57 4.18 3.00
Belgium 1.17 0.47 1.69 2.31 1.90 1.80 2.60 2.40
South Africa 2.67 0.50 5.09 1.52 3.20 3.08 3.18 3.70
India 3.45 1.92 13.63 6.20 3.43 3.71 5.00 4.00
226
COUNTRIES
CUSTOMS CLEARANCE
WITH INSPECTION
(DAYS)
CUSTOMS CLEARANCE
WITHOUT INSPECTION
(DAYS)
PHYSICAL INSPECTION
(%)
MULTIPLE INSPECTION
(%)
EXPORT AGENCIES
IMPORT AGENCIES
IMPORT DOCUMENT
EXPORT DOCUMENT
Italy 2.35 0.86 5.13 1.55 1.31 1.36 2.60 2.40
Russia 4.62 2.57 44.2 10.05 5.83 5.17 8.40 9.00
Indonesia 5.12 2.14 11.08 2.56 2.50 3.67 5.00 3.50
Chile 1.32 0.50 1.99 4.44 2.60 2.00 3.20 3.60
United
Kingdom 2.05 0.87 1.58 1.73 2.40 2.20 4.80 3.80
Venezuela 12.81 6.30 39.42 1.84 4.67 4.00 6.00 5.00
Vietnam 3.46 1.41 41.83 4.24 3.00 5.50 6.50 5.50
Malaysia 2.08 0.74 6.47 3.43 2.86 3.00 3.17 2.67
Kuwait 3.00 2.00 75.0 18.0 6.00 6.00 11.0 7.00
Thailand 1.41 0.71 8.66 1.26 1.75 2.25 3.33 2.67
Spain 2.83 0.50 4.24 1.00 3.00 3.00 2.67 2.33
Peru 3.65 1.74 12.45 5.19 2.00 1.83 4.80 4.00
Saudi Arabia 7.61 3.98 65.52 3.39 3.50 3.00 5.50 6.22
New Zealand 1.26 0.50 1.84 1.00 2.67 2.67 3.33 3.33
Ukraine 2.52 1.26 50.82 7.77 5.00 6.33 7.33 6.00
Guatemala 2.34 1.25 32.65 6.31 3.63 3.25 4.38 4.25
Switzerland 0.40 0.31 1.99 1.36 1.00 1.00 2.00 2.00
Angola 7.00 3.00 2.50 1.00 2.00 3.00 4.00 3.00
Turkey 3.06 1.36 15.96 5.75 3.11 3.44 5.67 4.00
Denmark 1.41 0.50 1.58 1.00 1.50 2.00 3.00 2.00
Poland 1.42 0.79 4.83 2.54 1.44 2.56 3.78 2.44
Source: Elaborated by the authors according to the World Bank (2007).
table 2 (conclusion)
227
In terms of customs clearance with or without physical inspection it may be observed from Table 2 that Brazil has presented the fourth largest time of customs clearance with physical inspection (5.47 days) and the eleventh, without physical one (1.67 days). The longer the customs clearance, the longer the time for importing or exporting. When there is physical inspection it has been obser-ved that the examination may delay 3.40 days. This difference might be influen-ced by political obstacles such as bureaucracy, corruption, etc.
Regarding the number of export and import agencies, Brazil has been ranked on the nineth position for export ones and on the sixth, for import agencies. Fur-thermore, among the main competitors there might be two or three documents to allow the import and the export while in Brazil the amount might be 4.72 and 4.06 respectively.
4 . 2
L O G I S T I C P E R F O R M A N C E F O R G R O U P S O F C O U N T R I E SWe have used three hierarchical clustering algorithms (Complete Linkage, Centroid and Ward) and we have observed similar results (based on dendro-grams) whatever the algorithm is. Chart 3 presents the three clusters with their respectively countries.
chart 3
MAIN COMPETITORS OF BRAZIL BY CLUSTERS
CLUSTER COUNTRIES
Cluster 1 Australia, Belgium, Canada, Denmark, France, Germany, Netherlands, Italy, Japan,
Korea, Republic of New Zealand, Switzerland, Spain, United Kingdom and U.S.A.
Cluster 2 Argentina, Brazil, China, Chile, India, Malaysia, Mexico, Poland, Portugal, Thailand, Kuwait, Turkey, Saudi Arabia, South Africa and Vietnam.
Cluster 3 Colombia, Guatemala, Honduras, Indonesia, Peru, Russia, Ukraine and Venezuela.
Source: Elaborated by the authors using LPI indexes.
228
Latin America, Asia, Oceania and Africa. The large emerging economies such as China, India, South Africa and Brazil are inserted in this group. Finally, Cluster 3 which was named low logistics performance group (LLPG) consists of relatively poor countries with less economic importance such as Honduras and Guate-mala. The exception is Russia, which despite being an emerging country was not grouped in the same cluster of countries that form Brics.
Table 3 presents the mean of six indexes for each cluster. It may be noted that cluster 1 (HLPG) presents higher means for all indexes which shows the superiority of these countries in all logistic aspects.
table 3
MEANS OF INDEXES FOR EACH CLUSTER
INDEXES CLUSTER 1
HLPG
CLUSTER 2 MLPG
CLUSTER 3 LLPG
GLOBAL MEAN
Customs 3,690 2,904 2,297 3,068
Infrastructure 3,959 3,105 2,466 3,283
International shipments 3,442 3,096 2,687 3,135
Logistics quality competence 3,925 3,212 2,596 3,344
Tracking and tracing 4,035 3,340 2,735 3,477
Timeliness 4,261 3,821 3,381 3,889
Source: Elaborated by the authors using LPI indexes.
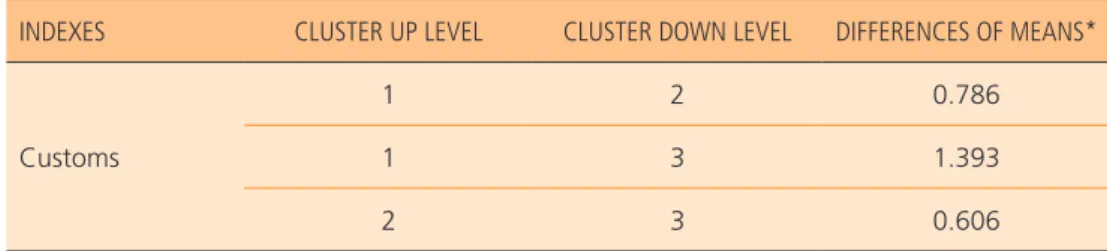
Table 4 presents the results of multiple comparison of means among the clusters to examine whether the means are statistically different.
table 4
MULTIPLE COMPARISON OF MEANS – TURKEY’S HSD
INDEXES CLUSTER UP LEVEL CLUSTER DOWN LEVEL DIFFERENCES OF MEANS*
Customs
1 2 0.786
1 3 1.393
2 3 0.606
229
INDEXES CLUSTER UP LEVEL CLUSTER DOWN LEVEL DIFFERENCES OF MEANS*
Infrastructure
1 2 0.854
1 3 1.493
2 3 0.639
International shipments
1 2 0.345
1 3 0.755
2 3 0.409
Logistic quality competence
1 2 0.713
1 3 1.328
2 3 0.615
Tracking and tracing
1 2 0.694
1 3 1.300
2 3 0.605
Timeliness
1 2 0.439
1 3 0.880
2 3 0.440
*Significance at 1%.
Source: Elaborated by the authors using LPI indexes.
It might be inferred from Table 4 that the most important indexes that dis-tinguish among higher and lower performers are infrastructure, customs and logistic quality competence which are the indexes that have presented the highest difference of means among the clusters. Figure 1 presents the values of the six indexes for each cluster in radar chart.
table 4 (conclusion)
230
figure 1
RADAR CHART OF LOGISTIC INDEXES BY CLUSTERS
Source: Elaborated by the authors using LPI indexes.
Comparing Brazil with the three clusters it may be noticed that the Timeli-ness is very close to the HLPG while customs is very close to LLPG. The remain-der indexes presented a compatible performance with the MLPG. This results highlights customs index as a key logistic aspect in which Brazil should consis-tently invest in reforms and improvements.
5
C O N C L U S I O N S
Using LPI index for the 39 competitors it has been observed that Brazil is in 26th rank of performers behind South Africa, Kuwait and Saudi Arabia. The top performers are in general the leading exporters and importers worldwide (Ger-many, U.S.A., Japan and the Netherlands). Furthermore, they are the strongest competitors of Brazil in international trade. Thus, the competitiveness of Bra-zilian domestic firms depends crucially on a dynamic and competitive internal logistic environment in order to face these countries.
The customs clearance process stands out as the most inefficient Brazilian logistic aspect. A detailed investigation on this index have evidenced that the greatest obstacles are bureaucratic issues such as customs clearance time with physical inspection, high number of agencies to import and export and high number of documents required to allow the import and export. Besides, Brazil
Infrastructure Customs
Timeliness
Tracking and Tracing
Logistic quality competence
International shipments
HLPG
MLPG
LLPG
Brazil 5
4
3
2
1
231
showed not sufficient performance in international shipment and infrastructure aspects. On the other hand Brazil presented a relative good timeliness perfor-mance. This might reveal that despite its inefficient customs procedures and infrastructure there seems to be a high level of reliability in Brazilian transac-tions which might be explained by the possibility of Brazilian trading partners have already incorporated extra time for possible delays in their expectations.
The cluster analysis has shown that Brazil has not reached its main competi-tors yet such as U.S.A, Germany, Japan and Canada. Furthermore when Brazil is compared with the countries in its own clusters it may be observed that the Brazil has been ranked bellow competitors such as China, India, Mexico and Chile.
Moreover, multiple comparisons of means among clusters have revealed that customs and infrastructure are key indexes which distinguish from high to LLPG and these are areas where Brazil has shown large inefficiencies.
In terms of public policies, the results reveal that is important to reduce the bureaucracy and to improve infrastructure on logistics activities. Hence in order to overcome the logistic obstacles of Brazil, there needs to be investment in projects which become less bureaucratic and more efficient customs procedures inasmuch as they might improve port, rail and road infrastructures.
The reform of the customs aspects implies less initial investment and short--term benefits. Therefore, a strategy that might improve logistic performance of Brazil would be to focus upon reforms since initial infrastructure investments are large and the benefits are usually long-term. Only the investment in infras-tructure might not ensure the logistic performance improvements which enable us to conclude that even though these investments are necessary, they might not be sufficient.
AVALIAÇÃO DE INDICADORES DE DESEMPENHO
LOGÍSTICO DO BRASIL NO COMÉRCIO
INTERNACIONAL
R E S U M O
232
podem ser considerados obstáculos ao comércio internacional. Esta pesquisa tem por objetivo avaliar os indicadores de desempenho logístico do Brasil em relação aos seus principais concorrentes no comércio internacional. As fontes de dados de comércio internacional para esta pesquisa foram a Secex e Comtrade, e os indicadores de desempenho logístico foram coletados na base de dados do Banco Mundial. Técnicas estatísticas tais como análise de cluster e testes de compara-ções múltiplas de médias foram usadas para analisar indicadores de desempenho logístico. Quando se usaram os indicadores para 39 concorrentes, observou-se que o Brasil está na 26ª posição, atrás da África do Sul, do Kuwait e da Arábia Sau-dita. Os melhores desempenhos são, em geral, dos principais países exportadores e importadores mundiais (Alemanha, Estados Unidos, Japão e Países Baixos). Além disso, eles são os principais concorrentes do Brasil no comércio internacio-nal. Assim, a competitividade das empresas nacionais brasileiras depende fun-damentalmente de um ambiente logístico interno dinâmico e competitivo para enfrentar esses países. Os resultados também indicam a “burocracia” como o principal obstáculo para o desempenho logístico do país. A dimensão “pontuali-dade do Brasil” é muito próxima do grupo de alto desempenho logístico, enquanto “alfândega” está muito próxima do grupo de baixo desempenho logístico. Apesar de o Brasil apresentar lentidão em suas operações aduaneiras, parece haver ainda credibilidade nas relações de comércio internacional. A principal contribuição deste trabalho é revelar aspectos logísticos em que o Brasil tem mostrado grandes ineficiências. A diferença entre os indicadores de desempenho logístico também parece ser relevante para os governos, pois pode indicar novas políticas públicas e também destacar os obstáculos logísticos do Brasil no comércio internacional.
PA L AV R A S - C H AV E
Comércio internacional. Indicador de desempenho logístico. Análise de agrupa-mento. Logística. Procedimentos alfandegários.
EVALUACIÓN DE INDICADORES DE DESEMPEÑO
LOGÍSTICO DE BRASIL EN EL COMERCIO
INTERNACIONAL
R E S U M E N
233
de las exportaciones, la capacidad de atraer inversión extranjera directa y al creci-miento económico. Por otra parte, el comercio internacional representa un desafío para las operaciones logísticas relacionadas al transporte y almacenamiento de pro-ductos. Los altos costos logísticos y la baja calidad de los servicios pueden ser con-siderados obstáculos para el comercio internacional. Esta investigación tiene como objetivo evaluar los indicadores de desempeño logístico de Brasil en relación con sus principales competidores en el comercio internacional. Las fuentes de datos de comercio internacional para este estudio fueron Secex y Comtrade, y los indi-cadores de desempeño logístico fueron recolectados en la base de datos del Banco Mundial. Se utilizaron técnicas estadísticas como el análisis de clúster y pruebas de comparaciones de múltiples medios para analizar los indicadores de desempeño logístico. Al utilizar los indicadores para 39 competidores, se observó que Brasil está en la posición 26 después de Sudáfrica, Kuwait y Arabia Saudita. Los mejores desempeños son, en general, de los principales países exportadores e importado-res mundiales (Alemania, Estados Unidos, Japón y los Países Bajos). Además, son los principales competidores de Brasil en el comercio internacional. Por lo tanto, la competitividad de las empresas nacionales brasileñas depende fundamentalmente de un ambiente logístico interno dinámico y competitivo para enfrentar a estos países. Los resultados también señalan a la “burocracia” como el principal obstá-culo para el desempeño logístico del país. La dimensión “puntualidad de Brasil” es muy cercana a la del grupo de alto desempeño logístico, mientras que “aduana” es más cercana a la del grupo de desempeño logístico bajo. Aunque Brasil presente lentitud en sus operaciones aduaneras, parece que todavía existe credibilidad en las relaciones de comercio internacional. La principal contribución de este trabajo es revelar aspectos logísticos en los que Brasil ha mostrado grandes ineficiencias. La diferencia entre los indicadores de desempeño logístico también parece ser rele-vante para los gobiernos, pues pueden indicar nuevas políticas públicas, y también poner de relieve los obstáculos logísticos de Brasil en el comercio internacional.
PA L A B R A S C L AV E
Comercio internacional. Indicador de desempeño logístico. Análisis de conglo-merado. Logística. Procedimientos aduaneros.
R E F E R E N C E S
Bougheas, S., Demetriades, P., & Morgenroth, E. (1999). Infrastructure, transport costs and trade.
Journal of International Economics, 47, 169-189.
Cipolla, C. (2013). Impactos da logística sobre o fluxo de comércio internacional: uma abordagem do
234
Djankov, S., Freund, C., & Pham, C. S. (2006, May). Trading on time [Working Paper Nº 3909].
The World Bank Policy Research Working Paper, Washington, D.C., 39.
Faria, R. N., Souza C. S., & Vieira, J. G. V. (2011). Evaluation of logistic performance indicators of
Brazil in the international trade. Exploring Interfaces. Proceedings of International Annual EurOMA
Conference, Cambridge, UK, 18.
Francois, J., & Manchin, M. (2007). Institutions, infrastructure, and trade [Working Paper Nº 4152]. World Bank, Washington, D.C.
Harrington, L. H. (2003). Trading blocks.Logistics Today, 44(10), 32-36.
Helble, M., Shepherd, B., & Wilson, J. S. (2007). Transparency and trade facilitation in the Asia
Pacific: estimating the gains from reform.Washington, DC: World Bank Development Research Group. Retrieved May 16, 2011, from http http://www.worldbank.org.
Hoekman, B., & Nicita, A. (2008). Trade policy, trade costs, and developing country trade [Working
Paper Nº 4797]. World Bank, Washington, D.C.
Hummels, D. (2001). Time as trade barrier [Working Paper Nº 1152]. Purdue University. West Lafayette, Indiana.
Hummels, D., & Schaur, G. (2012, January). Time as a trade barrier [Working Paper Nº 17758].
National Bureau of Economic Research. Retrieved May 23, 2011, from http://www.nber.org/papers/ w17758.pdf.
International Monetary Fund (2012, October). International Monetary Fund data and statistics.
Retrieved May 1, 2011, from http://www.imf.org/external/data.htm.
Keedi, S. (2007). Logística, transporte, comércio exterior e economia em conta-gotas. São Paulo: Aduaneiras. Korinek, J., & Sourdin, P. (2011, Feb.). To what extent are hight-quality logistics services trade
facili-tating? [Working Paper Nº 108]. OECD Trade Policy. Paris, France.
Levchenko, A. (2004). Institutional quality and international trade [Working Paper Nº04/231].
International Monetary Fund. Washington, D.C.
Limão, N., & Venables, A. J. (2001). Infrastructure, geographical disadvantage, transport costs and
trade. The World Bank Economic Review, 15(3), 451-479.
Mirza, T. (2008, March). Analyzing the effects of trade facilitation on international trade using a simultaneous approach [Working Paper]. Retrieved May 16, 2011, from http:// www.gtap.agecon. purdue.edu/resources/download/4610.pdf.
Nordas, H. K., Pinali, E., & Grosso, M. G. (2006). Logistics and time as a trade barrier [Working
Paper Nº 35]. OECD Trade Policy. Paris, France.
Persson, M. (2007). Trade facilitation and the EU-ACP economic partnership agreements: who has
the most to gain? Proceedings of the GTAP Conference, Purdue University, 42. West Lafayette, Indiana.
Portugal-Perez, A., & Wilson, J. S. (2010). Export performance and trade facilitation reform: hard
and soft infrastructure [Working Paper Nº 5261]. World Bank Policy Research. Washington, D.C.
Soloaga, I., Wilson, J. S., & Mejía, A. (2006). Moving forward faster: trade facilitation reform and
mexican competitiveness [Working Paper Nº 3953]. World Bank, Washington, D.C.
Souza, M. J. P., & Burnquist, H. L. (2011). Impactos da facilitação de comércio: evidências do
modelo gravitacional. Revista de Economia e Sociologia Rural, 49(4), 909-939.
Vieira, J. G. V., Yoshizaki, H. T. Y., & Lee, L. H. (2009). Collaboration intensity in the Brazilian
235 Wilson, J. S., Mann, C. L., & Otsuki, T. (2004). Assessing the potential benefit of trade facilitation:
a global perspective [Working Paper Nº 3224]. World Bank, Washington, D.C.
World Bank (2007, May). Connecting to compete: trade logistics in the global economy. Retrieved
January 31, 2011, from http://siteresources.worldbank.org/INTTLF/Resources/lpireport.pdf.
World Bank (2010, June). Connecting to compete: trade logistics in the global economy 2010. Retrieved
March 3, 2011, from http://siteresources.worldbank.org/INTTLF/Resources/LPI2010_for_web.pdf.
World Bank (2012, June). Connecting to compete: trade logistics in the global economy. Retrieved March 5,
2013, from http://siteresources.worldbank.org/TRADE/Resources/239070-1336654966193/ LPI_2012_final.pdf.
World Trade Organization (2012, June). Trade facilitation. Retrieved December 29, 2012, from