www.scielo.br/eq
Volume 34, número 3, 2009
Comparison of Potassium and Sodium Content in Diet and
Non-Diet Soft Drinks by Using Capillary Electrophoresis with
Capacitively Coupled Contactless Conductivity Detection
Ivanilce Cristina Guimarães, José Alberto Fracassi da Silva, and Dosil Pereira de Jesus*
Institute of Chemistry, University of Campinas – UNICAMP, 13083-970, Campinas, SP, Brazil. Instituto Nacional de Ciência e Tecnologia em Bioanalítica, Campinas, SP, Brazil.
*Corresponding Author: Prof. Dr. Dosil Pereira de Jesus - Grupo de Eletroforese e Microssistemas de Análise Instituto de Química, Universidade Estadual de Campinas - P.O. Box 6154, 13083-970 Campinas, SP, Brazil
Fax: +55 (19) 3521-3023 - E-mail: [email protected]
Abstract: Capillary electrophoresis (CE) with capacitively coupled contactless conductivity detection (C4D) was used for determination of sodium and potassium concentrations in diet and
non-diet soft drinks. Higher sodium concentrations were found in the diet samples due to the utilization of sodium salts of cyclamate and saccharine as sweeteners. The CE-C4D method can
be used by food industries and health regulatory agencies for monitoring sodium and potassium content, not only in soft drink but in many others food products.
Keywords: capillary electrophoresis, capacitively coupled contactless conductivity detection, soft drinks, sodium, potassium
Introduction
Sodium and potassium concentrations in foods are important nutritional information es-pecially for people suffering from arterial hyper-tension since high sodium intake leads to blood pressure increase, stroke, heart attack, and others diseases [1]. On the other hand, potassium is also involved in the control of many human physiolo-gical processes, such as arterial pressure and uri-nary calcium excretion [2]. Therefore monitoring potassium and sodium content in foods is always required by industries and health regulatory agen-cies.
Diet soft drinks consumption has drama-tically increased since the last decade, not only among people that suffer from diabetes, but par-ticularly by those that follow low calories diet in
a combination of artiicial sweeteners (cyclamate, saccharine, acesulfame, and aspartame) instead of carbohydrates, such as glucose and sucrose [3]. However some of these sweeteners are usually added as sodium salts (cyclamate and sacchari-ne) what makes diet soft drinks richer in sodium than ordinary soft drinks. On the other hand, diet soft drinks sweetened with acesulfame generally present a higher concentration of potassium than the non-diet version, since acesulfame potassium salts are usually used. Aspartame addition does not contribute to increase neither potassium nor sodium concentration since this peptide is added as a non-salt-type.
separate analytes in a short time with good reso-lution and small sample consumption (nL). The coupling of CE and C4D is more suitable for small
ions detection than the usually indirect UV-vis de-tection method. Although utilization of C4D [6-7]
is relatively recent it has been applied for deter-mination of several cations, anions [8-9], sugars [10], amines [11] and biomolecules [12] in diffe-rent kinds of samples. Here we use the CE-C4D
for comparing potassium and sodium concentra-tions in diet and normal soft drink.
Experimental
Reagents and Solutions
Analytical grade lactic acid (Lac), L-his-tidine (His), KCl, NaCl, and LiCl were used as received (Fluka, Bucks, Switzerland). Deionized water (Nanopure UV system-Barnstead, Dubu-que, IA, USA) was used for solutions preparation. A 20 mmol L-1 His/Lac buffer at pH 5.0 was used
as background electrolyte (BGE). Stock solutions (100 mmol L-1) of the K+, Na+, and Li+ were
pre-pared by dissolving the solids in deionized water. Standard solutions were prepared by dilution of the stock solutions as required.
Sample Preparation
Three different commercial, non-diet and diet, soft drinks were acquired at local market. Two of the samples were guarana-lavoured soft drinks (samples A and B) and another one was a cola soft drink (sample C). The samples were degassed with ultrasonic bath during 10 min and diluted with deionized water as required. Lithium was introduced (100 µmol/L in the samples) as in -ternal standard.
CE Separation
A commercial Waters CE system with adap-ted C4D was used for the analysis. The control and
data acquisition was carried out with a computer interfaced to the equipment. A 50 cm long bare fused-silica capillary with internal diameter of 75 µm was used. The effective separation length was 40 cm, i.e. detector was placed at 10 cm from the capillary end. The detector was operated at 560 kHz and 2 V peak amplitude. The separation vol-tage was 25 kV.
Results and Discussion
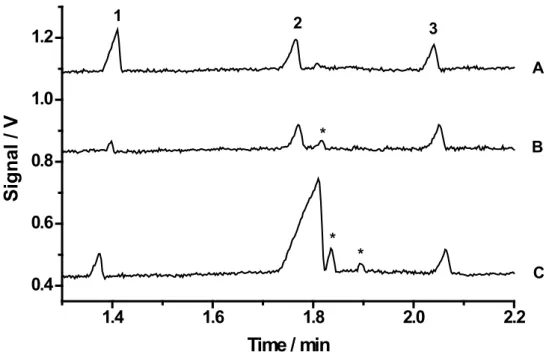
Figure 1 shows electropherograms for se-paration of K+, Na+ and Li+ (internal standard) in
Article
fused-non-fused-Figure 1
1.4
1.6
1.8
2.0
2.2
0.4
0.6
0.8
1.0
1.2
* *
*
3 2
A 1
B
C
Signal / V
Time / min
Figure 1. Electropherograms: (A) Standard solution containing 100 µmol L-1 of (1) potassium, (2) sodium,
and (3) lithium (internal standard); (B) non-diet and (C) diet soft drinks diluted 10-fold with deionized water. Running buffer: 20 mmol L-1 His/ Lac. Separation voltage 25 kV; gravity injection at 100 mm for 30 s; fused-silica capillary with 75 µm inner diameter and 50 cm long (40 cm effective); (*) not identiied peaks.
Table 1 shows the main analytical characteristics of the CE method.
Analytes LOD
a
(mg L-1)
LODa
(mol L-1)
LOQb
(mg L-1)
LOQb
(mol L-1)
Sensitivity
(V min mol-1 L) R 2c
K+ 0.13 3.26 x 10⁻⁶ 0.43 1.08 x 10⁻⁵ 0.25 0.996
Na+ 0.13 5.57 x 10⁻⁶ 0.43 1.86 x 10⁻⁵ 0.19 0.993
Limit of Quantiication for SNR = 10; Regression coeficient (concentration
a Limit of Detection for SNR = 3; b Limit of Quantiication for SNR = 10; c Regression coeficient
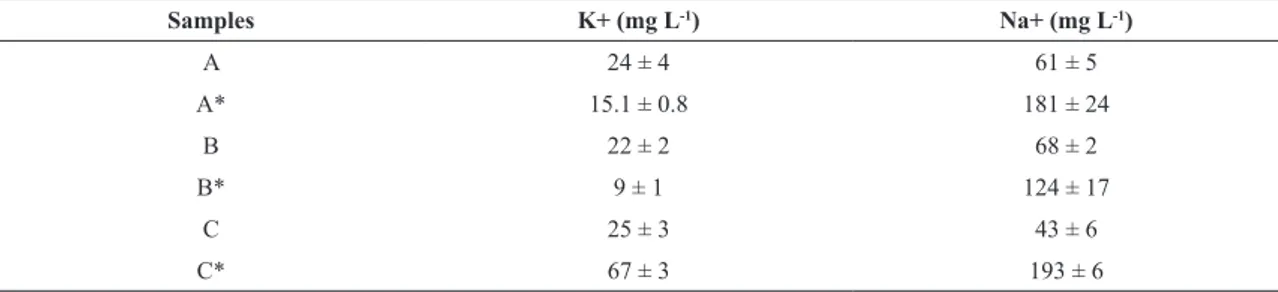
Table 2 shows the results for potassium and sodium determination in the soft drink samples.
Table 2. Concentrations of K+ and Na+ in the evaluated soft drinks
Limit of Quantiication for SNR = 10; Regression coeficient (concentration
Samples K+ (mg L-1) Na+ (mg L-1)
A 24 ± 4 61 ± 5
A* 15.1 ± 0.8 181 ± 24
B 22 ± 2 68 ± 2
B* 9 ± 1 124 ± 17
C 25 ± 3 43 ± 6
C* 67 ± 3 193 ± 6
*
* diet version of the soft drinks
Table 3. Sweeteners present in the evaluated diet soft drinks.
Sweeteners Samples that contain* Added as potassium salt Added as sodium salt
Saccharine A, B no yes
Cyclamate A, B, C no yes
Acesulfame C yes no
Aspartame B, C no no
Only in diet version
* Only in diet version
Sodium benzoate, added as conservative, is the main sodium source in non-diet soft drinks. In diet soft drinks sweeteners (cyclamate and saccha-rine) are added in a sodium-salt-type. For all diet soft drinks studied here higher sodium concentra-tions were found compared to non-diet version. Therefore, people that need to control sodium intake has to moderate the consumption of diet soft drink, especially those containing cyclamate and saccharine. Although aspartame addition does not provide increase in the sodium concentration the diet version of the samples B and C also show higher sodium content than the non-diet version. This can also be explained by the presence of sodium cyclamate and saccharine salts in these samples. Diet soft drinks generally contain a com-bination of two or more sweeteners in order to
Article
1.4
1.6
1.8
2.0
2.2
0.2
0.4
0.6
0.8
*
*
*
3
2
1
B
A
Signal / V
Time / min
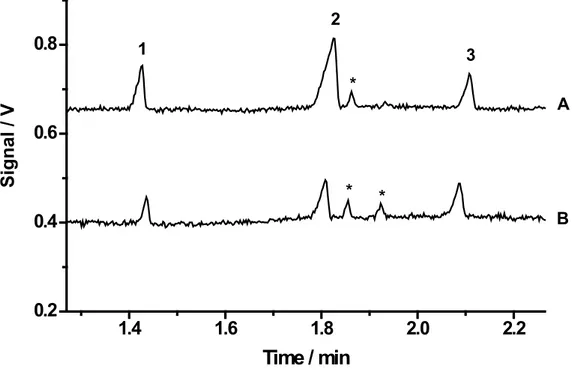
Figure 2. Electropherograms for (A) diet and (B) respective non-diet version of soft drinks diluted 25-fold with deionized water. Running buffer: 20 mmol L-1 His/Lac. Separation voltage 25 kV; gravity injection at
100 mm for 30 s; fused-silica capillary with 75 µm inner diameter and 50 cm long (40 cm effective); Peaks: (1) potassium, (2) sodium, (3) lithium that was used as internal standard (100 µmol L-1), and (*) not identi-ied peaks.
Conclusions
Sodium and potassium content in foods have gained a huge importance because depen-ding on the level intake these nutrients can be har-mful or beneicent to the human health. CE-C4D
method used in this work is shown to be a rapid and low sample consumption (nL) analytical tech-nique for potassium and sodium determination in soft drinks. Results obtained for soft drinks consu-med in the Brazilian market show that diet version of soft drinks usually contain higher sodium con-centration than non-diet version. That information is certainly helpful for people that need to control sodium intake. Hence, the CE-C4D technique can
beneit food industries and health regulatory agen
-sodium, and other cations not only in soft drinks, but also in many others food products.
Acknowledgments
References
[1] G. A. MacGregor, Am. J. Kidney Dis. 37 (2001) S34. [2] F. J. He, G. A. MacGregor, Br. Med. J. 323 (2001) 497. [3] A. Toseto, Master’s Dissertation, Universidade Estadual de Ponta Grossa, Brazil, 2005.
[4] M. F. M. Tavares, Quim. Nova 19 (1996) 173.
[5] J. W. Jorgenson, K. D. Lukacs, Anal. Chem. 53 (1981) 1298.
[6] J. A Fracassi da Silva, C. L. Lago, Anal. Chem. 70(1998) 4339.
[7] J. A. Fracassi da Silva, N. Guzman, C. L. Lago, J. Chro-matogr. A 942 (2002) 249.
[8] R. A. A. Munhõz, E. M. Richter, D. P. Jesus, C. L. Lago, L. Angnes, J. Braz. Chem. Soc. 15 (2004) 523.
[9] E. M. Richter, R. A. A. Munhõz, D. P. Jesus, C. L. Lago, Angnes L., J. Braz. Chem. Soc. 16 (2005) 1134.
[10] A. Z. Carvalho, J. A. Fracassi da Silva, C. L. Lago, Elec-trophoresis 24 (2003) 2138.
[11] X. Y. Gong, P. C. Hauser, Electrophoresis 27 (2006) 468.