Cop
yright
© ABE&M t
odos os dir
eit
os r
eser
vados
.
Arq Bras Endocrinol Metab. 2011;55/4
256
original article
Correspondence to:
Antônio Carlos Pires
Rua Francisco Inácio de Carvalho, 259
15014-090 − São José do Rio Preto, SP, Brazil
Received on Jul/13/2010 Accepted on Apr/26/2011
1 Departament of Endocrinology and
Metabology, School of Medicine of São Jose do Rio Preto (Famerp), São Jose do Rio Preto, SP, Brazil
2 Departament of Epidemiology and
Collective Health Famerp, São Jose do Rio Preto, SP, Brazil
Diabetic ketoacidosis: difference
between potassium determined
by blood gas analysis
versus
plasma measurement
Cetoacidose diabética: diferença entre as concentrações do potássio na gasometria sanguínea versus potássio plasmático
Fernando César Robles1, Daniel Laguna Neto1, Fábio Guirado Dias1,
Márcia Spressão1, Priscila Nascimbeni Matos1, José Antônio Cordeiro2,
Antônio Carlos Pires1
ABSTRACT
Objective: To evaluate the accuracy of potassium concentrations measured by blood gas analy-sis (PBG) compared with laboratory serum potassium (LSP), in the initial care of patients with
diabetic ketoacidosis (DKA).Subjects and methods: Fifty three patients with diabetes mellitus
were evaluated in a retrospective analysis. PBG was carried out using the Radiometer ABL
700 (Radiometer Copenhagen®), and results were compared with LSP ADVIA 1650 Chemistry
system (Siemens®), the gold standard method. Both methods are based on potentiometry.
Re-sults: Mean PBG was 3.66 mmol/L and mean LSP was 4.79 mmol/L. Mean difference between
PBG and LSP was -1.13 mmol/L (p < 0.0005, 95% CI, -1.39 to-0,86). Lin concordance correlation
coefficient was rc = 0.28 (95% CIb, 0.10 to 0.45), demonstrating low concordance between the
methods.Conclusion: Although PBG measurement is faster and easier, it should not be used as
a surrogate for LSP in the clinical treatment of DKA. Arq Bras Endocrinol Metab. 2011;55(4):256-9
Keywords
Diabetic ketoacidosis; serum potassium concentration; blood gas analysis of potassium
RESUMO
Objetivo: Avaliar a acurácia da mensuração da concentração de potássio realizado nos analisa-dores de gasometria sanguínea (PGS) em relação ao potássio plasmático laboratorial (PPL) no atendimento inicial dos pacientes com cetoacidose diabética (CAD). Sujeitos e métodos: Fo-ram avaliados, retrospectivamente, 53 pacientes com diabetes melito e CAD. A análise do PGS
foi realizada pelo equipamento ABL 700 (Radiometer Copenhagen®), sendo este comparado ao
método padrão-ouro de PPL ADVIA 1650 (Siemens®), ambos por potenciometria. Resultados:
A média do PGS foi de 3,66 mmol/L e do PPL, de 4,79 mmol/L. A diferença das médias do PGS em relação ao PPL foi de -1,13 mmol/L (p < 0,0005, IC = 95%; -1,39 a -0,86). O coeficiente de concordância de Lin foi de rc = 0,28 (ICb = 95%; 0,10 a 0,45), demonstrando, assim, uma baixa concordância entre os métodos. Conclusão: Apesar de a realização do PGS ser tecnicamente
mais rápida e fácil, não deve ser usadacomo parâmetro substituto ao PPL para o tratamento
clínico da CAD. Arq Bras Endocrinol Metab. 2011;55(4):256-9
Descritores
Cetoacidose diabética; potássio plasmático laboratorial; potássio no analisador de gasometria sanguínea
INTRODUCTION
D
iabetic ketoacidosis (DKA) is the most commonhyperglycemic emergency in patients suffering
from diabetes mellitus (DM), with mortality rates lower
Cop
yright
© ABE&M t
odos os dir
eit
os r
eser
vados
.
257
Arq Bras Endocrinol Metab. 2011;55/4
cerebral edema, and one-third by other causes, inclu-ding hydroelectrolytic disorders such as hypokalemia (6). A study from India, with 68 patients, showed that the most common complications during DKA treat-ment were hypokalemia in 41% of the cases, hypoglyce-mia in 15% of the cases, and cerebral edema in 13.2% of the cases (7). In another recent study, Ogbera and cols., evaluated 111 patients with hyperglycemic emergencies, and showed that hypokalemia occurred in 37% of the cases, being considered a predictor of death (8).
In DKA treatment, serum potassium concentration is essential information, considering that after the initial improvement in blood low, it is a limiting factor for insulinization. If the patient shows signiicant hypoka-lemia (serum potassium concentration lower than 3.3 mmol/L), the risk of arrhythmia risk, cardiac arrest and respiratory muscle weakness is increased (1,9).
Laboratory measurement of serum potassium is te-chnically more troublesome and lengthy (10). Thus, in emergency centers of tertiary hospitals that receive a large number of serious patients, serum potassium mea-surement is carried out by blood gas analysis when DKA patients are cared for, because it is easier and faster.
The aim of this study was to evaluate accuracy of potassium concentration measured using blood gas analysis compared with laboratory measurement of se-rum potassium, both based on potenciometry and col-lection of venous blood, in initial care of DKA patients.
SUBJECTS AND METHODS
Records of DM patients over 12 years of age were eva-luated retrospectively, one DKA event per patient.
Pa-tients were admitted in our emergency departmentfrom
January 2005 to January 2009. Diagnosis and level of seriousness of DKA were evaluated according to the gui-delines of the American Diabetes Association 2004 (1). The following parameters were evaluated when pa-tients were admitted in the emergency department: blood glucose, laboratory serum potassium concentra-tion (LSP), pH, and bicarbonate and potassium con-centration evaluated by blood gas analysis (PBG).
PBG analysis was carried out by the Radiometer
ABL 700 (Radiometer Copenhagen®, Denmark) in
un-diluted samples and with heparin sodium as the anti-coagulant agent. Results were compared with the gold standard method, LSP-ADVIA 1650 Chemistry system
(Siemens®) in undiluted samples. Both methods are
ba-sed on potenciometry with one ion-selective electrode. Analysis of pH was carried out by venous blood gas analysis, as recommended by the Diabetes Ketoacidosis Consensus of the American Diabetes Association, 2006 (9). The method presents excellent correlation with ar-terial gas analysis, which is only indicated in critical pa-tients. Average difference between arterial and venous blood gas analysis is about 0.03 lower in venous blood pH, as observed in several studies, without relevant in-terferences in clinical interpretation (11).
Statistical analysis was carried out by description,
paired t test and the Lin (rc) concordance correlation
coeficient (12). This study was evaluated and approved by the Research Ethics Committee of our institution
on May 11th, 2009 in report #110/2009 and protocol
#3140/2009.
RESULTS
From the 53 patients evaluated, 58.5% (n = 31) were female and 41.5% (n = 22) were male. Mean age was of 31.3 ± 33.7 years old (ranging from 13 to 78 years old).
Mean pH was 7.11 ± 0.15 (6.77 to 7.30), with 20.8%, 51% and 28.2% of DKA cases classiied as mild, moderate and severe, respectively. Mean serum glucose was 25.7 (or 463 mg/dL) ± 10.9 mmol/L (11.0 to 69.6 mmol/L), mean PBG was 3.66 ± 1.03 mmol/L (1.6 to 6.0 mmol/L), and mean LSP was 4.79 ± 0.87 mmol/L (3.0 to 7.1 mmol/L).
Mean difference between PBG and LSP was 1.13 ± 0.96 mmol/L (p < 0.0005, 95% CI, -1.39 to -0.86)
in paired t test (Table 1). In 66% of patients, difference
between LSP and PBG was greater than 0.5 mmol/L. There was no statistically signiicant correlation be-tween the difference of PBG and LSP means and pH quartile (p = 0.213) or serum glucose (p = 0.475).
Table 1. Means and difference in concentration between laboratory serum potassium and potassium assessed by blood gas analysis
N Mean
(mmol/L) SD
95% CI mean (mmol/L)
mean difference (mmol/L)
Difference
95%CI P Value
LSP 53 4.79 0.87 3.0 to 7.1 - -
-PBG 53 3.66 1.03 1.6 to 6.0 -1.13 -1.39 to -0.86 P < 0.0005
LSP: laboratory serum potassium; PBG: potassium concentration determined by blood gas analysis; SD: standard deviation. 95% CI, 95% confidence interval.
Cop
yright
© ABE&M t
odos os dir
eit
os r
eser
vados
.
258 Arq Bras Endocrinol Metab. 2011;55/4
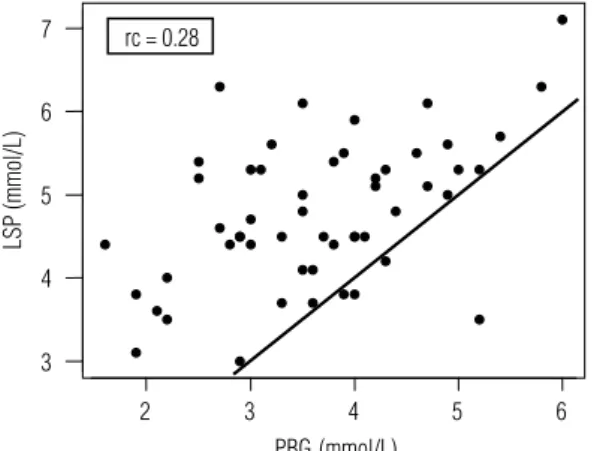
Lin concordance correlation coeficient was rc = 0.28 (95% CIb, 0.10 to 0.45), demonstrating low concor-dance between methods (very mild to mild) (Figure 1).
asked 64 physicians to evaluate the results of 529 pairs of samples of arterial blood gas analysis and serum po-tassium of 121 critical patients with any condition, and concluded that 51.6% of these physicians would wait for laboratorial serum potassium results to make any clinical decision, while 48.4% would accept potassium measurement determined by blood gas analysis (10).
The reasons for these disparities in the samples analyzed by PBG and LSP are still unknown and raise doubts on the actual validity of PBG measurement in the initial care of DKA patients. However, it is known that the potenciometric (or ion-selective electrode) LSP evaluation widely used in the world also has some limi-tations. In a Canadian study, Haag and cols. evaluated the accuracy of 9,279 serum potassium measurements in 503 laboratories, having lame atomic emission spec-trophotometry as the reference method for potassium measurement. They found out that 45.9% of these la-boratories presented statistically signiicant variations in their results (15).
The International Consensus on the standardiza-tion of sodium and potassium measurements by ion--selective electrodes in undiluted samples, recommends that methodologies used should be evaluated in com-parison with lame atomic emission spectrophotometry when the sample has normal concentrations of protein, lipids and other macromolecules, so that the electrodes
have a normal coeficientofactivity (16).
Errors observed in the potentiometric methods fall in one of two categories. One includes obvious errors caused by lack of selectivity, proteins, lining, ion-sen-sitive membrane, or contamination of the membrane by ions that compete or react with the selected ion, changing the response to this effect (mass effect). The second category, the solvent exclusion effect, is mainly applied to indirect methods. The errors in this category are mainly due to extreme lipid and protein concentra-tions in the sample. Except in cases of extreme hypo-proteinemia or hyperhypo-proteinemia and hyperlipidemia, electrolyte concentrations in whole plasma are reliably parallel to plasmatic water, where electrolytes play their special physiological roles. The magnitude of the error is less than 5% when triglyceride concentration is lower than 28.3 mmol/L (2,500 mg/dL) (17).
Patients with DM have increased incidence of hyper-triglyceridemia (18), especially in DKA (19), what may contribute to mass effect and increase disparity between samples analyzed by PBG and LSP. However, lack of data prevented the evaluation of this parameter in our study.
2 3 4 5 6
3 4 5 6 7
PBG (mmol/L)
LSP (mmol/L)
rc = 0.28
Figure 1. Lin’s concordance correlation coefficient between laboratory serum potassium concentration and potassium evaluated by blood gas analysis.
LSP: laboratory serum potassium concentration; PBG: potassium concentration determined by blood gas analysis.
DISCUSSION
Analysis of potassium concentration in initial care of patients with DKA is extremely important for the cor-rect approach and treatment, to prevent hypokalemia and delay in the use of insulin in the beginning of the-rapy. In our study, 66% of the patients assessed pre-sented differences between PBG and LSP greater than 0.5 mmol/L. From 53 patients studied, 17 (32% of the cases) had potassium in blood gas lower than 3.3 mmol/L. This represents a considerable number of patients that would not start insulin treatment imme-diately before intravenous potassium replacement.
In a pilot study published in 2003, Kelly and Midd-leton evaluated the difference between PBG and LSP samples of 43 patients, and found that the difference was greater than 0.5 mmol/L in 23% of them (13). In an important Australian study, Fu and cols., evaluated this difference in patients with DKA and asked 15 in-tensivists to mark on a form the clinically acceptable difference between potassium concentrations in diffe-rent samples, in relation to a “true” potassium level. Answers ranged from 0.25 to 1.0 mmol/L, with an average of 0.5 mmol/L. They also carried out a retros-pective analysis of records of DKA patients whose po-tassium concentration was determined both by blood gas analysis and serum measurement, and found out that 80% of samples had a difference within the ma-ximum clinically acceptable difference predeined by them (14). In another recent study, José and Preller
Cop
yright
© ABE&M t
odos os dir
eit
os r
eser
vados
.
259
Arq Bras Endocrinol Metab. 2011;55/4
In the study of Fu and cols., there was positive correlation between serum glucose and the difference
between PBG and LSP (p = 0.0033)(14), a fact that
was not observed in our study, maybe because of the lower mean blood glucose (25.7 mmol/L against 29.5 mmol/L). Besides, we included a patient who diffe-red from the studied population for presenting blood glucose of 69.6 mmol/L (1,253 mg/dL), increasing our mean blood glucose. Only 34% of our samples had blood glucose greater than 27.8 mmol/L (500 mg/dL) at the admission of the DKA patient.
Other factors that may interfere in serum potas-sium concentration are: type of sample, between whole blood or serum that underwent hemolysis (potassium
released from ruptured platelets in the clotting
pro-cess); muscular activity before venous pucture (potas-sium may increase from 10% to 20% if the patient opens and closes his/her hands before blood collection (17); extreme thrombocytosis and leukocytosis (20); and lo-wer temperature of whole blood sample before separa-tion, increasing potassium concentration in the serum (17,21,22).
This study is the irst in the literature to evaluate diffe-rence in potassium concentration between PBG and LSP exclusively in venous blood collected upon admission of DKA patients. New, prospective studies are necessary, with appropriate design to compare results and clarify possible factors inluencing the disparity between potentiometric methods. It is clear that these results require further eva-luation in other services in order to contribute for the im-provement of DKA treatment, from the moment blood is collected to the inal result of the treatment.
In conclusion, a weak concordance correlation co-eficient was demonstrated between potassium con-centrations measured by blood gas analysis (PBG) and laboratory serum potassium (LSP), in the initial asses-sment of DKA. Although it is technically faster and ea-sier, PBG should not be used as surrogate for LPS in the management of these patients.
Disclosure: no potential conlict of interest relevant to this article was reported.
REFERENCES
1. Kitabchi AE, Umpierrez GE, Murphy MB, Barret EJ, Kreisberg RA, Malone JI, et al. Hyperglycemic crises in diabetes. Diabetes Care. 2004:27(1):S94-S102.
2. Curtis JR, To T, Muirhead S, Cummings E, Daneman D. Recent trends in hospitalization for diabetic ketoacidosis in Ontario chil-dren. Diabetes Care. 2002;25:1591-6.
3. Levitsky L, Ekwo E, Goselink CA, Solomon IL, Aceto T. Death from diabetes (DM) in hospitalized children (1970-1988) [abstract]. Pe-diatr Res. 1991;29:A195.
4. Cummings E, Lawrence S, Daneman D. Cerebral edema (CE) in pediatric diabetic ketoacidosis (DKA) in Canada. Diabetes. 2003;52:A400.
5. Edge JA, Ford-Adams ME, Dunger DB. Causes of death in chil-dren with insulin dependent diabetes 1990-96. Arch Dis Child. 1999;81:318-23.
6. Dunger DB, Sperling MA, Acerini CL, Bohn DJ, Daneman D, Dan-ne TPA, et al. European Society for Paediatric Endocrinology/La-wson Wilkins Pediatric Endocrine Society consensus statement on diabetic ketoacidosis in children and adolescents. Pediatrics. 2009:133-40.
7. Jayashree M, Singhi S. Diabetic ketoacidosis: predictors of ou-tcome in a pediatric intensive care unit of a developing country. Pediatr Criti Care Med. 2004;5(5):427-33.
8. Ogbera AO, Awobusuyi J, Unachukwu C, Fasanmade O. Clini-cal features, predictive factors and outcome of hyperglycae-mic emergencies in a developing country. BMC Endocr Disord. 2009;9(1):9.
9. Wolfsdorf J, Glaser N, Sperling MA. Diabetic ketoacidosis in in-fants, children, and adolescents. Diabetes Care. 2006;(5):1150-9. 10. José RJP, Preller J. Near-patient testing of potassium levels using
arterial blood gas analysers: can we trust these results? BMJ Pub. 2008;25(8):510-3.
11. Kreshak A, Chen EH. Arterial blood gas analysis: are its values needed for the management of diabetic ketoacidosis? Ann Emerg Med. 2005;45(5):550-51.
12. Lin LI-K. A concordance correlation coefficient to evaluate repro-ducibility. Biometrics. 1989;45:255-68.
13. Kelly AM, Middleton P. Is potassium concentration from arterial blood gas accurate reflection of serum potassium? Emerg Med. 2003;15:301-2.
14. Fu P, Douros G, Kelly AM. Does potassium concentration measu-red on blood gas analysis agree with serum potassium in patients with diabetic ketoacidosis? Emerg Med Australas. 2004;16:280-3. 15. Haag MDM, Kelly JR, Ho A, Seccombe DW. A study to examine
the accuracy of potassium measurements in clinical laboratories across Canada. Clin Biochem. 2000(33):449-56.
16. Kulpmann WR, Hobbel T. International consensus on the stan-dardization of sodium and potassium measurements by ion-se-lective electrodes in undiluted samples. Scand J Clin Lab Invest. 1996;56(244):145-60.
17. Burts CA, Ashwood ER. Tietz. 4.ed. Fundamentos de química clíni-ca. Rio de Janeiro/Guanabara Koogan; 1998. p. 481-9.
18. Seyoum B, Abdulkadir J, Berhanu P, Feleke Y, Mengistu Z, Worku Y, et al. Analysis of serum lipids and lipoprotein in Ethiopian dia-betic patients. Ethiop Med J. 2003;41:1-8.
19. Laguna Neto D, Pires AC. Rev Bras Clin Med. 2010;8(3):246-53. 20. Graber M, Subramani K, Corish D, Schwab A. Trombocytosis
ele-vates serum potassium. Am J Kidney Dis. 1988;12:116-20. 21. Lin YL, Smith CH, Dietzeler DN. Stabilization of blood glucose by
colling with ice: an effective procedure for preservation of sam-ples from adults and newborns. Clin Chem. 1976;22:2031-3. 22. Stewart GW, Ellory JC, Klein RA. Increased human red cell cation