Work carried out at the Medical School, Brasília University - UnB - Brasília (DF), Brazil. 1Physician, Brasília University - UnB - Brasília (DF), Brazil.
2Physician, Federal University of Rio de Janeiro - UFRJ - Rio de Janeiro (RJ), Brazil. 3Biostatistician, Department of Health, Brasília University - UnB - Brasília (DF), Brazil. 4Physician, Federal University of Góias - UFG - Goiás (GO), Brazil.
Correspondence address: Wener Passarinho Cella. Centro Brasileiro da Visão. Av. L2 Sul, 613/ 14 - Lote 91 - Brasília (DF) - CEP 70200-730
E-mail: [email protected] Recebido para publicação em 26.08.2010 Última versão revisada recebida em 21.11.2010 Aprovação em 17.12.2010
Nota Editorial: Depois de concluída a análise do artigo sob sigilo editorial e com a anuência da Dra. Rosane da Cruz Ferreira sobre a divulgação de seu nome como revisora, agradecemos sua participação neste processo.
Axonal electrovisiogram as an electrophysiological test to evaluate optic nerve
and inner retina electrical potentials: findings in normal subjects
Eletrovisuograma axonal como teste eletrofisiológico na avaliação dos potenciais de ação
do nervo óptico e da retina interna: achados em indivíduos normais
WENER PASSARINHO CELLA1, ADALMIR MORTERÁ DANTAS2, ALEXANDRE VASCONCELOS LIMA3, MARCOS PEREIRADE ÁVILA4
INTRODUCTION
T
he neurological electrical activity set off by a light stimulus is known as visual evoked potential (VEP) and is obtained by skin electrodes placed over the occipital cortex after repea-ted retinal stimulation(1). The VEP reflects the optic pathways func-tionality from the retina until the occipital visual cortex, and the measurable electric wavelets generated by bright flashing lightscan be grouped into early components (waves 1, 2 and 3) and late components (waves 4 to 7)(2).
The early VEP components are not as constant as the late ones and have a controversial origin, indicating that they might represent the electrical potential of the optic nerve(3), lateral geniculate body(4), or even visual striate cortex(5). There is also evidence that some potentials as early as 30 milliseconds (ms), known as subcorticals, may have a post-chiasmatic origin, bearing no relation to the ones origi-nated from the retina(6).
Electrophysiological evaluation can also be made with the electroretinogram (ERG)(7) but sometimes, the topographical defi-nition of certain lesions can be inconclusive, especially in cases that involve the optic nerve(7).
The possibility to record the electrical potential of the optic nerve was conceived by Sabadel et al., in 1983, using the axonal electrovisiogram (AxEvg)technique(8).According to these authors, the AxEvg reveals different amplitudes and latencies when compared to those found in the retina and detected in the ERG. In addition, although the AxEvg wavelets represent visual evoked potentials with similar latencies to the early VEP components(9), the ones obtained in AxEvg have a pre-chiasmatic origin(8,10).
RESUMO
Objetivos: Padronizar e validar a técnica de realização do eletrovisuograma axonal (EVA), definir seus valores normativos e caracterizar os achados em indivíduos normais.
Métodos: Estudo descritivo com 140 indivíduos (280 olhos) normais. Os partici-pantes foram divididos em sete grupos de acordo com a idade, cada qual com 10 indivíduos do sexo masculino e 10 do sexo feminino. Definiu-se como técnica de exame a estimulação monocular por flash luminoso com intensidade de 0 dB na cúpula de Ganzfeld a uma frequência de 1,4 Hz. Foram utilizados eletrodos com cúpula de ouro e foram analisados os traçados elétricos obtidos após rejeição de artefatos. Para cada amplitude e tempo de culminação foram calculados a média, a mediana, o desvio-padrão, os valores mínimo e máximo e o intervalo de confiança de 95% representando uma faixa de normalidade para os valores.
Resultados: A técnica de exame padronizada foi a estimulação visual monocular por flash em condições mesópicas. O traçado normal do eletrovisuograma axonal consis-tiu numa onda positiva inicial (P1, com amplitude média de 2,0 mV e tempo de culminação médio de 23,1 ms) seguida de uma onda negativa (N1, com amplitude média de -3,9 mV e tempo de culminação médio de 41,4 ms). Não foram observadas diferenças significativas entre os sexos e entre os olhos direito e esquerdo, mas os tempos de culminação de P1 e de N1 aumentaram proporcionalmente com a idade.
Conclusões: O eletrovisuograma axonal é um exame de potencial visual evocado pré-quiasmático, capaz de registrar de forma confiável e reprodutível a atividade elétrica do nervo óptico e da retina interna, podendo ser utilizado na propedêutica eletrofisiológica na investigação de lesões neurorretinianas.
Descritores: Eletrofisiologia; Eletrorretinografia; Potenciais evocados visuais; Nervo óptico/fisiologia; Estimulação luminosa; Eletrodiagnóstico; Retina
ABSTRACT
Purposes: To standardize and validate the technique of axonal electrovisiogram (AxEvg), defining its normative values and parameters and characterizing its findings in normal individuals.
Methods: We enrolled 140 normal individuals (280 eyes) divided into seven groups according to age, each one with 10 males and 10 females. The technique was based on monocular visual stimulation by a 0 dB intensity bright flash on Ganzfeld bowl at a presentation rate of 1.4 Hz. Golden cup electrodes were used and electrical waves were acquired after artifact rejection. For each amplitude and implicit time peak we calculated the mean, median, pattern deviation, minimum and maximum values and 95% confidence interval.
Results: Monocular visual stimulation with bright flash under mesopic conditions was the standard technical procedure established. The normal AxEvg waveform consists of an initial positive wave (named P1, with mean amplitude of 2.0 mV and mean implicit time peak of 23.1 ms) followed by a negative wave (named N1, with mean amplitude of -3.9 mV and mean implicit time peak of 41.4 ms). No significant differences were observed between males and females or between right and left eyes, but there was an increased P1 and N1 implicit time peaks according to age. Implicit time characteristics suggest that P1 wave represents an optic nerve electrical potential and N1 wave represents an inner retinal layers potential.
Conclusions: AxEvg can be considered a pre-chiasmatic visual evoked potential capable to reliably record the electrical activity of optic nerve and inner retina. The findings suggest that AxEvg may be useful as an electrophysiological test in the diagnosis of neuroretinal diseases.
Besides the original studies dated from 1983(8,10), no additional reports on AxEvg have been published since then. Thus, no tech-nical standardization or normative values are known and no clitech-nical use has been established so far.
For clinical purposes, adequate knowledge about AxEvg electrical origins and wavelets characteristics is needed in order to interpret results accurately. The goal of the present study is to validate the AxEvg as an electrophysiological test by standardizing the technique and establishing the normative values, which will lead to the definition of its clinical indications in the near future.
METHODS
P
ARTICIPANTSNormal individuals were selected from an ophthalmology tertiary center at Hospital de Base do Distrito Federal and from a private practice at Centro Brasileiro da Visão between March, 2007 and March, 2009.
All participants had a comprehensive ophthalmic examination, including refraction and measurement of best-corrected visual acuity with Snellen charts, biomicroscopy, intraocular pressure mea-surement and funduscopy under pupil dilation. Patients were en-rolled with the approval of the Ethics Committee in Research at University of Brasília (CEP-FM 009/2007), and all research proce-dures were performed in accordance with the tenets of the Decla-ration of Helsinki. Informed consent was obtained from all studied subjects before their enrollment.
We enrolled 140 normal individuals (280 eyes), disregarding ethnicity and from both genders, with the aim to establish normative values for AxEvg. An individual was considered normal when best-corrected visual acuity with the Snellen chart was 20/20 (or 1,0), presenting refraction between +3,00 spherical and -3,00 spherical and/or a maximum of -1,50 cilinder. We excluded in-dividuals with any ophthalmic condition that could reduce media transparency (such as corneal leucomas, cataracts, vitreous opacities and anterior or posterior uveitis), retinal dystrophies or degenera-tions and neuro-ophthalmic disorders (such as glaucoma and optic neuropathies). We also excluded those with systemic chronic disea-ses that could cause retinal or brain ischemia (such as systemic arterial hypertension and diabetes mellitus) or that could present visual impairment due to medications (including those with au-toimmune disorders).
Participants were divided into seven groups, each of them composed by 10 males and 10 females, according to age: 1-10 years-old, 11-20 years-old, 21-30 years-old, 31-40 years-old, 41-50 years-old, 51-60 years-old, and older than 60 years-old.
M
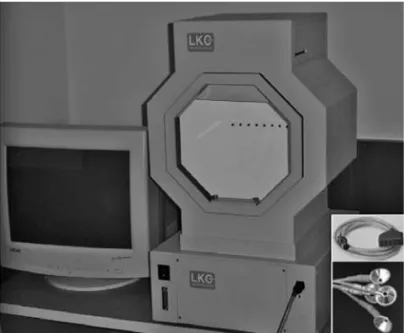
ATERIALSAn UTAS E-3000™ (LKC Technologies Inc, USA) electrophysiolo-gy equipment with Ganzfeld illumination and photic stimulator was used. Golden cup electrodes were connected to a pre-ampli-fier system (Figure 1).
Electrode positioning on the skin was made with adhesive tape and electrolyte conductive paste (Ten20™, D.O. Weaver & Co., Colorado, USA) after local cleaning and degreasing with abrasive gel (Nuprep™, D.O. Weaver & Co., Colorado, USA).
T
ECHNIQUEANDPARAMETERSAxEvg was performed under mesopic conditions, undilated pupils and monocular visual stimulation with occlusion of the non-tested eye.
Electrode positioning followed the guidelines of the original paper(8), with the active electrode (negative dipole) located 2 cm temporally to the outer canthus of the tested eye, the reference electrode (positive dipole) at the ipsilateral earlobe (as an ear clip)
and the ground electrode at the forehead position (Figure 2). After electrode positioning and occlusion of the contralateral eye, the subject was placed in front of the Ganzfeld bowl with the head over a chin rest and oriented to focus on a central fixation light emitting diode (LED).
For registration of electrical potentials we used parameters similar to those preconized by International Society for Clinical Electrophysiology of Vision (ISCEV) ISCEVled for flash VEP(11), since there is no previous standardization for AxEvg. Thus, the flash light was set to 2.5 cd.s/m2, corresponding to 0 dB at the Ganzfeld bowl, and the presentation rate was set to 1.4 Hz. Skin electrodes im-pedances were below 5 KΩ and, in order to additionally reduce noise from muscle artifacts, eye movements or other noises
un-Figure 1. LKC UTAS-3000 electrophysiology equipment with Ganzfeld bowl. In detail: 4-channel pre-amplifier (top, lower right corner) and golden cup electrodes (bottom, lower right corner).
Figure 3. Nomal AxEvg wavelet, characterized by an initial positive wave (P1) followed by a negative wave (N1). P1 and N1 amplitudes were calculated from baseline to wavelet peaks and addition of P1 plus N1 amplitudes reveals the P1N1 component. Implicit time peaks were calculated from light stimulus onset to the maximum P1 and N1 amplitudes. Difference between N1 and P1 implicit time peaks reveals the P1N1 duration.
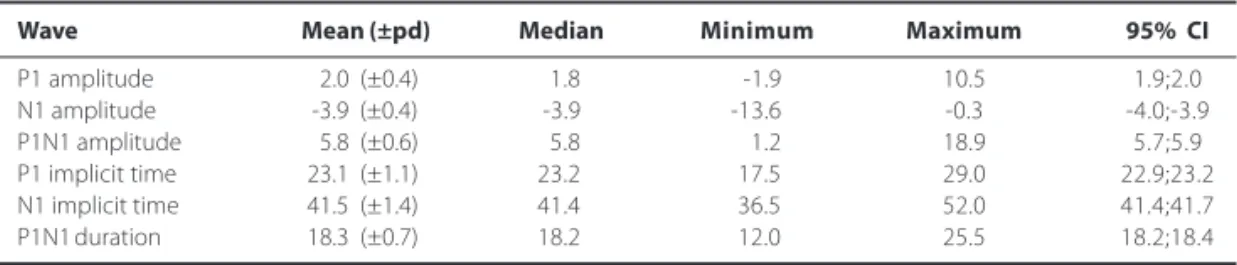
Table 1. Normal values for 280 eyes of 140 normal individuals of any age and both genders. Amplitude values are expressed in microvolts (µµµµµV). Implicit time and duration values are expressed in milliseconds (ms)
Wave Mean (±pd) Median Minimum Maximum 95% CI
P1 amplitude 2.0 (±0.4) 1.8 -1.9 10.5 1.9;2.0
N1 amplitude -3.9 (±0.4) -3.9 -13.6 -0.3 -4.0;-3.9
P1N1 amplitude 5.8 (±0.6) 5.8 1.2 18.9 5.7;5.9
P1 implicit time 23.1 (±1.1) 23.2 17.5 29.0 22.9;23.2
N1 implicit time 41.5 (±1.4) 41.4 36.5 52.0 41.4;41.7
P1N1 duration 18.3 (±0.7) 18.2 12.0 25.5 18.2;18.4
pd= pattern deviation; CI= confidence interval
related to the stimulus, high-pass (low cut) filter was set to 1 Hz and low-pass (high cut) filter to 30 Hz. Artifact automatic rejection was set up to 50 µV and the sweep duration (analysis time) was 250 ms. The analogue signal was digitized at a rate of 2000 Hz and the input sign was amplified by 10.000 times with an input impedance of the pre-amplifier higher than 10 MΩ.
For waveform analysis, 100 sweeps were averaged to reduce electroencephalographic noise. Wavelets were analyzed according to the amplitude in microvolts (µV) and to the implicit time peak in milliseconds (ms). The amplitude corresponds to the maximum (positive or negative) value in microvolt at the wavelet peak. The implicit time peak corresponds to the time from the light stimulus onset up to the wave amplitude(11-12).
S
TATISTICALANALYSISWavelet amplitudes and implicit time peaks were individually evaluated according to age and gender using analysis of variance (ANOVA). Mean, median, pattern deviation, minimum and maximum values, and 95% confidence interval were calculated for each ampli-tude and implicit time peak. Correlation between age and these variables was calculated using Pearson’s correlation coefficient. Tukey test was utilized when ANOVA revealed statistically significant differences between age and variables. Statistical significance was defined as p<0.05 and statistical analysis was made with SPSS software version 13.0.
RESULTS
All tested eyes revealed on AxEvg reproducible and artifact free wavelets characterized by an initial positive wave, named P1, followed by a negative wave, named N1. The P1 amplitude was calculated from baseline to its positive peak and the N1 ampli-tude was calculated from baseline to its negative peak. Sum-mation of P1 amplitude plus N1 amplitude revealed the P1N1 component. Implicit time peaks were calculated from light sti-mulus onset (at 0 ms) to the wavelet peak (positive in case of P1 and negative in case of N1). The difference between N1 and P1 implicit time peaks was defined as the P1N1 duration in milliseconds (Figure 3).
The normal values for amplitude and implicit time peak for P1 and N1 waves and for amplitude and duration of the P1N1 compo-nent, including all studied subjects (280 eyes) are shown in table 1. Descriptive data according to the studied eye, including 140 right eyes and 140 left eyes, is shown in table 2. Table 3 shows mean, pattern deviation, median, minimum and maximum values and 95% confidence interval for P1, N1 and P1N1 amplitudes in both right and left eyes according to age. Table 4 shows mean, pattern deviation, median, minimum and maximum values and 95% confi-dence interval for P1 and N1 implicit time peaks, and for P1N1 duration in both right and left eyes according to age.
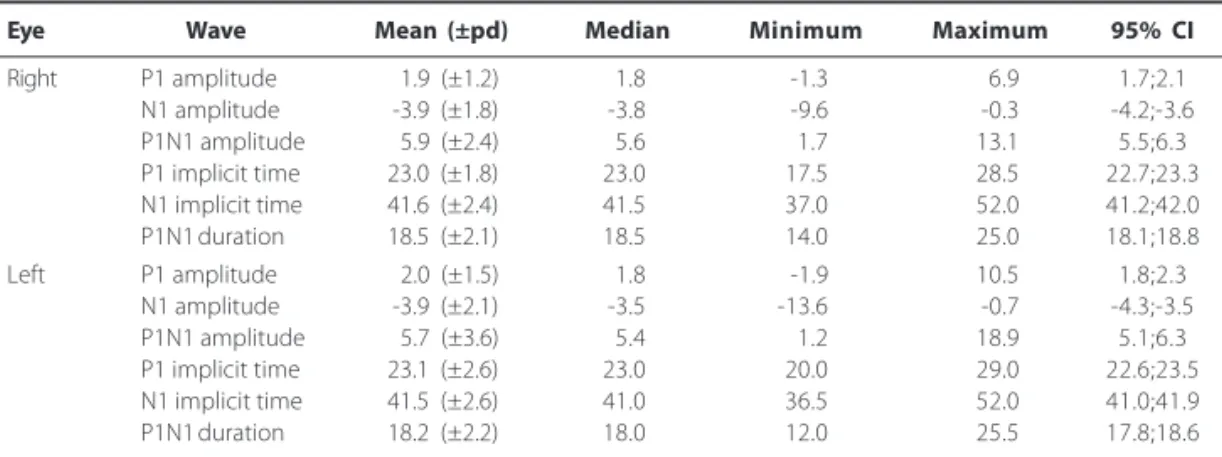
dif-Table 2. Normal values, according to the eye, of 140 normal individuals (140 right eyes and 140 left eyes) of any age and both genders. Amplitude values are expressed in microvolts (µµµµµV). Implicit time and duration values are expressed in milliseconds (ms)
Eye Wave Mean (±pd) Median Minimum Maximum 95% CI
Right P1 amplitude 1.9 (±1.2) 1.8 -1.3 6.9 1.7;2.1
N1 amplitude -3.9 (±1.8) -3.8 -9.6 -0.3 -4.2;-3.6
P1N1 amplitude 5.9 (±2.4) 5.6 1.7 13.1 5.5;6.3
P1 implicit time 23.0 (±1.8) 23.0 17.5 28.5 22.7;23.3
N1 implicit time 41.6 (±2.4) 41.5 37.0 52.0 41.2;42.0
P1N1 duration 18.5 (±2.1) 18.5 14.0 25.0 18.1;18.8
Left P1 amplitude 2.0 (±1.5) 1.8 -1.9 10.5 1.8;2.3
N1 amplitude -3.9 (±2.1) -3.5 -13.6 -0.7 -4.3;-3.5
P1N1 amplitude 5.7 (±3.6) 5.4 1.2 18.9 5.1;6.3
P1 implicit time 23.1 (±2.6) 23.0 20.0 29.0 22.6;23.5
N1 implicit time 41.5 (±2.6) 41.0 36.5 52.0 41.0;41.9
P1N1 duration 18.2 (±2.2) 18.0 12.0 25.5 17.8;18.6
pd= pattern deviation; CI= confidence interval
Table 3. Descriptive data for P1, N1 and P1N1 amplitudes according to age, including both genders, in 280 normal eyes. Each age group is composed by 20 right eyes and 20 left eyes. Amplitude values are expressed in microvolts (µµµµµV)
Eye Wave Age group Mean (±pd) Median Minimum Maximum 95% CI
Right P1 amplitude 1-10 1.5 (±1.2) 1.2 -0.5 4.0 0.9;2.0
11-20 1.4 (±0.7) 1.5 0.2 3.2 1.0;1.7
21-30 1.7 (±1.3) 1.2 -0.5 5.9 1.1;2.2
31-40 2.6 (±1.2) 2.7 -1.3 4.6 2.1;3.2
41-50 1.7 (±1.2) 1.3 0.1 4.8 1.1;2.3
51-60 2.5 (±1.1) 2.4 0.8 5.3 1.9;3.0
> 60 2.1 (±1.4) 1.9 0.7 6.9 1.5;2.7
N1 amplitude 1-10 -4.7 (±1.7) -4.4 -9.2 -1.8 -5.5;-3.9
11-20 -3.2 (±1.0) -3.4 -4.7 -1.5 -3.7;-2.7
21-30 -4.1 (±1.7) -3.8 -7.4 -1.7 -4.8;-3.3
31-40 -3.8 (±1.7) -3.9 -9.0 -1.4 -4.6;-3.1
41-50 -3.5 (±1.8) -3.4 -7.5 -0.3 -4.3;-2.7
51-60 -4.2 (±2.3) -3.9 -9.6 -0.8 -5.3;-3.2
> 60 -4.0 (±1.9) -3.4 -8.2 -1.5 -4.9;-3.2
P1N1 amplitude 1-10 6.4 (±2.3) 6.4 2.3 12.0 5.4;7.4
11-20 4.6 (±1.3) 4.4 2.5 6.8 4.0;5.2
21-30 5.8 (±2.2) 5.5 2.5 9.9 4.8;6.8
31-40 6.5 (±2.1) 6.5 1.9 11.7 5.5;7.5
41-50 5.2 (±2.5) 5.2 1.7 9.9 4.1;6.4
51-60 6.7 (±3.1) 5.7 2.9 13.1 5.4;8.1
> 60 6.2 (±2.6) 5.3 3.0 12.6 5.0;7.3
Left P1 amplitude 1-10 1.7 (±1.5) 1.5 -0.8 4.1 1.1;2.4
11-20 1.8 (±0.8) 1.9 0.2 3.5 1.4;2.1
21-30 1.7 (±1.4) 1.7 -0.7 5.6 1.1;2.3
31-40 2.3 (±1.2) 2.1 -0.4 4.7 1.7;2.8
41-50 1.9 (±1.2) 1.7 -0.1 4.6 1.3;2.5
51-60 2.4 (±1.6) 2.3 0.4 5.6 1.7;3.1
> 60 2.3 (±2.3) 2.0 -1.9 10.5 1.3;3.3
N1 amplitude 1-10 -4.5 (±1.9) -3.9 -8.8 -1.4 -5.3;-3.6
11-20 -3.4 (±1.7) -2.9 -7.3 -0.7 -4.2;-2.6
21-30 -3.7 (±1.7) -3.6 -7.3 -1.5 -4.5;-3.0
31-40 -3.5 (±2.2) -3.3 -10.9 -0.8 -4.5;-2.5
41-50 -3.7 (±1.9) -3.5 -7.4 -1.0 -4.5;-2.8
51-60 -4.3 (±3.0) -2.9 -13.6 -1.9 -5.7;-3.0
> 60 -4.2 (±2.4) -3.5 -8.4 -0.8 -5.3;-3.1
P1N1 amplitude 1-10 6.2 (±2.8) 6.5 1.2 12.9 4.9;7.5
11-20 5.2 (±2.0) 5.1 1.2 10.0 4.3;6.1
21-30 5.5 (±2.5) 4.7 2.2 11.0 4.4;6.6
31-40 5.8 (±2.9) 5.3 1.8 15.5 4.5;7.1
41-50 5.6 (±2.7) 5.7 1.6 9.4 4.4;6.8
51-60 4.9 (±6.4) 4.7 2.5 18.3 2.1;7.8
> 60 6.8 (±3.9) 5.5 2.3 18.9 5.0;8.5
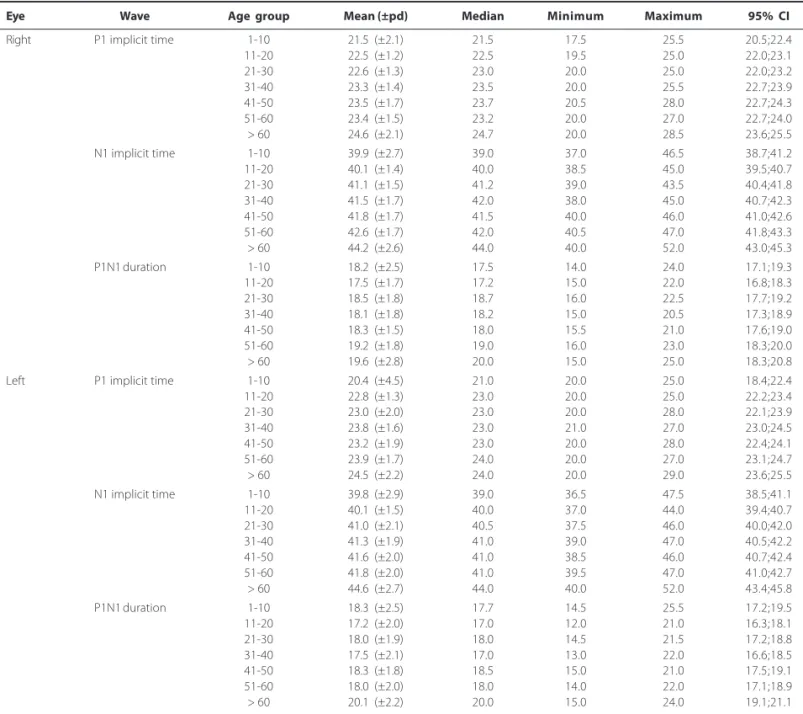
Table 4. Descriptive data for P1 and N1 implicit time peaks and P1N1 duration according to age, including both genders, in 280 normal eyes. Each age group is composed by 20 right eyes and 20 left eyes. Implicit time and duration values are expressed in milliseconds (ms)
Eye Wave Age group Mean (±pd) Median Minimum Maximum 95% CI
Right P1 implicit time 1-10 21.5 (±2.1) 21.5 17.5 25.5 20.5;22.4
11-20 22.5 (±1.2) 22.5 19.5 25.0 22.0;23.1
21-30 22.6 (±1.3) 23.0 20.0 25.0 22.0;23.2
31-40 23.3 (±1.4) 23.5 20.0 25.5 22.7;23.9
41-50 23.5 (±1.7) 23.7 20.5 28.0 22.7;24.3
51-60 23.4 (±1.5) 23.2 20.0 27.0 22.7;24.0
> 60 24.6 (±2.1) 24.7 20.0 28.5 23.6;25.5
N1 implicit time 1-10 39.9 (±2.7) 39.0 37.0 46.5 38.7;41.2
11-20 40.1 (±1.4) 40.0 38.5 45.0 39.5;40.7
21-30 41.1 (±1.5) 41.2 39.0 43.5 40.4;41.8
31-40 41.5 (±1.7) 42.0 38.0 45.0 40.7;42.3
41-50 41.8 (±1.7) 41.5 40.0 46.0 41.0;42.6
51-60 42.6 (±1.7) 42.0 40.5 47.0 41.8;43.3
> 60 44.2 (±2.6) 44.0 40.0 52.0 43.0;45.3
P1N1 duration 1-10 18.2 (±2.5) 17.5 14.0 24.0 17.1;19.3
11-20 17.5 (±1.7) 17.2 15.0 22.0 16.8;18.3
21-30 18.5 (±1.8) 18.7 16.0 22.5 17.7;19.2
31-40 18.1 (±1.8) 18.2 15.0 20.5 17.3;18.9
41-50 18.3 (±1.5) 18.0 15.5 21.0 17.6;19.0
51-60 19.2 (±1.8) 19.0 16.0 23.0 18.3;20.0
> 60 19.6 (±2.8) 20.0 15.0 25.0 18.3;20.8
Left P1 implicit time 1-10 20.4 (±4.5) 21.0 20.0 25.0 18.4;22.4
11-20 22.8 (±1.3) 23.0 20.0 25.0 22.2;23.4
21-30 23.0 (±2.0) 23.0 20.0 28.0 22.1;23.9
31-40 23.8 (±1.6) 23.0 21.0 27.0 23.0;24.5
41-50 23.2 (±1.9) 23.0 20.0 28.0 22.4;24.1
51-60 23.9 (±1.7) 24.0 20.0 27.0 23.1;24.7
> 60 24.5 (±2.2) 24.0 20.0 29.0 23.6;25.5
N1 implicit time 1-10 39.8 (±2.9) 39.0 36.5 47.5 38.5;41.1
11-20 40.1 (±1.5) 40.0 37.0 44.0 39.4;40.7
21-30 41.0 (±2.1) 40.5 37.5 46.0 40.0;42.0
31-40 41.3 (±1.9) 41.0 39.0 47.0 40.5;42.2
41-50 41.6 (±2.0) 41.0 38.5 46.0 40.7;42.4
51-60 41.8 (±2.0) 41.0 39.5 47.0 41.0;42.7
> 60 44.6 (±2.7) 44.0 40.0 52.0 43.4;45.8
P1N1 duration 1-10 18.3 (±2.5) 17.7 14.5 25.5 17.2;19.5
11-20 17.2 (±2.0) 17.0 12.0 21.0 16.3;18.1
21-30 18.0 (±1.9) 18.0 14.5 21.5 17.2;18.8
31-40 17.5 (±2.1) 17.0 13.0 22.0 16.6;18.5
41-50 18.3 (±1.8) 18.5 15.0 21.0 17.5;19.1
51-60 18.0 (±2.0) 18.0 14.0 22.0 17.1;18.9
> 60 20.1 (±2.2) 20.0 15.0 24.0 19.1;21.1
pd= pattern deviation; CI= confidence interval
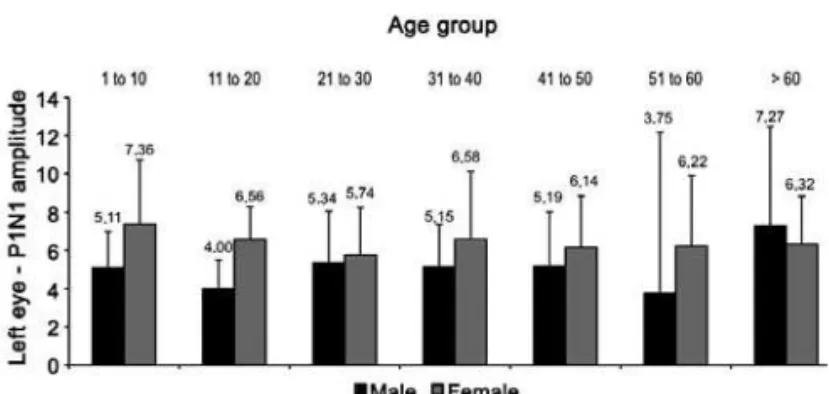
ference observed (p=0.03), revealing lower amplitudes in females younger than 60 years-old (Figure 4).
Comparative analysis regarding age revealed increasing values with aging for P1 amplitude in the right eye (p=0.01, Pearson’s coefficient= 0.199), for P1 implicit time peak in both eyes (p=0.00 for both eyes, Pearson’s coefficient= 0.466 for the right eye and 0.392 for the left eye), for N1 implicit time peak in both eyes (p=0.00 for both eyes, Pearson’s coefficient= 0.563 for the right eye and 0.517 for the left eye), and for P1N1 duration in both eyes (p=0.003 and Pearson’s coefficient= 0.246 for the right eye and p=0.004 and Pearson’s coefficient= 0.237 for the left eye).
DISCUSSION
VEP elicited by bright flash lights (called flash VEP) represents a strong and resistant visual cortex response that is impaired only in cases of severe optic pathways lesions and can be used to
investi-gate unexplained visual loss(13-15). VEP waveforms can vary among normal individuals(15) and the parameters used to evaluate its response are amplitude and implicit time.Amplitude is related to the functional integrity of optic pathways, and implicit time is related to the conduction of visual sign along optic pathways(16). Analyzing amplitude and implicit time allows to investigate phy-siopathology of several neuro-ophthalmic disorders(17). In addition, topographic location can be determined using adequate stimu-lation (for example, monocular stimustimu-lation evaluates pre-chiasma-tic lesions(18)) or by association between different electrophysiolo-gical techniques (for example, association with pattern reversal ERG to detect macula or optic nerve lesions)(17).
Figure 4. P1N1 amplitude comparison between males and females in the left eye, expressed in microvolts (mV). Mean amplitudes are higher in females but those older than 60 years-old.
light stimulation and then it is transmitted to the visual cortex after about 50 ms(14,19). However, the time taken for processing retinal information, its transmission along optic pathways and its cortical processing capable to generate a recordable electrical activity, reflects about twice the actual time of driving stimulus(14).
AxEvg is a modality of visual evoked potential originally des-cribed as arising from the optic nerve(8). It is an easily performed and low cost electrophysiological test, since it does not require special equipment or different materials from those usually employed for the flash VEP. Its normal electric response is composed by an initial positive wave, named P1, followed by a negative wave of greater amplitude, named N1, which represents the main electrical poten-tial(8,10). The P1N1 component is obtained from the P1 maximum positive amplitude to the N1 maximum negative amplitude.
P1 and N1 waves were constant and reproducible in all normal eyes. Mean P1 amplitude was 2.0 µV, mean N1 amplitude was -3.9 µV, and mean P1N1 amplitude was 5.8 µV. Mean P1 implicit time peak was 23.1 ms, mean N1 implicit time peak was 41.5 ms, and mean P1N1 duration was 18.3 ms.
No significant differences were found between the right and left eyes in both males and females, similar to the findings pre-viously described for normal values of visually evoked potentials(11). The only exception was the P1N1 amplitude of the left eye, that presented higher mean amplitudes in normal female subjects younger than 60 years. Because this was an isolated finding among all variables and no statistically significant differences were found in P1 and N1 waves (the forming waves of P1N1 component), it is possible that this difference has no clinical significance and it may disappear by increasing the sample size.
According to age, P1 and N1 implicit time peaks and P1N1 duration increased with age, similar to normal flash and pattern reversal VEP(20-25). We also observed that P1 amplitude in the right eye increased with age, but this finding should be considered with caution because, although this variable has reached statistical significance, the Pearson’s correlation coefficient suggests a weak association.
P1 presented a mean implicit time peak of about 23 ms (with a 95% confidence interval from 22.9 to 23.2 ms) and N1 presented a mean implicit time peak of about 41 ms (95% confidence interval from 41.4 to 41.7 ms). As low-pass (high cut) filter was set to 30 Hz in order to reduce the interference from electric potentials of periocular muscles and brain, the registered implicit time peak has increased by 5-10 ms(26). Adjusting these values, P1 and N1 waves presented implicit time peaks compatible with those described for the early components of the flash VEP (waves 1 and 2)(2,9). The origin of the early components of flash VEP is controversial. Consi-dering the mean P1 implicit time peak of 23 ms and adjusting it for artifacts related to low-pass filter, this electrical potential is similar to those described for the optic nerve, around 10 ms(3). Likewise, the
mean N1 implicit time peak, considered the AxEvg main wave(8), has characteristics similar to the potentials generated from the retinal ganglion cells(14,19). Moreover, as the AxEvg technique invol-ves monocular light stimulation, the rising wainvol-ves have pre-chias-matic origin and, thus, the potential recorded should not be confused with subcortical potentials originated in the post-chias-matic area, with implicit time peaks of less than 30 ms(6).
The purpose of the present study was to validate the AxEvg technique and to establish its normal values. As electrical waves were constant and reproducible in all normal eyes and the study involved a wide range of participants from different age groups, ethnicity and genders, we suggest that these values may be con-sidered normative for the entire population. However, we must point out some limitations: a) the pediatric population, due to its characteristic neurological maturation in the first years, should be studied in greater details; b) no racial distinction was made and analysis regarding different ethnical groups may present different results; and c) only normal subjects were studied. Therefore, further studies are needed and ongoing research protocols involving different neuroretinal disorders may better define AxEvg clinical indications.
CONCLUSIONS
AxEvg can be considered a modality of flash VEP capable of generating constant and reproducible electrical potentials, charac-terized by an initial positive wave (P1) followed by a negative wave (N1) of greater amplitude. The AxEvg electrophysiological charac-teristics suggest that P1 wave represents an electrical potential arising from the optic nerve and the N1 wave represents a respon-se of inner retinal layers, possibly the ganglion cell layer. Thus, AxEvg is an easily performed non-invasive electrophysiological test that can be employed in clinical practice to detect lesions of the optic nerve and inner retina, and it can be used in electrophysio-logical workup alone or combined with other tests to better cha-racterize the nature of visual impairment.
ACKNOWLEDGMENTS
We are grateful to the ophthalmic techniques Erika Pires, Priscila Moraes Mendes and Fabrícia Simplício, for performing the electrophysiological tests and for always being available to assist the patients enrolled in the present study.
REFERENCES
1. Adrian ED, Matthews BH. The interpretation of potential waves in the cortex. J Physiol. 1934;81(4):440-71.
2. Ciganek ML. The EEG response (evoked potential) to light stimulus in man. Electroen-cephalogr Clin Neurophysiol. 1961;13(2):165-72.
3. van Hasselt P. A short latency visual evoked potential recorded from the human mastoid process and auricle. Electroencephalogr Clin Neurophysiol. 1972;33(5): 517-9. 4. Spire JP, Hosobuchi Y. Depth electrode recording of the VER from the geniculate region
in man. Electroencephalogr Clin Neurophysiol. 1980;47(1):8.
5. Vaughan HG Jr, Gross CG. Cortical responses to light in unanesthetized monkeys and their alteration by visual system lesions. Exp Brain Res. 1969;8(1):19-36.
6. Harding GFA, Rubinstein MP. The scalp topography of the human visually evoked subcortical potential. Invest Ophthalmol Vis Sci. 1980;19(3):318-21.
7. Ikeda H, Tremain KE, Sanders MD. Neurophysiological investigation in optic nerve disease: combined assessment of the visual evoked response and electroretinogram. Br J Oph-thalmol. 1978;62(4):227-39.
8. Sabadel A, Dalens H, Sole P. [Axonal electrovisiogram. Recording technic-clinical value]. Bull Soc Ophtalmol Fr. 1983;83 (5):739-44. French.
9. Harding GF. History of visual evoked cortical testing. In: Heckenlively JR, Arden GB, editors. Principles and practice of clinical electrophysiology of vision. Cambridge: The MIT Press; 2006. p.15-20.
10. Sole P, Dalens H, Sabadel A. [Axonal electrovisiogram in optic nerve pathology]. Bull Soc Ophtalmol Fr. 1983;83(10):1169-78. French.
12. Holder GE, Brigell MG, Hawlina M, Meigen T, Vaegan, Bach M; International Society for Clinical Electrophysiology of Vision. ISCEV standard for clinical pattern electroretino-graphy 2007 update. Doc Ophthalmol. 2007;114(3):111-16.
13. Costa JG. Potencial evocado visual. In: Dantas AM, Costa JG, Pacini Neto L, Yamane R, Elias CA, editores. Eletrofisiologia ocular. Rio de Janeiro: Cultura Médica; 1995. p.227-59. 14. Fahle M, Bach M. Origin of the visual evoked potentials. In: Heckenlively JR, Arden GB,
editors. Principles and practice of clinical electrophysiology of vision. 2nd ed. Cambridge:
The MIT Press; 2006. p.207-34.
15. Lam BL. Electrophysiology of vision: clinical testing and applications. Boca Raton: Taylor & Francis; 2005.
16. Halliday AM, Mushin J. The visual evoked potential in neuroophthalmology. Int Oph-thalmol Clin. 1980;20(1):155-83.
17. Brigell MG. The visual evoked potential. In: Fishman GA, Birch DG, Holder GE, Brigell MG, editors. Electrophysiologic testing in disorders of the retina, optic nerve, and visual pathway. 2nd ed. San Francisco: The Foundation of the American Academy of
Ophthal-mology; 2001. p.237-79.
18. Brigell M, Celesia GG. Electrophysiological evaluation of the neuro-ophthalmology patient: an algorithm for clinical use. Semin Ophthalmol. 1992;7(1):65-78.
19. Fahle M, Skrandies W. An electrophysiological correlate of learning in motion perception. Ger J Ophthalmol. 1994;3(6):427-32.
20. Lenassi E, Likar K, Stirn-Kranjc B, Brecelj J. VEP maturation and visual acuity in infants and preschool children. Doc Ophthalmol. 2008;117(2):111-20.
21. Benavente I, Tamargo P, Tajada N, Yuste V, Oliván MJ. Flash visually evoked potentials in the newborn and their maturation during the first six months of life. Doc Ophthalmol. 2005(2-3);110:255-63.
22. Leaf AA, Green CR, Esack A, Costeloe KL, Prior PF. Maturation of electroretinograms and visual evoked potentials in preterm infants. Dev Med Child Neurol. 1995; 37(9):814-26. 23. McCulloch DL, Skarf B. Development of the human visual system: monocular and
binocular pattern VEP latency. Invest Ophthalmol Vis Sci. 1991;32(8):2372-81. 24. Moskowitz A, Sokol S. Developmental changes in the human visual system as reflected by the
latency of the pattern reversal VEP. Electroencephalogr Clin Neurophysiol. 1983;56(1):1-15. 25. Porciatti V. Temporal and spatial properties of the pattern-reversal VEPs in infants below
2 months of age. Hum Neurobiol. 1984;3(2):97-102.