E
SSAYS ON
H
EALTH
E
CONOMICS
:
E
QUITY AND
A
CCESS TO
H
EALTH
C
ARE AND
P
UBLIC
H
OSPITAL
P
ERFORMANCE UNDER
C
ORPORATIZED
MANAGEMENT
by
César Alberto dos Santos Carneiro
A thesis submitted in fulfilment for the degree of Doctor of Economics in the
Faculty of Economics, University of Porto
Thesis Adviser: Professor Doutor Nuno Sousa Pereira
À minha mulher Helena e ao meu filho Gabriel Ao meu pai, à minha mãe e ao meu irmão
B
IOGRAPHICALN
OTEI was born in March 1981, in Porto, Portugal, a city that as been the focal point of all my academic, professional and personal life. I’m married since 2009 and just about to have my first child.
In my first years of education I was taught at ‘Externato de Camões’, a private school with a rigorous and demanding education style that I now acknowledge as having been determinant for all my academic course. My high school years were spent in public school, in the pre-specialized field of economics and social sciences, having completed this block of years with a classification of 18 in a scale up to 20.
In 1999 I was admitted in the undergraduate course in Economics at the Faculty of Economics of the University of Porto (FEP). I finished this 5-year course in 2004 with the final classification of 14. The excellent professors I encountered in the faculty and the vast curricula of this course impelled me to proceed to graduate studies in this field. Thus, in September 2004 I was admitted to the ‘Master’s in Economics’ postgraduate course at FEP. In that same year I simultaneously began to work at the marketing department of one of the most important telecommunications companies in Portugal, Optimus SA. I worked there for one year, a period during which I completed the curricular part of the Master’s with a classification of 15.
In September 2005 I was admitted to the Doctoral programme in Economics at FEP and since then I’ve completed the curricular part of the programme with a classification of 16 and prepared the present thesis on the field of Health Economics.
My interest for the Health Economics field is mainly due to my following professional position, at the Portuguese Health Regulation Authority. Since January 2006 up to the present day I’ve been at the Authority, where my work has been much diversified but mainly centred in research activities on the themes of access to heath care, discrimination of patients and competition policy. Since 2006 I also teach Macroeconomic Policy and International Finance in undergraduate courses at the Institute of Financial and Fiscal High Studies (IESF) in Vila Nova de Gaia, Portugal.
A
CKNOWLEDGEMENTSI would like to thank Professor Nuno Sousa Pereira for his help and guidance, and most of all for his belief in my work and support at difficult times. This thesis is also a product of his work.
I would also like to thank Professor Álvaro Almeida of the FEP, with whom I have shared almost all my professional life, and who has taught me so many invaluable things that helped me shape myself both in academic, professional and personal terms. Of several other people who in some way contributed to help me in this task, I would like to name just a few: Professor Manuel Mota Freitas and Professor Paula Sarmento (FEP), Professor Carlos Costa and Professor Silvia Lopes (ENSP – National School of Public Health, Lisbon) and Professor Rachel Werner (University of Pennsylvania, US). Finally, I must acknowledge the support of the Portuguese Health Regulation Authority, where I’ve been given the privilege, since 2006, to participate in the shaping of the health sector in Portugal, a task that definitely played an important role for my academic achievements.
T
ABLE OFC
ONTENTSBIOGRAPHICAL NOTE... i
ACKNOWLEDGEMENTS... ii
TABLE OF CONTENTS... iii
PREFACE... v
ESSAY 1: THE CORPORATIZATION OF NHSHOSPITALS IN PORTUGAL:COST CONTAINMENT, MORAL HAZARD AND SELECTION... 1
1. Introduction... 2
2. Literature review... 4
3. The corporatization of NHS hospitals ... 7
4. Empirical analysis... 8 4.1. Dependent variables... 8 4.2. Control variables... 15 4.3. Introduction of SA management... 17 4.4. Econometric model... 18 5. Sample ... 20
6. Summary description of the effects of SA management ... 21
7. Results ... 25
8. Discussion... 43
Appendix ... 46
References... 48
ESSAY 2: “AGEISM” AND “SEXISM” IN PORTUGUESE NHSHOSPITALS:DIFFERENCES IN TREATMENT OF PATIENTS WITH ACUTE MYOCARDIAL INFARCTION BASED ON AGE AND SEX. 54 1. Introduction... 55
2.1. The benchmark case: benevolent doctor with complete information ... 58
2.2. Prejudice: ageism and sexism ... 59
2.3. Rational profiling... 61
3. Empirical evidence on disparities in the treatment of cardiovascular diseases ... 63
4. Empirical analysis... 65
4.1. Objectives and study design ... 65
4.2. Variables and measures ... 67
4.3. Disease Staging... 70
4.4. Data... 74
5. Results ... 78
6. Welfare implications of disparities of treatment based on gender... 82
7. Testing for statistical discrimination... 88
8. Conclusions... 96
Appendix 1 ... 98
Appendix 2 ... 100
Appendix 3 ... 102
References... 104
ESSAY 3: HOSPITALIZATION OF AMBULATORY CARE SENSITIVE CONDITIONS AND ACCESS TO PRIMARY CARE IN PORTUGAL... 110
1. Introduction... 111
2. A model of access to health care ... 115
2.1. Background... 115
2.2. The model ... 116
3. Empirical analysis of ACSC rates ... 119
4. Discussion... 131
P
REFACEThis thesis, submitted in fulfilment for the degree of Doctor of Economics, is centred in the field of Health Economics. The scope of Health Economics is considerably large, ranging from the study of the functioning of healthcare systems to individual and social causes of health affecting behaviours. However, some specific topics are currently arising as particularly important, capturing not only the interest of many researchers, but also policy makers and actors of the healthcare sector.
One of such topics concerns hospital performance in terms of cost containment and compliance with regulatory norms regarding the legal rights and legitimate interests of patients, especially when such hospitals are undergoing important reforms in terms of payment systems or management objectives. In fact, since the 1980s, several countries have been introducing financial incentives and management performance objectives in the relationship between funders and providers of healthcare (public and private). Such mechanisms, were thought to induce efficient management behaviour, in order to achieve better resource allocation, and in most cases, to contain the escalation of costs with the health system. However, many of these mechanisms designed to encourage efficiency comprise simultaneously and implicitly, some compensation for the selection of patients with lower expected treatment costs (creaming) and the rejection of patients with higher costs (dumping), and a perverse incentive for reduction of service costs through cutbacks in quality of the services provided, in ways not observable by consumers (moral hazard on the supply side).
Another important topic of Health Economics, with growing relevance, is the study of access to healthcare. Because access to healthcare is a central policy objective in most health systems, there is the need to adopt a conceptual definition of access, which allows the formulation of policies to promote access to healthcare and the monitoring of the results of these policies. In many health systems access is a concept more political than operational, lacking a comprehensive definition that comprises all components of access. For this reason, policy measures tend to be heterogeneous, uncoordinated and
sometimes contradictory. On the other hand, systems based on different access concepts are hardly comparable in terms of performance.
Additionally, promoting equitable access to healthcare is also increasingly one of the main objectives of most health systems. A common interpretation of equity leads us to the concept of horizontal equity, according to which equal medical care should be provided to individuals with equal needs. The corollary of this definition is that equity requires the provision of care to be based on the needs of populations, and not on the basis of area of residence, wealth or income, race or age of populations. The most frequently studied healthcare disparities, and more immediately associated with the concept of equity, are those that derive from the socio-economic status of individuals. More recently a distinct body of literature as arisen, focusing on disparities in care received by different ethnic and racial groups, and less frequently, on differences in healthcare utilization and type of care based on sex and age of individuals.
In face of these facts, we chose to focus our research activities in the topics of hospital performance, specifically public hospitals undergoing management reforms, equity of healthcare received by patients with different sex and age, and the concept and measures of access to healthcare.
The thesis is composed of three independent essays on such central topics of theoretical and empirical work in the field of Health Economics, as mentioned above.
In the first essay, we study the impacts of the introduction of corporatized management in Portuguese National Health Service hospitals in terms of cost, quality of services and access. We do this by comparing hospitals that were transformed into public for-profit corporations and hospitals that remained in the traditional public service format, in terms of the evolution of selected indicators over a period of nine years.
The second essay addresses the theme of discrimination of patients on the basis of gender and age. We analyze the impact of sex and age of patients in the probability of receiving intensive treatment for Acute Myocardial Infarction (AMI) within Portuguese National Health Service hospitals. Based on a theoretical model that explains health care disparities through the arguments of taste-based discrimination and statistical
discrimination, we also present an empirical test of statistical discrimination as the underlying mechanism for the discrimination of women in terms of treatment for AMI. In the third essay we analyze small area variation in hospitalization rates for Ambulatory Care Sensitive Condition (ACSC), which are commonly described as medical conditions for which timely and appropriate outpatient care can help reduce the risk of hospitalization. With a framework that allows us to explicitly address and describe barriers faced by patients when accessing services, we conducted an empirical application examines data of hospitalizations in public hospitals and characteristics of the public primary care delivery system in small areas of Portugal in 2007.
E
SSAY1
The Corporatization of NHS Hospitals in Portugal: Cost
Containment, Moral Hazard and Selection
Abstract
We study the impacts of the introduction of corporatized management in Portuguese National Health Service hospitals in twelve selected indicators of cost, quality and access to inpatient care, over a period of nine years, comparing hospitals that were transformed into public for-profit corporations (SA hospitals) and hospitals that remained in the traditional public service format (SPA hospitals). Exploration of panel data allowed us to take into account the starting position of hospitals, focusing the study on the identification of the specific effects of the conversion of hospital management. Our results point to globally positive impacts associated with the management change, not supporting the premise that the introduction of profit and performance targets in public hospitals has adverse effects of reduced quality and decreased access. On the other hand, there seems to be some evidence that supports the theory that the coexistence of hospitals with and without profit orientation results in both having similar styles of practice because the non-profit hospitals establish standards of conduct that for-profit hospitals follow.
The Corporatization of NHS Hospitals in Portugal: Cost
Containment, Moral Hazard and Selection
César Alberto dos Santos Carneiro [email protected]
1. Introduction
Since the 1980s, several countries have been introducing financial incentives and management performance objectives in the relationship between funders and providers of health care (public and private). Mechanisms such as the prospective payment system or capitation payment system for hospital production, and assessments of compliance with management objectives by hospital managers, were thought to induce efficient management behaviour, in order to achieve better resource allocation, and in most cases, to contain the escalation of costs with the health system.
However, many of these mechanisms designed to encourage efficiency, by promoting the search for good financial results, comprise simultaneously and implicitly, some compensation for the selection of patients with lower expected treatment costs (creaming) and the rejection of patients with higher costs (dumping), and a perverse incentive for reduction of service costs through cutbacks in quality of the services provided, in ways not observable by consumers (moral hazard on the supply side). In Portugal, the shift in the management of public national health service (NHS) hospitals, from the traditional bureaucratic management of public services (Sector Público Administrativo – SPA) to for-profit management of publicly held enterprises (Sociedade Anónima – SA), aimed at introducing a package of incentives for efficiency in hospital management. Potential gains of such shift and potential negative effects in terms of patient selection and quality skimping have not been fully quantified. Thus, rigorous analytical work is needed to make a concise evaluation of the goodness of the transformation.
The aim of this work is to measure the impacts of the change in the management of NHS hospitals (from SPA to SA) on hospital costs, access and quality of services
provided. The analysis is based on data from inpatient production of a set of 58 NHS hospitals, over a period of nine years (1998 to 2006), a panel that includes hospitals which remained SPA during the analysis period (control group), and hospitals that were transformed into SA during this period. With this information, taking the hospital as the unit of analysis, we estimated the impacts of the introduction of SA management in cost and efficiency indicators (cost per patient, cost per day and average length of stay in hospital), access indicators (case-mix index and admission rate of patients with “social case” diagnosis) and indicators of quality in terms of processes (percentage of caesarean sections in total deliveries, rate of utilization of intensive methods in the treatment of acute myocardial infarction and rate of cholecystectomies by laparoscopic surgery) and in terms of outcomes (incidence of decubitus ulcers as secondary diagnosis, incidence of complications related to surgical procedures, total mortality rate and mortality rate in patients with acute myocardial infarction). The use of panel data allows us to mitigate potential issues of bias in the selection of hospitals that were transformed into SA, as well as to control for specific characteristics of each hospital.
From the results of the analysis we conclude that there are observable impacts associated with the change of hospital management type, impacts that can be considered globally positive. On for-profit public hospitals, the average cost of an inpatient episode is lower, and the average length of stay by patients on inpatient care is also significantly lower. Most indicators of outcomes show improvements in hospitals with SA management, and we didn’t found evidence of changes in the case-mix of hospitals that can be attributed to this management shift. We also conclude that SA hospitals use intensive forms of treatment for acute myocardial infarction more often and perform fewer births by caesarean section. Less positive is the fact that SA hospitals decrease the admission of patients with a diagnosis of “social case”. Some of the impacts found are only statistically significant in the first year of for-profit management, suggesting a catching up effect by hospitals that remained with SPA management to a performance similar to that of SA hospitals.
These results do not seem to support the premise that the introduction of profit and performance targets in management of public hospitals has adverse effects of reduced quality and decreased access. On the other hand, the modest impacts noticed in some of
the indicators after a brief period of greater differences, seem to sustain the theory that the coexistence of hospitals with and without focus on profit leads to both having similar styles of practice, since the non-profit hospitals establish standards of conduct that for-profit hospitals follow.
This work is organized as follows: in section 2 we review some important literature on the impacts of efficiency incentives in the hospital sector; in section 3 we describe the institutional change in the management of Portuguese NHS hospitals from SPA to SA; section 4 presents the methodology of the empirical analysis carried out, from the variables to the estimation methods; the sources of all information used and the construction of the sample are detailed in section 5; a graphical and differential analysis of raw data is made in section 6; in section 7 we present the results of the statistical analysis; and section 8 closes with the discussion of the results, merits and limitations of this study.
2. Literature review
Beyond conventional intuition, several researchers have theorized and demonstrated empirically that health care providers do not have incentives for reducing (or at least controlling) their costs when they know that the funder fully reimburses them proportionally to the resources spent (Newhouse, 1970; Feldstein, 1971; Evans, 1974; Ellis and McGuire, 1986; Weisbrod, 1991). As Frank and Lave (1989) noticed, the variety of mechanisms introduced to control hospital costs include regulating hospital expenditures in capital, increasing competition in markets, increasing consumer participation in the payment of costs and changing how hospitals are paid.
In order to create incentives to reduce costs, prospective payment systems were implemented, in which providers receive a fixed amount per patient treated with a particular pathology (or group of diseases), regardless of the actual costs that result from the treatment of patients. This form of payment for hospital production induces greater efficiency in the allocation of resources in hospitals, as shown by Ellis and McGuire (1986, 1993), or Ma (1994). However, in a context of information asymmetry,
such payment systems comprise perverse incentives. Given the pressure imposed by financial incentives, hospitals can achieve cost reductions in forms that are not based in efficiency gains, such as reducing the quality of care, reducing the intensity of care (i.e., reducing the amount of resources devoted to each patient), rejecting patients with higher expected treatment costs (patient selection) or disinvesting in areas that are likely to attract patients with greater intrinsic financial risk1 (Freiman et al., 1989; Hodgkin and McGuire, 1994; Ma, 1994; Ellis and McGuire, 1996).
The transition from cost reimbursement to prospective payment in the Portuguese NHS hospital sector begun in 1981. The effects of this transition on the performance of public hospitals, between 1984 and 1994, were studied in Lima (2000). The author concluded that the introduction of a prospective component in the hospital payment scheme contributed to significant reductions in costs per patient admitted. Lima (2000) analyzes the efficiencies of this transition but does not address the problem of quality/intensity reduction in services and patient selection.
Some less numerous and more recent studies analyze specifically how the type of ownership and management influences hospital performance. Most of this work is based on comparison of measures of efficiency, quality and access, between hospitals with and without profit objectives. Empirical evidence on this topic isn't clear. Some studies show that, on average, for-profit hospitals have a lower performance in terms of quality of care than non-profit hospitals and provide less access to users with higher treatment costs or users with less financial capacity (Gowrisankaran and Town, 1999; McClellan and Staiger, 2000; Silverman and Skinner, 2001).
However, other researchers conclude that differences between hospitals with and without profit objectives in terms of costs, quality and access are barely noticeable (Marsteller, Bovbjerg and Nichols, 1998; Sloan, 2000). Marsteller, Bovbjerg and
1 Patient selection can arise in a context of heterogeneity of patients in terms of severity of illness.
Patients with a higher degree of severity are those which are expected to have more expensive treatments, compared to the average patient. When the expected cost of treating a patient exceeds the contracted payment, the provider has the incentive not to treat that patient, or reduce the quality (and cost) of care provided. Ellis (1998) notes, however, that this argument only applies to differences in severity of illness that are not reflected in the payment system, but that the provider can observe. This situation is likely in a scenario in which the provider has more information on the degree of severity and expected costs of patients than the payer.
Nichols (1998) suggest that the similarities between hospitals with and without profit orientation may arise because non-profit hospitals establish standards of conduct that for-profit hospitals follow to some extent. Duggan (2000) concludes that the type of ownership of a hospital influences its response to opportunities to make profit, and that the distinction between public and private seems more relevant than between for-profit and non-profit, since smooth financial constraints for public hospitals reduce the impact of financial incentives.
Other studies specifically try to identify the effects of the conversion of hospitals at the level of management or ownership type. Picone et al. (2002), for example, find evidence that the conversion of public hospitals and non-profit private hospitals into profit-oriented hospitals reduces the quality of patient care, at least temporarily. Comparing hospital behaviour before and after changes in the type of management or ownership, Sloan (2000) concludes that the occurrence of the change itself is more important than the type of change.
In Portugal, the public hospital sector reform towards a profit oriented management consisted, in practice, in the introduction of incentives for efficiency of management of hospitals. To assess the experience of creation of SA hospitals in terms of efficiency, equity, access and quality, the Portuguese Government created the Commission for the Evaluation of SA Hospitals (CAHSA) in 2006. Generically, this Commission concluded that SA hospitals achieved efficiency improvements, without reducing the levels of quality and access to care. However, they also pointed out deficiencies and practical limitations to the incentives in such hospitals, for example, in terms of human resources management, treasury management, or the application of efficiency gains.
The issue of selection in Portuguese NHS hospitals was studied in Cabral (2005). The author analyzed the practices of patient admission in NHS hospitals, within a period preceding the introduction of SA management, evidencing the differences between central, district, level-1, university and oncology hospitals, in terms of severity and complexity of admitted patients.
Costa and Lopes (2005), based on information from discharge records of a set of NHS hospitals in the period of 2000 to 2004, computed clinical performance indicators for a
group of SA hospitals and a group of SPA hospitals. They concluded that after two years of maturity, the shift towards profit oriented management hadn’t contributed to a decrease in access to health care. However, the conclusions were drawn without an analysis of the significance of changes over time and of differences between SA and SPA hospitals. Giraldes (2007) computed an aggregate index of efficiency, based on management indicators such as cost per user in different hospital production areas, and a quality aggregate index, based on the percentage of ambulatory surgeries in total surgeries, the rate of caesarean sections in total deliveries, the rate of autopsies and the incidence of surgical infections in surgical procedures. The author points out that publicly held corporative hospitals occupy better position than SPA hospitals in terms of the ordering of hospitals on the aggregate efficiency index. This study also lacks, however, an analysis of significance of the differences between the two groups of hospitals. Moreira (2008) evaluated the impacts of the corporatization of NHS hospitals on technical efficiency, without considering quality or access indicators. Using non-parametric methods, the author analyzed SA and SPA hospitals in the period of 2001 to 2005, concluding that SA hospitals had statistically significant efficiency gains vis-à-vis SPA hospitals, although of modest amplitude. Finally, Afonso and Fernandes (2008), also with non-parametric methods, estimated technical efficiency measures for 68 hospitals during the period of 2000 to 2005. Also in this study little attention is devoted to the differences between SA and SPA hospitals.
3. The corporatization of NHS hospitals
In Portugal, the corporatization of NHS hospitals begun in December 2002 when 31 public hospitals were taken from under the direct administration of the Government and transformed in profit-oriented corporations, with the aim of organizing the delivery of care subject to cost control and efficiency in the allocation of resources.
Corporatized (SA) hospitals remain public property (100% owned by the state), but differ fundamentally from SPA hospitals in terms of management instruments at its disposal. These hospitals acquire administrative and financial autonomy, have professionalized and independent boards of directors, accountable to the Ministry of
Health through predetermined operational and financial contracted objectives, and have freedom to hire human resources under private labour contracts.
The administrative and financial separation from its main funder (the State, through the NHS) is put in practice with funding being attributed through contracts between the Ministry of Health and each hospital. In such contracts, the NHS and the hospital agree on quantities and types of services, based on the actual production of each hospital per line of production and estimated needs for the population, and agree on the prospective payment for the overall contracted production. This logic is opposite to the traditional model of global budget with total reimbursement of costs, and constitutes an important feature – although not the only one – of the public hospital sector reform.2
These changes aimed at creating incentives and provide NHS hospitals with the means to have a more efficient management. However, the degree of autonomy and independence provided by this new type of management in public hospitals, justifies that the evaluation of this policy measure be centred on the theoretical proposition that the introduction of incentives for efficiency and improved financial performance may simultaneously lead to perverse effects of reduced quality and intensity of services provided (moral hazard by the provider), or the selection of most profitable patients.
4. Empirical analysis 4.1. Dependent variables Cost and efficiency
In order to assess the effects on the costs of inpatient activity, we defined two indicators: cost per hospitalized patient and cost per inpatient day, both in euro deflated for 2000 with the public expenditure deflator. The impact of the management change on these indicators gives us an indication of the effects of SA management in terms of cost efficiency. Lima (2000) similarly uses these two indicators as hospital performance measures in terms of cost containment. Giraldes (2007) also includes the cost per user in
different hospital production lines (inpatient care, emergency department, ambulatory treatments and outpatient consultations) in an aggregate efficiency index.
With concern to efficiency of hospitals, we also analyzed the impact in the average length of stay (ALOS). Though not a direct measure of cost, the ALOS gives us an indication of resource usage, and therefore, it is widely used as a proxy for technical efficiency (Brownell and Roos, 1995; Martin and Smith, 1996; Lima, 2000; Kroch et al., 2007).
This variable as also been used by several researchers as a proxy for the intensity of services provided (level of resources devoted to each inpatient case), where declines in ALOS were interpreted as indicating quality skimping (Penchansky and Thomas, 1981; Guterman and Dobson, 1986; Hadley et al., 1987, 1989; Frank and Lave, 1989; Freiman et al., 1989). However, more recent literature favours the interpretation of declines in ALOS as representing gains in efficiency. Such changes in the length of stay may signify improved ability of hospitals to stabilize patients more quickly, or a trend toward discharging patients earlier and caring for them in outpatient, home, and other non-hospital settings, which would be consistent with more efficient care (Kroch et al., 2007).
In fact, as Cutler at al. (2000) point out, reducing length of stay has been a widely targeted goal for managed care utilization review in the United States (U.S.). According to Black and Pearson (2002), the English NHS responded to rising numbers of hospital admissions and delays in access to care by promoting reductions in the ALOS for each admission. These reductions were achieved by increased use of day surgery and the recognition that earlier discharge in many conditions was not dangerous and may often be better for the patient. Kroch et al. (2007) advocate that reducing the ALOS by increasing the occupancy rate in hospitals would enable the turnover rate to increase and would extend hospital benefits to a greater number of people to benefit from hospital services.
More importantly, we must note that reducing the ALOS of admissions was defined by the Portuguese Ministry of Health as one of the targets for SA hospitals, being included in contracts as a performance indicator in terms of efficiency of services.
Quality
To assess the effect of moral hazard, we analyzed indicators of quality in terms of processes and outcomes.
Quality in processes or procedures is related to the choices regarding methods/regimes of treatment, when these are not entirely dictated by purely clinical reasons. To measure quality in processes, we computed three indicators: the proportion of caesarean sections in total deliveries, the rate of utilization of “intensive” procedures for the treatment of acute myocardial infarction and the rate of cholecystectomies performed by laparoscopic surgery.
According to the World Health Organization (WHO), high rates of births by caesarean section are an element of concern because they increase the potential for complications for the mother and the newborn (WHO, 2006).3 Whenever there is not a clinical indication to the contrary, normal births (vaginal births, or eutocia) are considered preferable to caesarean section (dystocia) because they are associated with less risk of complications (since caesarean section is a surgery). However, the choice of type of delivery can be influenced by other factors of non-clinical nature. In addition to the preferences of each mother, there are factors related to the care provider, such as insufficient technical and human capacity to assist the normal delivery, hospital structure unfavourable for monitoring of labour and a greater knowledge of the caesarean surgery technique (de Regt et al., 1986; Mould et al., 1996; Roberts et al., 2000) that may induce the choice for the surgical approach. In fact, a normal childbirth is generally considered a more intensive process than the caesarean section (Gruber et al., 1999; Altman et al., 2003). As such, a more reduced percentage of caesarean sections in total deliveries is often interpreted as an indicator of increased quality in
3 There are immediate complications associated with caesarean section, such as bleeding, accidental
lacerations, puerperal infections, pulmonary embolism, paralytic ileus, adverse reactions to the anesthesia, longer and more painful recovery and difficulties in breastfeeding. In the long run, the caesarean section is associated with sexual dysfunction problems and depression, and can have a negative effect on future pregnancies.
health care.4 CAHSA (2006) and Giraldes (2007) use this indicator with similar interpretation to assess the quality of Portuguese NHS hospitals.5
As explained in Cutler et al. (1998, 2000), the treatment of acute myocardial infarction (AMI) can generally be divided into two broad categories: treatment with invasive techniques and medical treatment without invasive techniques. These two blocks of treatment for AMI include the following treatment options, from the most to the least intensive: cardiac catheterization6 followed by coronary artery bypass graft (CABG) surgery7, cardiac catheterization followed by percutaneous transluminal coronary angioplasty (PTCA)8, catheterization without any other invasive procedure and a set of
other non-invasive procedures (medication, monitoring, …). Following the methodology of Altman et al. (2003), we have grouped CABG and PTCA procedures as “intensive” treatment options, and simple cardiac catheterization and other non-invasive treatments as “non-intensive” options. As so, the indicator of quality in processes we computed is the proportion of AMI admissions who have received intensive treatment. Finally, also as an indicator of quality in terms of processes, we analyzed the impacts of the shift in hospital management on the laparoscopic cholecystectomy rate. Cholecystectomy is the surgical removal of the gallbladder. It is the most common method for treating patients suffering from cholecystitis (infection and inflammation of the gallbladder) or cholelithiasis (gallstones). There are two possible treatments to remove the gallbladder: “open cholecystectomy” and “laparoscopic cholecystectomy”. Laparoscopic cholecystectomy is a less invasive treatment performed through small incisions, whereas open cholecystectomy is a more invasive treatment performed through a single large incision (Siciliani, 2006). Since laparoscopic cholecystectomy
4 We only considered deliveries resulting in live births, since these concern, in principle, to episodes of
pregnancy with lower incidence of complications. Such complications may impose greater clinical restrictions to the choice of type delivery.
5 The WHO has recommended since 1985 that the rate of caesarean sections not exceed 10–15%, since
this is the percentage of caesareans justified by medical reasons. In every hospital and in every year in our sample, the caesarean section rate is above 15%. Thus, considering this reference rate as the optimal rate, any decline towards this reference level must be, in aggregate terms, interpreted as a welfare gain.
6 Cardiac catheterization is an invasive diagnostic procedure in which a contrast fluid is injected into the
arteries of the patient to determine the location and size of blocking.
7 Coronary artery bypass graft surgery consists of replacing the blocked artery segment by a non-affected
artery segment of another location in the body.
8 The angioplasty procedure consists of inflating a small balloon inside the affected artery in order to
causes less pain, quicker healing, improved cosmetic results, shorter hospital stay and lower probability of death, when compared to open cholecystectomy, it is considered a better quality process (Gadacz, 1991). Thus, we computed this indicator as the number of laparoscopic cholecystectomy procedures on total number of discharges with cholecystectomy procedure (laparoscopic and open). Following the Agency for Healthcare Research and Quality (AHRQ)9 definition, we considered only discharges with age 18 years and older, and also only uncomplicated cases, and excluded cases with diagnose group 14 (pregnancy, childbirth, and puerperium).
To assess the impacts of SA management in terms of quality in outcomes, we used the hospital total mortality rate, the incidence of decubitus ulcers as secondary diagnosis, the incidence of complications after surgical procedures and the mortality rate in patients who suffered AMI.
Hospital total mortality rate was defined as the proportion of admissions registered with “deceased” as the destination after discharge, and its interpretation as a quality indicator is straight forward.
Decubitus ulcers (or pressure ulcers) are lesions resulting from an inadequate blood flow, which arise in areas where the skin has been pressed during a large period of time, by a bed or wheelchair, for example. Its appearance during hospitalization is often interpreted as a result of less attentive care on behalf of the nursing staff, failing to assist patient repositioning and inspection of susceptible areas of the skin. Hence, the incidence of decubitus ulcers is usually interpreted as a result of lower quality care (Sooda et al., 2008; Needleman et al., 2005; Kaestner and Guardo, 2008).
The incidence rate of complications after surgical procedures relates to inpatient episodes with surgery as the main procedure, which had one of the following secondary diagnosis: postoperative infection, postoperative haemorrhage or hematoma, disruption of operation wound, accidental puncture or laceration during a procedure and foreign body accidentally left during a procedure. Other alternative ways to define what can be
9 The AHRQ is the health services research arm of the U.S. Department of Health and Human Services,
charged with improving the quality, safety, efficiency and effectiveness of health care. The agency defines quality indicators to measure various aspects of health care quality based on hospital inpatient administrative data.
included in the indicator of “surgical complications” can be found in Costa and Lopes (2005), CAHSA (2006) or Giraldes (2007).
Finally, we analyzed the mortality rate specifically in patients with diagnosis of AMI, as an indicator of quality in outcomes. As studies show, appropriate treatment of AMI can substantially reduce 30-day mortality. Furthermore, AMI is considered a condition for which the quality of care provided by the hospital has a significant impact on patient health outcomes (McClellan and Staiger, 1999). Thus, the mortality in AMI patients is widely used as an indicator of quality of health care in terms of outcomes (Krumholz et al., 1999; Shen, 2003). We computed it as the incidence of discharges coded as “deceased” on cases with AMI as principal diagnosis. We excluded from the numerator and denominator of this ratio records of incomplete admissions, i.e., admissions that where transferred to another hospital, and also cases with diagnose group 14 (pregnancy, childbirth, and puerperium).
Access
To assess the selection effect, we analyzed two indicators: the case-mix index and admissions with a diagnosis of “social case”.
The degree of complexity of patients admitted to hospitals can be used as an indicator of patient selection behaviours on behalf of health care providers, to the extent that patients with higher degree of complexity will, in principle, require greater expenditure of resources for treatment. Thus, given a fixed payment scheme (or at least, with some fixed component), such patients will represent greater financial risk to hospitals (Altman, 1990; Gilman, 2000). In this study, because the econometric analysis is done at the hospital level, we used an indicator that synthesizes the average degree of complexity of patients admitted to hospitals, the case-mix index (CMI).1011
10 The Central Administration of the Health System (ACSS) defines the CMI as a weighting coefficient of
hospital production which reflects the relativity of a hospital vis-à-vis others, in terms of the complexity of its cases, computed as the ratio between the number of patients of each DRG, weighted by their relative weights, and the total number of hospital patients (Circular Normativa n.º 2 de 16 de Fevereiro de
2007, http://www.acss.min-saude.pt/).
11 The phenomenon of selection has two dimensions that can occur simultaneously or not, but that reflect
two behaviours with the same objective. One is the attraction of patients with lower degrees of severity (thus, with lower expected treatment costs) within each DRG. The second type of behaviour is the
Another access indicator we computed is the incidence of inpatient episodes with diagnoses of the category “housing, household, and economic circumstances”12, i.e. admissions that are not justified by clinical or health related reasons. This category of diagnostic is rarely the diagnosis of admission (the main diagnostic, which justifies the admission), rather appearing most of the times as a secondary diagnosis. Since we seek to quantify how often hospitals keep patients in hospital only for what can be termed “social reasons”, we only consider patients who had diagnoses of this category as the last of the secondary registered diagnosis, reducing the probability of counting patients who, in addition to the social situation, had a medical condition that justified the continuation of inpatient care. The hypothesis tested with this indicator is that in SA hospitals, the incidence of inpatient episodes with diagnoses of this category (which for simplicity we call “social cases”) will be smaller than in SPA hospitals, since the provision of such services deviates from the strict health care scope of hospitals towards a role of social service, which might affect negatively the financial performance of hospitals. In fact, from the theoretical point of view, this type of social service is associated with non-profit providers. On this subject, Marsteller, Bovbjerg and Nichols (1998) found evidence that non-profit hospitals provide more care to disfavoured people when compared to for-profit hospitals.
The tables in Appendix summarize the description of all indicators, as well as all independent variables described below.
rejection of less profitable patients, more or less explicitly (dumping of patients). In this case, we also distinguish two possible types of rejection: vertical dumping – limiting access to patients of higher severity within patients with the same pathology; horizontal dumping – limiting admission of patients diagnosed with pathologies which have a high degree of uncertainty and therefore involve greater financial risk (in case of risk-averse agents). In this study, we infer the global selection effect from the observed degree of complexity in hospitals, which does not allow us all to distinguish partial effects of cream-skimming, vertical and horizontal dumping.
12 This diagnostic category includes situations such as lack of accommodation, inadequate housing and
4.2. Control variables Demand side
In order to isolate the impact of management change in the defined indicators from other effects, we introduced a set of control variables for the demand conditions. Empirical studies at the patient level use patient characteristics (sex, race, age, degree of education) as a means of controlling conditions of demand and health care utilization by each patient. Since this study has the hospital as the unit of analysis, such control is carried out with aggregate variables that represent the aggregate demand profile in each hospital.
In the models used to estimate the effects of SA management in terms of costs and quality of care, we considered the CMI for each hospital as an explanatory variable, in order to purge from the estimation of other coefficients the effect of the degree of complexity of patients. Newhouse and Byrne (1988) had shown that the evidence of reduced intensity of care can be the result of misinterpreting changes in length of stay by patients. According to the authors, the observed reduction in length of stay, supposedly in response to the introduction of a prospective payment system, was not confirmed if they controlled the analysis for changes in the mix of patients. Hospitals paid prospectively had a reduction in the average length of stay because they reduced the admission of patients with pathologies that require more prolonged hospitalizations. Also Ellis and McGuire (1996) report that the indicators which aim at capturing moral hazard effects are simultaneously influenced by patient selection behaviour. Such argument can also be transposed to the case of unitary costs of treatment. Thus, we controlled potential effects of patient selection in cost and quality indicators with the independent variable CMI.
In order to control for the ability of individuals to pay for health care, we used an index of average purchasing power in the reference area of each hospital.13
13 In a health system almost entirely free of charge for users at the point of provision, as in Portugal, the
influence of purchasing power on the demand for care is probably reduced. However, there might be some opportunity cost and preferences effects depending on purchasing power that should be considered.
To control for the amount and type of health care needs of populations, we considered the age distribution of patients for each hospital/year (using the proportions of individuals aged 0 to 14, 15 and 24, 25 to 64 and over 65)14, and also the mortality rates of the population in the areas of influence of hospitals, in thousands.
For variables for which data from the actual patients of hospitals wasn’t available, we recurred to aggregate characteristics of the populations of the geographical area of influence of each hospital, having been defined as relevant geographical unit the municipality. In some studies on the Portuguese hospital sector (for example, Lima, 2000), the aggregate characterization of supply refers to a broader geographical unit, the district. However, we have reasons to believe that the district is an excessively broad area spanning several disparate realities, and therefore chose to confine the geographical scope of each hospital to the municipality level.15
Supply side
On the supply side, there are also some factors that can influence the performance of hospitals in terms of costs, access and quality of care, which are not directly connected to the type of hospital management, and that, consequently, must also be controlled in our study.
One of them is the size of hospitals, which allows us to control for potential economies of scale. Thus, we use number of beds (including cradles of neonatology and paediatrics) available and equipped for immediate admission of patients, as an indicator of the size of the hospital.
Another factor that we controlled is the type of hospital, which can be central, district and level-1, through dummy variables. This legal classification of NHS hospitals reflects the number of specialties that each hospital is prepared to deal with, being this number higher in central and smaller level-1 hospitals. As such, this provides us with an
14 Due to collinearity issues, we used only three variables, for ages 0 to 14, 15 to 24 and 25 to 64.
15 Note that in a study published in its website, (“Avaliação do Modelo de Celebração de Convenções
pelo SNS”) the Portuguese Health Regulation Authority concluded that for a variety of types of health care, approximately 80% of clients reside within 25 kilometers to health facilities, by which the use of the municipality as the regional unit for monitoring geographical specificities should allow properly to capture the relevant aggregate conditions of demand of each hospital.
indication of the type of production, particularly in terms of qualification of human resources and available technology at each hospital.
Also with a dummy variable, we controlled if the hospital is a university hospital, since the scope of university hospitals has additional educational objectives compared to non-university hospitals, which can have an impact on how production is organized.
The exploration of individual and time dimensions with the use of panel data allows us to control the effect of other non-observed factors, assuming that any omitted variables are time invariant. To do so, we estimated models with an unobserved individual-specific component (also called individual unobserved heterogeneity).
This is an aggregate form of controlling a series of characteristics that can affect the performance of hospitals, namely style of clinical practice. As Baumgardner (1994) and Ellis and McGuire (1996) point, doctors and hospitals often have systematic patterns of behaviour, which is called clinical practice style, that distinguishes them as providers. Most of the times, practice style cannot be captured by the observed characteristics of demand and supply, but may have an important influence on performance of providers.
Time effect
Finally, we monitored the effects of the passage of time, affecting all hospitals in the analysis, which are fixed effects by definition. This control was done through a set of dummies that identify the year of each observation.
4.3. Introduction of SA management
The shift from SPA to SA is a qualitative change in the management of NHS hospitals, and therefore a dummy variable is the adequate way to capture its effects on each of the defined indicators.
As opposed to a cross-section analysis comparing hospitals with different forms of management, focusing on the conversion of hospitals has the advantage of allowing us
to control for other relevant features, such as location of hospitals, providing a more precise identification of the effects of the type of management (Picone et al., 2002). As we mentioned earlier, SA management consists in the introduction of a set of changes to how the hospital is managed, in terms of incentives to reduce costs and improve productive efficiency, aligning the objectives of managers with those of the NHS. Therefore, a dummy variable will capture the impact of the introduction of this set of incentives as a whole, rather than the individual effect of each characteristic of SA management.
These changes happen formally when the respective legislation is enacted, which in all cases in our sample, occurred at the beginning of a calendar year. As such, and since all indicators studied relate to calendar years of the activity of hospitals, the used dummy indicates whether in a given calendar year a particular hospital had SPA or SA management. However, it is natural that the effective implementation of new methods of management occurs gradually over time. Therefore, the period of one year may not be enough for all the effects of the change to emerge. Thus, we have introduced in our models a set of dummy variables reflecting the maturity of SA management in each hospital (variables are noted in the following tables by G1, G2 and G3, respectively taking the value 1 if it’s the first, second or third or more years of SA management, and take all the value 0 when the hospital has SPA management).
4.4. Econometric model
We conducted an econometric analysis of the relationship between the binary variables that capture the shift to SA and each of the indicators of performance, controlling the considered supply and demand factors, and the effects of time. We estimated an equation for each of the 12 indicators of cost, quality and access, with the following form: it it it it t it it i it .D .S .A .G .G .G I =α +β +φ +θ +δ1 1 +δ2 2 +δ3 3 +ε
In these equations, each hospital is indexed by i and each year is indexed by t. D it represents the vector of variables that reflect the characteristics of demand for hospital i in year t. In the case of the equations for access indicators, the vector D differs from it other equations by not including the variable CMI, which is itself an indicator of access/selection. S represents the vector of supply variables of hospital i in year t, and it
t
A is a set of dummy variables that identify the year. Finally, G1 , it G2 and it G3 are it the independent variables whose effects on the indicators interest us most, since respectively these dummies assume the value 1 if hospital i in year t is on the first, second or third year of SA management, and assume all the value 0 when the hospital has SPA management. Finally, in each equation I represents the value that the studied it indicator takes in hospital i and year t.
i
α is the time invariant unobserved component, that captures the specific effect of each individual (in this case, each hospital); εit is the idiosyncratic disturbance in the econometric model, assumed with independent and identical distribution, and not correlated with D , it S , it A , t G1 , it G2 , it G3 and it αi.
If we assume that the unobserved individual component is uncorrelated with all explanatory variables, i.e. cov(X,αi)=0 (where X is any variable on vectors D , it S , it
t
A , G1 , it G2 or it G3 ), this means we have a random effects model. Alternatively, if it we relax this assumption and let cov(X,αi)≠0 for any X, we have a fixed effects model.
Since we didn’t have information that allows us to discern which of these assumptions better reflects the structure of the analyzed data, we conducted the estimation of the base-line model for all indicators with random and fixed effects estimators. Also considering the hypothesis that there is no unobserved individual-specific effect, we estimated also models by pooled OLS, an estimation procedure that does not account for any hospital-specific effects other than those already captured by the control variables in D and it S . it
We compared the robustness of the different estimation approaches with specific tests.16 We computed Hausman tests of the null hypothesis that the unobserved individual-specific component αi is uncorrelated with the regressors17, based on the comparison of
estimates from the fixed and random effects models. We also computed Breusch-Pagan Lagrange Multiplier (LM) tests, where the null hypothesis is that the variance of the unobserved individual-specific component αi is null, i.e., testing the pooled OLS model against the random effects model.18
Subsequently, we analyzed in detail the results of the most robust model for each indicator.
5. Sample
The study uses aggregate data on inpatient production and costs of 58 NHS hospitals (in the case of the variables ‘rate of caesarean sections’, ‘complications after surgery’, ‘treatment of AMI’, ‘laparoscopic cholecystectomy rate’ and ‘AMI mortality rate’ , the number of hospitals in the sample is 39, 56, 47, 55 and 48, respectively), patient level data that was aggregated to compute indicators at the hospital level, and socio-demographic data of municipalities where hospitals are located. Our data set covers the period from 1998 to 2006, being each of the equations estimated with a balanced panel. The sample includes both hospitals that in this period were transformed into SA, and hospitals that at the end of the period were still SPA. We excluded from the sample oncology hospitals, psychiatric hospitals, paediatric hospitals, and other specialized hospitals (orthopaedic, infectious diseases, …), because specialization might influence hospitals performance consistently.
16 Beck and Katz (2004) advised that, given the technical advantages and disadvantages of the several
panel data estimators, we must recur to the theory to decide which model is best suited to a particular data set. When this is not possible, we should test different formalizations, on the assumption that if the tests do not give a strong indication of the existence of an unobserved specific effect, it is always preferable to use pooled OLS.
17 In practice, not rejecting the null hypothesis in the Hausman test means that estimates of random effects
are preferable to those of fixed effects, because they are consistent and more efficient.
18 Rejecting the null hypothesis in the LM test means that random effects is preferable to pooled OLS,
We use various sources of information: Institute of Health Informatics and Financial Management, Directorate General of Health, Secretary General of the Ministry of Health and National Institute of Statistics.
6. Summary description of the effects of SA management
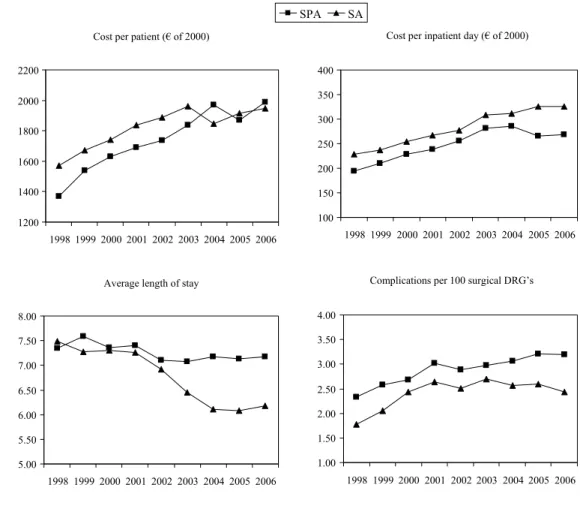
The graphs in Figure 1 represent the average evolution in each of the analyzed indicators in the period of 1998 to 2006 for two groups of hospitals: a group of 34 hospitals with SPA management that keep this management throughout the period (in the graph, the SPA group), and a group of 19 hospitals with SPA management until 2002 and SA management from 2003 onwards (2003 included).19
Figure 1: Average evolution of indicators in SA and SPA hospitals
19 In order to make the graphical analysis useful, the group of SA hospitals is only composed of hospitals
that shifted management type in the same year. Additionally, since in this analysis there is no control of supply and demand conditions, both groups are composed of hospitals that were similar in terms of size and costs before the transformation.
Cost per patient (€ of 2000)
1200 1400 1600 1800 2000 2200 1998 19992000 200120022003 2004 2005 2006
Cost per inpatient day (€ of 2000)
100 150 200 250 300 350 400 1998 1999 2000 2001 2002 2003 2004 2005 2006
Average length of stay
5.00 5.50 6.00 6.50 7.00 7.50 8.00 19981999 2000 2001 20022003 2004 2005 2006
Complications per 100 surgical DRG’s
1.00 1.50 2.00 2.50 3.00 3.50 4.00 1998 1999 2000 2001 2002 2003 2004 2005 2006 SPA SA
Deaths per 100 admissions 3.00 3.50 4.00 4.50 5.00 5.50 6.00 1998199920002001200220032004 2005 2006
Decubitus ulcers per 100 admissions
0.00 0.20 0.40 0.60 0.80 1.00 1.20 1.40 1.60 1.80 2.00 1998 1999 2000 2001 2002 20032004 20052006
AMI mortality rate
0.10 0.15 0.20 0.25 0.30 1998 1999 2000 2001 2002 2003 2004 2005 2006
Rate of caesareans in total births
0.20 0.25 0.30 0.35 0.40 1998 1999 2000 2001 2002 2003 2004 20052006
Laparoscopic cholecystectomy rate
0.15 0.25 0.35 0.45 0.55 0.65 0.75 1998 1999 2000 2001 2002 2003 2004 2005 2006
Proportion of AMI treated intensively
0.00 0.10 0.20 0.30 0.40 1998 1999 2000 2001 2002 2003 20042005 2006
Social cases per 1000 admissions
0.0 2.0 4.0 6.0 8.0 10.0 12.0 14.0 16.0 1998 19992000 2001 20022003 2004 2005 2006 Case-mix index 0.80 0.90 1.00 1.10 1.20 1998 1999 2000 2001 2002 2003 2004 2005 2006
The graphs for total mortality, AMI mortality and CMI do not show relevant differences between the two groups of hospitals in terms of the evolution of the indicators.
Until 2003 the two groups of hospitals had a very similar evolution in terms of the rate of complications in surgical procedures, but in the period 2004-2006 the rate fell in SA hospitals (at an average rate of 3.38% per year), and continued to climb in SPA hospitals (at an average rate of 2.33% per year). A similar trend can be seen in the incidence of decubitus ulcers: a decline at an average rate of 3.38% per year in SA hospitals between 2004 and 2006 and a growth at 7.74% per year in SPA hospitals. The use of intensive procedures to treat AMI has been growing in all NHS hospitals, with a slightly faster growth in the group of SA hospitals in the years 2002 and 2003, increasing the gap to the average of the SPA group, a gap that suffered a reduction in 2004 and 2005. We also observe a slight difference in the evolution of the rate of caesareans between the two groups of hospitals from 2003 to 2006: this rate as grown faster in SPA hospitals every year, at an annual average rate of 5.95% in that period, which compares to a growth of 2.73% per year in SA hospitals. The raw data shows that the rate of laparoscopic cholecystectomy as also risen slightly faster in SA hospitals than in SPA hospitals from 2003 on.
The incidence of patients kept in the hospital due to social reasons as been growing faster in SPA hospitals, although this pattern is visible already since 1999.
The average length of stay is the indicator for which the graphical illustration shows the most differentiated evolution starting in the moment of the change in management, with the corporatized hospitals having a faster decline, particularly felt in the first year of the new type of management (around 7%). The growth trend in average cost per admission is interrupted only in 2004 in SA hospitals, and a year later in SPA hospitals. The cost per day grows throughout all the analysis period in the group of hospitals that shifted to SA, and shows a drop in 2005 in SPA hospitals.
A better description of the evolution of the indicators in the two groups of hospitals can be done with a difference-in-differences analysis. This analysis consists of calculating the difference between the two groups of hospitals in two moments of time (the first
moment before the change of management in the SA group, and the second moment after this change), and subsequently calculating the difference between these differences.20 Notwithstanding the limitations of not controlling for explanatory variables that can influence performance indicators, this difference-in-differences analysis is an interesting first approach to raw data, insofar as it allows us to have a general view of the dynamics of the indicators in the time period, taking into account the initial differences between the two groups of hospitals.
Table 1: Difference-in-difference analysis
Cost per patient (€ of 2000) Cost per inpatient day (€ of 2000)
1998 2006 Time Diff. 1998 2006 Time Diff.
SPA 1369.83 1987.54 617.71 SPA 194.03 268.61 74.58 SA 1571.26 1948.67 377.41 SA 228.12 325.23 97.11 Group Diff. 201.43 -38.87 -240.30 Group Diff. 34.09 56.62 22.53
Average length of stay Complications per 100 surgical DRG’s
1998 2006 Time Diff. 1998 2006 Time Diff.
SPA 7.35 7.17 -0.18 SPA 2.33 3.19 0.86 SA 7.49 6.18 -1.31 SA 1.78 2.43 0.66 Group Diff. 0.14 -0.99 -1.14 Group Diff. -0.56 -0.76 -0.20
Decubitus ulcers per 100 admissions Deaths per 100 admissions
1998 2006 Time Diff. 1998 2006 Time Diff.
SPA 0.71 1.74 1.03 SPA 4.99 5.54 0.54 SA 0.34 0.62 0.29 SA 3.84 4.04 0.20 Group Diff. -0.38 -1.12 -0.74 Group Diff. -1.15 -1.49 -0.34
AMI mortality rate Rate of caesareans in total births
1998 2006 Time Diff. 1998 2006 Time Diff.
SPA 0.20 0.19 -0.02 SPA 0.26 0.36 0.10 SA 0.19 0.18 -0.01 SA 0.25 0.32 0.07 Group Diff. -0.02 -0.01 0.01 Group Diff. -0.01 -0.04 -0.03
Proportion of AMI treated intensively Laparoscopic cholecystectomy rate
1998 2006 Time Diff. 1998 2006 Time Diff.
SPA 0.03 0.24 0.22 SPA 0.20 0.51 0.31 SA 0.06 0.31 0.25 SA 0.34 0.69 0.35 Group Diff. 0.03 0.07 0.03 Group Diff. 0.14 0.18 0.04
20 Since all hospitals in the SA group suffered the shift in management in 2003, we defined 1998 as the
Case-mix index Social cases per 1000 admissions
1998 2006 Time Diff. 1998 2006 Time Diff.
SPA 0.94 1.04 0.10 SPA 3.51 13.30 9.79 SA 0.93 1.04 0.12 SA 1.49 5.35 3.86 Group Diff. -0.01 0.00 0.01 Group Diff. -2.01 -7.95 -5.93
It should be noted that the group of hospitals that were transformed into SA presented better results in outcome quality indicators (in this case, lower rates of complications, ulcers, total deaths and AMI deaths) already in 1998, and that this position is reinforced until 2005 (except for AMI death). Differences in quality in processes seem less relevant, although also in favour of SA hospitals. The steeper reduction on average length of stay observed in these hospitals is again highlighted, as well as in the proportion of admissions with “social case” diagnosis. The cost per day has higher growth in the SA group during the period, but the cost per patient has a more modest growth.
In summary, this analysis signals that the corporatization of NHS hospitals might have had the following average effects: improvement in indicators of quality in terms of outcomes and reduced impact on the choices of intensive treatment processes; decrease in the incidence of “social case” admissions and virtually nil impact in case-mix index; decrease in the average length of stay, decrease in the cost per admitted patient and increase in the cost per day. Hence, these preliminary conclusions do not seem to support the premise that the introduction of profit and management performance targets in public hospitals results in adverse effects of reduced quality and decreased access. After this preliminary assessment, we looked at how much of the evolution in indicators of quality, access and cost is attributable to the change of management from SPA to SA, controlling other factors that may have an impact on the performance of hospitals, in particular variables that configure the supply and demand for each hospital.
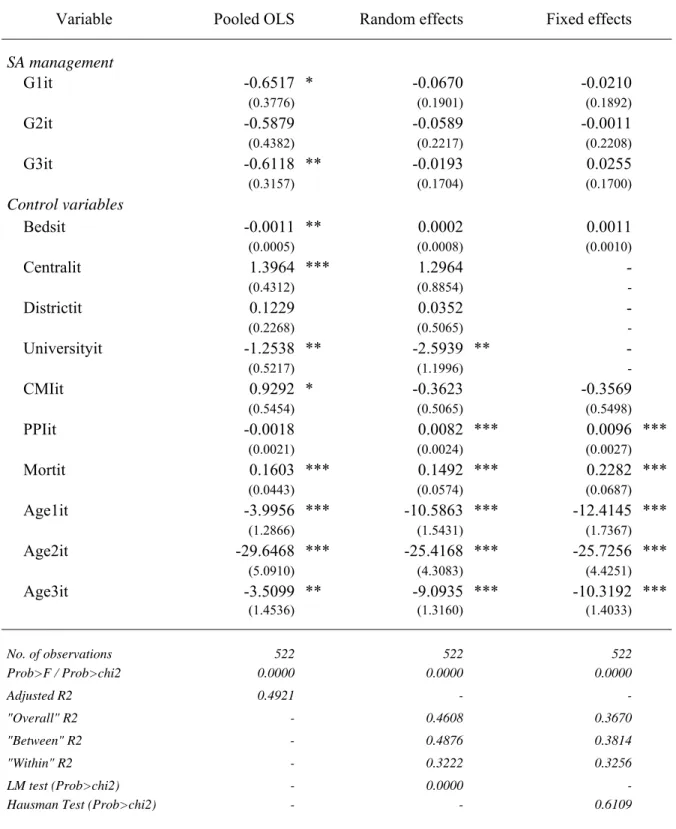
7. Results
For each of the defined indicators we estimated three regressions: one with unobserved individual effects based on the random effects estimator, another based on the fixed
effects estimator, and yet another by pooled OLS. The following tables present the results of all regressions. The bottom rows of the tables contain general information about the quality of the adjustment of the models and the results of tests computed to choose the most appropriate model, while at the top we present the estimates of coefficients and standard deviations of the binary variables for the shift to SA management, and also the coefficients of the control variables, with the exception of year dummies.
Cost containment and efficiency effect
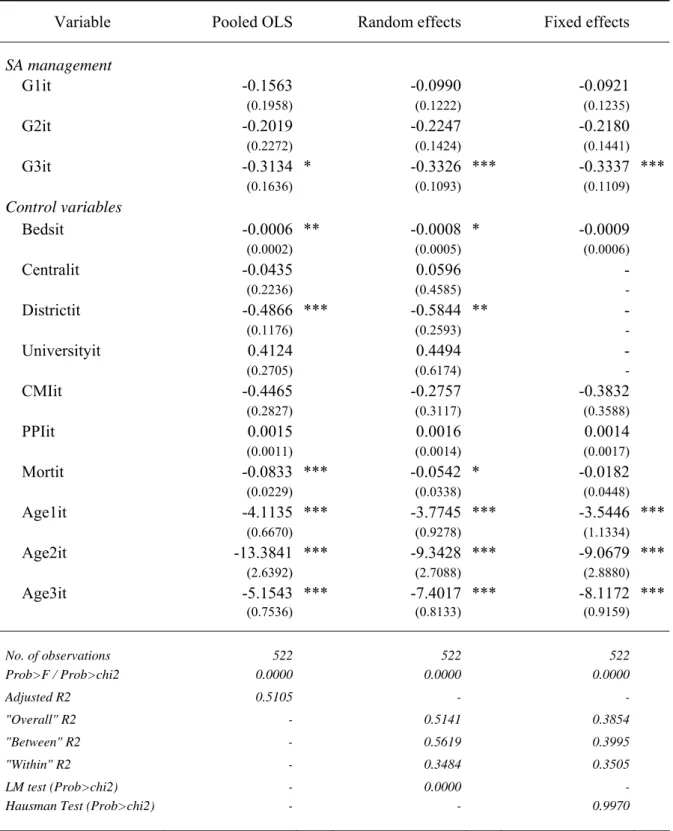
The results of the regressions on the variable cost per patient are presented in Table 2. In the LM test we reject the hypothesis that the variance of the unobserved individual effect is null, which means that the random effects estimation is preferable to OLS. Additionally, in the Hausman test we do not have evidence to reject the null hypothesis of the coefficients of random effects and fixed effects models not being significantly different. Thus, in this case the random effects estimator is preferable because it is consistent and more efficient than the fixed effects estimator.21 On the basis of the tests carried out, we found that the most appropriate model to the data is the random effects model, which presents an overall R2 of about 0.77 and is globally statistically significant.
The estimated coefficient of dummy variable G1 is not significantly different from zero, which means that after one year of SA management there weren’t visible effects on this indicator. The estimated coefficient of G2 has statistical significance (at 1%) and negative sign, indicating that after two years of SA management there was a reduction in the average cost per admitted patient in these hospitals, vis-à-vis the ones that remained SPA, of about 244 euros. However, this differential decreases in the third year, in such a way that it becomes statistically irrelevant even at a significance level of 10%.
With the exception of the number of beds, mortality rate and university dummy, control variables present statistical relevance at least to a significance level of 10%.
21 Note that the fixed effects estimator is always consistent, regardless of whether or not there is
Table 2: Regression results of cost per patient
Variable Pooled OLS Random effects
Fixed effects SA management G1it 9.9197 56.9802 65.9171 (82.0494) (68.8967) (69.9228) G2it -299.4440 *** -243.6296 *** -232.0530 *** (95.2150) (80.2897) (81.5999) G3it -129.9027 * -64.9462 -48.7837 (68.5916) (61.1964) (62.8141) Control variables Bedsit 0.1568 0.1090 0.2404 (0.1028) (0.1892) (0.3621) Centralit 422.6053 *** 563.9293 *** - (93.7065) (171.8012) - Districtit 113.5392 ** 155.0490 * - (49.2850) (94.5303) - Universityit -265.9625 ** -246.9565 - (113.3619) (223.6209) - CMIit 1367.3800 *** 1306.6580 *** 1109.1750 *** (118.5017) (154.7468) (203.1938) PPIit 1.5532 *** 1.7506 *** 0.7403 (0.4657) (0.6837) (0.9859) Mortit 37.8010 *** 22.0400 2.0689 (9.6156) (15.0768) (25.3934) Age1it 148.9750 -727.8761 * -1541.4180 ** (279.5602) (427.7146) (641.8307) Age2it 2714.5440 *** 4592.0670 *** 5370.0930 *** (1106.2240) (1401.6090) (1635.3560) Age3it 205.7275 -768.1761 * -1633.3720 *** (315.8601) (406.4907) (518.6141) No. of observations 522 522 522 Prob>F / Prob>chi2 0.0000 0.0000 0.0000 Adjusted R2 0.7702 - -"Overall" R2 - 0.7716 0.6575 "Between" R2 - 0.8703 0.7443 "Within" R2 - 0.3664 0.3742 LM test (Prob>chi2) - 0.0000
-Hausman Test (Prob>chi2) - - 0.7007
Note: Standard-deviations between parenthesis; ***Significant at 1%; **Significant at 5%; *Significant at 10% In the case of cost per inpatient day, LM and Hausman tests indicate that the most appropriate model is also the random effects. The estimated coefficients indicate that the cost per day is greater with SA management, but the gap has only statistical