A
CHEMICAL ANALYSIS OF SEDIMENT PORE WATER IN OXYGEN-FREE
ATMOSPHERE: APPLICATION TO A CONTAMINATED AREA
Leticia Burone1,3, Elisabete de Santis Braga da Graça Saraiva1, Paulo Valente2 &
Ana Maria Setubal Pires-Vanin1
1
Instituto Oceanográfico da Universidade de São Paulo (Praça do Oceanográfico, 191, 05508-900 São Paulo, SP, Brazil)
2
Instituto de Física, Facultad de Ingeniería (Casilla de Correo 30, C.P. 11000, Montevideo, Uruguay)
3
Oceanología, Departamento de Ecología, Facultad de Ciencias (C.P. 11400, Montevideo, Uruguay)
Corresponding author: [email protected]
Descriptors:Oxygen-free atmosphere, Ammonium, Pore water, Contamination.
Descritores:Atmosfera livre de oxigênio, Amônia, Água intersticial, Contaminação.
Interstitial water chemistry has been widely studied to identify biological and chemical reactions in the sediment and to assess sediment-water exchange of dissolved chemical compounds (e. g. Sayles 1979; Froelich et al. 1979; Saager et al. 1990; van Raaphorst & Malschaert, 1996). However, sediment pore water sampling is tedious and requires the use of special equipment due to the possible effects and potential chemical alterations resulting from incorrect procedures.
It is known that, with the exception of the uppermost sediment layers (of 1 to 3 cm thickness), most fine-grained deposits are anoxic but oxidize rapidly upon exposure to air. The oxidation of the sediments brings about rapid changes in the kinds of redox-sensitive chemicals dissolved in the sediment pore water. During pore water collection and sample processing the maintenance of an oxygen-free atmosphere is essential for the measurement of some of the original chemical constituents (Manheim, 1976; Kriukov & Manheim, 1982).
Results from many studies indicate that nutrient concentrations of pore water may be much higher than those of the water column (Ohle, 1977;
Esteves, 1988; van Raaphorst & Malschaert, 1996).
Generally, glove bags or glove boxes should be used to handle the pore water samples that best represent the natural sedimentary environment. It is essential, to ensure these conditions, that any exposure of the sediment and sampled water to the atmosphere must be completely avoided by guaranteeing oxygen-free conditions during the entire process of sediment sample manipulation (Adams, 1991). This can be achieved by working in the inert atmosphere of such a gas as nitrogen, argon or, in some cases, helium or carbon dioxide.
__________
Contr. no. 866 do Inst. oceanogr. da Usp.
The aim of this study is to present the results of the chemical analysis of ammonium ions in the sediment pore water extracted, in an oxygen-free atmosphere, from sediment collected in an area with a high degree of contamination. To elucidate the effect of oxygen on the ammonium analysis we compared the results with those from samples analyzed in the presence of oxygen. The oxygen-free atmosphere was created in two glove boxes filled with nitrogen gas. The design of the two glove boxes and their application for comparing the ammonium concentration in interstitial sediment water with different degrees of contamination is illustrated. The authors have also included a detailed description of the use and working of the glove boxes. The calculation of the flow time needed to fill the boxes, which is a function of box volume and gas type, is presented.
All samples had similar granulometric composition and the ammonium concentration in the pore water was measured both in the presence and absence of oxygen. Ammonium is the most highly reduced form of nitrogen and its reaction with oxygen is faster than occurs with other forms of nitrogen (Sommaruga, 1987). Thus, working with ammonium ions is a good way to test glove box efficiency. The calculation of the gas flow necessary to produce an oxygen-free atmosphere proves to be an indirect, but
very practical, way to determine the O2 concentration
through the knowledge of the amount of N2 that is
introduced into the box. Since no oximeter is needed, the technique is simple and cheap.
Two transparent acrylic glove boxes were constructed (Figs 1 and 2). The first was used for work on board the ship, and the second in the laboratory during the chemical analysis. The inert atmosphere
consisted of N2. The gas flow was obtained by
(262A Taylor). Instructions on how to construct and use the boxes are also given below.
Fig. 1. Schematic representation of the glove box used for field work. The unit is 70cm wide and 70 cm high. 1- N2
input; 2– O2 output; 3– aperture permitting entry of the corer
tube, vertical adjustable clamps are available; 4- gloves; 5- N2
bottle and 6- secondary work door.
Fig. 2. Schematic representation of the glove box used for work in the laboratory. The unit is 99 cm wide and 70cm high. 1- N2 input; 2- O2- output; 3- power source; 4-door lock
and 5-gloves.
Ammonium in the Interstitial Pore Water
Sediment samples were collected from four river estuaries on Ubatuba Bay in southeastern Brazil (Fig. 3). Intact sediment samples were collected using
a Kajak-Brinkhurst corer (Mudroch & MacKnight, 1991) with a maximum length of 60 cm and an internal diameter of 7.3 cm. Six samples were taken at each location and divided into two groups (G1 and G2) so as to form a triple sample from each. The G1 samples were treated inside the boxes, in an oxygen-free atmosphere. The G2 samples were treated in a normal oxygen atmosphere, thus providing a control group.
The in situ procedure applied to the G1
group of samples was as follows. Before sampling, a glove box was installed on board, filled with the
inert gas (N2) and completely sealed. Immediately
after sampling, the bottom sediment was placed inside the box through an aperture located in the bottom of the box (number 3 in Fig. 1) of the same diameter as the corer tube. The tube was then fixed inside the
glove box and a weak flow of N2 was injected to
compensate for any possible loss during the operation. To avoid the increase of the internal pressure in the glove box, a small hole (point 2 in Fig. l) should be made in its base. The overlying water in the corer was eliminated and the first 3 centimeters of sediment were collected so as to form one sample. It was stored in plastic bottles and kept at a temperature of –20 ºC until the pore water was extracted in the laboratory. The G2 group of samples was treated in exactly the same way apart, that is, from the inert atmosphere.
For both sample groups, the extraction of the interstitial water was performed by sediment centrifugation in the appropriate polyvinyl chloride
(PVC) tubes as recommended by Saager et al. (1990).
These tubes consist basically of two chambers separated by a Whatman GF/C fiberglass filter. The whole sediment sample was put into the inner part of the tube and the interstitial water collected in the other part after centrifugation. About 15 minutes is needed at 1800 rpm (for a centrifugation radius of 20 cm, the centripetal aceleration being
approximately 450 m/s2) to obtain a liquid volume
large enough for the analysis without breaking up the biological cells, which would alter the ammonium concentration.
For the G1 group of samples the steps described above were taken inside the glove box in the laboratory (Fig. 2) and the extracted water was kept in oxygen-free bottles . The ammonium analysis followed the traditional colorimetric method described in Tréguer & Le Corre (1975). For the G2 group of samples the chemical analysis
obeyed the same criteria, except that the N2
Fig. 3. Graphical representation of Ubatuba Bay showing the four rivers studied.
Sedimentological Analysis
Samples were collected for the determination of organic carbon (C), nitrogen (N) and sulfur (S) concentration. The concentrations were determined using about 500 mg of freeze-dried and weighed sediment, decarbonated with 1 M solution of hydrochloric acid and washed 3 times with de-ionized water and freeze-dried again. The analysis was made in a LECO CNS 2000 analyzer. The carbon-sulfur ratio (C/S) was calculated to evaluate the degree of sediment oxi-reduction.
The granulometric composition was determined using the low-angle laser light scattering technique (LALLS, type Malvern 2000) and the particle size intervals were classified according to the Wentworth scale (Suguio, 1973).
Sediment redox potential (Eh) was measured in the field immediately upon retrieval of the undisturbed sediment samples. This was done to avoid any changes in the sediment chemistry composition due to sediment oxidation. The Eh in the first 3 cm of the sediment column was obtained by the difference in electrical potential, using a 0.5 mm diameter platinum microelectrode. The reference potential was given by a
KCl+AgCl2 saturated calomel electrode, calibrated
with ZoBell solution (ZoBell, 1946). The cell potential was adjusted to the standard hydrogen scale by adding 250 mV to the measured value, thus making comparison with other data possible.
Glove Box Operation
In general, to create an inert atmosphere, it is necessary to fill the entire volume of the glove box
with the inert gas, so the volume of N2 must be at
least equal to that of the glove box. If a flow meter is available, there is no need for any calculation. However, this kind of instrument is not simple and it is usually very expensive. Thus a rapid calculation giving the time flow necessary to fill the glove box, as a function of the manometric pressure, read on a gas cylinder, is presented here.
The first manometer installed on the gas bottle gives the internal gas pressure, which is an indirect measurement of the gas mass. The second manometer indicates the manometric pressure when the gas is flowing , and reads zero if the valve is closed. The Bernoulli equation (Nussenzveig, 1981; Halliday et. al., 1994) between two points in the flow
River Acaraú
River Grande de Ubatuba
River Indaiá
River da Lagoa
Ubatuba
line was applied at: (1) some point after the first manometer and (2) the exit of the gas tube/entrance to the glove box. A small hole in the glove box floor was made for air to escape to maintain the atmospheric pressure inside the glove box constant. Because the pressure at point (1) is not very high, we may consider
the gas density ρ to be approximately constant. So we
have:
2
2 1
P
v
P
o+
=
ρ
ρ
, (1)where Po ≅100 kPa is the atmospheric pressure and v is
the gas velocity at point (1). The gas flow Q is
obtained by integrating the velocity profile (taken as uniform) in the tube of diameter d, which gives
(
o)
S
P
P
d
ds
v
Q
=
∫
→ →=
1−
22
4
.
ρ
π
(2)Q has the dimension of volume/time, so if Vois the
volume of the box and T the time needed to
completely fill the box, we have
(
o)
o o
P
P
d
V
T
T
V
Q
−
=
⇒
=
1 22
4
ρ
π
. (3)
This equation has a very practical use, since
o
man
P
P
P
=
1−
is the pressure measured by thesecond manometer. Therefore, the total volume to be filled, the gas density at atmospheric pressure and temperature, as well as the diameter of the outlet tube, may all be known. It should be noted that within this
approximation, for given values of
P
man and d, thetime is a linear function of the box’s volume. It should
be pointed out that the N2 inflow should be slow in
order to provide a good mixing of the gas and avoid
O2 accumulation in the corners of the box.
Nevertheless, the user needs to find an optimum point between low pressure and short time load. To make this procedure safe and to avoid any slow escape of gas it is convenient to maintain a minimal flow, even
after time T has been reached. This calculation was
tested once with an oximeter (Taylor 262A) and after
the calculated time, the O2 concentration was lower
than 2%.
R
ESULTS ANDD
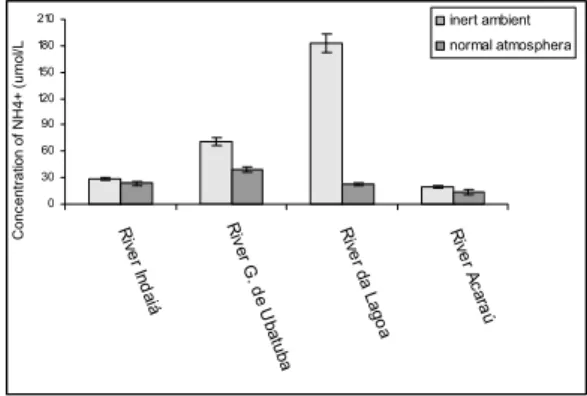
ISCUSSIONThe average value distribution and its respective statistical deviation (SD) for ammonium concentration is shown in Figure 4. All values obtained with the inert gas glove box are higher than those from the normal atmosphere. When the results for both processes are compared differences appear for all the sites sampled; however, the major contrast was detected at the da Lagoa and Grande de Ubatuba rivers. 0 30 60 90 120 150 180 210 R ive
r Ind a iá R ive r G . d e U b a tub a R ive r da
La go
a R
ive r Ac
a ra ú inert ambient normal atmosphera C o n c e n tr a tio n o f N H 4 + ( u m o l/L )
Fig. 4. The mean values of the ammonium concentration and their respective standard deviations (SD) for three samples of each group from the four rivers.
Table 1 shows the granulometric distribution. In general, the sediments from the four river mouths have high percentages of fine and very fine sands, as well as of silt.
The values of sedimentary carbon, nitrogen, sulfur, carbon-sulfur ratios, as well as Eh, are presented in Table 2. The da Lagoa and Grande de Ubatuba rivers are the most anoxic environments, as they present the highest values of carbon, nitrogen and sulfur content, low values of Eh and a C/S ratio lower than 3.
The ammonium concentration measured in the present experiments clearly evidences the effect of oxygen on the sediment pore water chemistry. The low ammonium concentration (the most highly reduced nitrogen form) in the G2 group of samples results from the fast oxidation of the sediment, which is supposed to increase the nitrate and nitrite (lowest reduced form of nitrogen) concentrations. The differences between the two sample groups are more apparent at the da Lagoa and Grande de Ubatuba river mouths. It is known that the ammonium concentration is the result of the degradation of organic nitrogen compounds
under anaerobic conditions (Ankley et al., 1990; Braga
et. al., 2000) and/or of the denitrification process
matter content in the sediment, since the granulometric composition is very similar in the four locations and the original redox conditions are preserved. The high oxygen demand induced by the decomposition of large amounts of organic matter in the Grande de Ubatuba and da Lagoa rivers may explain the low potential redox values found at these sites, specially at the latter.
As shown by Mortimer (1969), Serruya et al.
(1974), Pezeshki & Delaune (1993), Eh values lower than 200 mV and C/S lower than 3 (Berner and Raiswell, 1984; Raiswell & Berner, 1985) are associated with the anoxic condition of sediments, which agrees with the results found for sediments from the da Lagoa and Grande de Ubatuba river mouths. Low values of C/S ratio and Eh also point
to a high degree of contamination (Burone et al.,
2003).
During the sampling period, the sediments of these stations were dark in color and smelled strongly of sulfides, which is in agreement with CETESB data (CETESB, 1996). CETESB (2000) reports that large amounts of domestic sewage are constantly discharged into these rivers, with a consequent rise in the fecal
coliform content to extreme values (1.1x10⁵ NPM/l). It
should be remembered that the legal maximum coliform content allowed is 100 NPM/l and such a degree of fecal contamination is indicative of raw sewage discharge. In the same area, Abessa and
Burone (2003) have made sediment toxicity tests using
the copepod Schizopera knabenii. They reported that
the sediment from the Grande de Ubatuba and da Lagoa rivers showed higher toxicity than the Acaraú and Indaiá rivers. The toxicity of these sediments was related to the high sulfur (0.14 %), carbon (3.79 %) and nitrogen (0.28 %) contents in the
sediments and nitrate (31.0 µM), ammonia (249.3 µM)
and organic phosphorus (20.1 µM) dissolved in
interstitial water.
The importance of the oxidation process as related to ammonium in sediment pore water was evaluated in an oxygen-free atmosphere, and the results were compared with those obtained under normal conditions. The chemical analysis of C, N, S and Eh of the sediment pore water, and the calculation of C/S, from the contaminated area of Ubatuba Bay showed that this site is a highly anoxic environment. The results of the analysis in an inert atmosphere emphasize the importance of the oxygen effect on the ammonium measurement in pore water of sediments with a high degree of contamination. Thus, great attention should be given to the health of the ecosystem as a whole when considering sample collection and treatment, such as pore water extraction. This paper also reports on the design, construction and use of glove boxes for providing the necessary oxygen-free environment.
Table 1: Percentage of sediment fractions at the 4 river estuaries. VCS = very coarse sand; CS = coarse sand; MS = medium sand; FS = fine sand; VFS = very fine sand; Si = silt; Cl = clay.
Stations Gravel VCS CS MS FS VFS Si Cl Type
(%) (%) (%) (%) (%) (%) (%) (%)
R. Indaiá. 0.00 0.00 3.90 20.34 30.04 21.44 22.26 2.32 AMF R. G. de Ubatuba 0.00 0.06 4.98 23.73 31.76 16.90 20.02 2.50 AMF R. da Lagoa 0.81 1.98 10.02 11.38 23.47 23.52 20.50 3.02 AMF R. Acaraú 0.00 0.00 2.42 15.88 30.51 28.14 20.42 2.63 AMF
Table 2: Organic carbon (TOC); sulfur (S); total nitrogen (N) and the redox potential of the three uppermost centimeters of the sediment column.
Stations TOC S C/S N Eh 0-1cm Eh 1- 2cm Eh 2-3cm
(%) (%) ratio (%) (mV) (mV) (mV)
R. Indaiá 1.05 0.04 26.25 0.12 344 340 334
R. G. de Ubatuba 1.24 0.42 2.95 14.73 201 129 139
R. da Lagoa 1.98 0.73 2.71 10.08 12 -6 -8
A
CKNOWLEDGEMENTSThe authors are grateful for the financial support provided by FAPESP (Fundação de Amparo à Pesquisa do Estado de São Paulo) through the PhD fellowship granted to L. Burone (Proc. Nº 97/12493-97). Thanks are due to Mr. César Ricciardi for
drawing the boxes and to the staff of the IO-USP
workshops for the construction of the same. Two anonymous referees whose comments contributed to the improvement of this manuscript also deserve recognition.
R
EFERENCESAbessa, D. M de S.; Burone, L. 2003. Toxicity of sediments from the rivers situated in Ubatuba Bay (SP, Brazil). O Mundo da Saúde, 27(4):564-569.
Burone, L.; Muniz, P.; Pires-Vanin, A. M. S. & Rodrigues, M. 2003. Spatial distribution of organic matter in the surface sediments of Ubatuba Bay (southeastern Brazil). An. Acad. Bras. Cienc., 75(1):77-90.
Adams, D. D. 1991. Sediment pore water sampling. In: Murdoch, A. & MacKnight, S. eds. CRC Handbook of techniques for aquatic sediments sampling. Boca Raton; CRC Press Inc. 210p.
Ankley, G. T.; Katko, A. & Arthur, J. W. 1990. Identification of ammonia as an important sediment-associated toxicant in the Lower Fox River and Green Bay, Wisconsin. Environ. Toxicol. Chem., 9:313-322.
Berner, R. A., Raiswell, R., 1984. C/S method for distinguishing freshwater from marine sedimentary rocks. Geology, 12:365-368.
Braga, E. S.; Bonetti, C.; Burone, L. & Bonetti Filho, J. 2000. Eutrofication and bacterial pollution caused by industrial and domestic waste in the Baixada Santista System-Brazil. Spatial distribution of organic matter in the surface sediments of Ubatuba Bay (Southeastern Brazil). An. Acad. bras. Cienc., 75:77-90.
CETESB, 1996. Relatório de balneabilidade das praias paulistas – 1995. São Paulo, Secretaria de Meio Ambiente. 122p.
CETESB, 2000. Relatório de balneabilidade das praias paulistas – 1999. São Paulo, Secretaria de Meio Ambiente. 185p.
Esteves, F. 1988. Fundamentos de Limnologia. São Paulo, Editora interciência/ FINEP. 575p.
Froelich, P. N.; Kim, K. H.; Jahnke, R. A.; Burnett, W. C.; Soutar, A. & Deakin, M. 1979. Pore water fluoride in Peru continental margin sediments: Uptake from seawater. Geochim. cosmochim. Acta, 47:1605-1612. Halliday, D.; Resnick, R . & Krane, K. 1994. Fundamentals
of physics. 4th ed. Mexico, Compañia Editorial
Continental. 582p.
Kriukov, P. A. & Manheim, F. T. 1982. Extraction and investigative techniques for study of interstitial waters of unconsolidated sediments: a review. In: Fanning, K. A. & Manheim, F. T., eds. The dynamic Environment of the ocean floor. Toronto, Lexington Books. 315p.
Manheim, F. T. 1976. Interstitial waters of marine sediments. In: Riley, J. P. & Chester, R., eds. Chemical oceanography. v. 6. New York, Academic Press. 115p. Mortimer, C. H. 1969. Physical factors with bearing on
eutrophication in lakes in particular In: Eutrophication: Causes, consequences, correctives. Washington, Proc. Sympos. Nat. Acad. Sci. p.340-368.
Mudroch, A. & MacKnight, S. D. 1991. Bottom sediment sampling. In: Mudroch, A. & MacKnight, S. eds. CRC Handbook of techniques for aquatic sediment sampling. Boca Raton; CRC Press Inc. 210p.
Nussenzveig, H. M. 1981. Curso de física básica, v. 2. São Paulo, Edgard Blucher. 531p.
Ohle, W. 1977. Experimental lakes area and canadian limnology. Arch. Hydrobiol., 79:274-280.
Pezeshki, S. R. & Dalaune, R. D. 1993. Effect of crude oil in gas exchange functions of Juncus roemrionus and
Spartina alterniflora. Water, Air, 8 Soil Poll., 68:461-468.
Raiswell, R. & Berner, R. A. 1985. Pyrite formation in euxinic and semi-euxinic sediments. Am. J. Sci., 285:710-724.
Saager, P. M.; Sweerts, J-P. & Ellermeijer, H. J. 1990. A simple pore-water sampler for coarse, sandy sediments of low porosity. Limnol. Oceanogr., 35(3):747-751. Sayles, F. L. 1979. The composition and diagenesis of
interstitial solutions. I. Fluxes across the seawater-sediment interfaces in the Atlantic Ocean. Geochim. cosmochim. Acta, 43:527-534.
Serruya, C.; Edelstein, M.; Pollingher, U. & Serruya, S. 1974. Lake Kinneret sediments: nutrient compaction position in the pore water and mud exchanges. Limnol. Oceanogr., 19:489-508.
Suguio, K. 1973. Introdução à sedimentologia. São Paulo, Edgard Blucher/ EDUSP. 317p.
Tréguer, C. & Le Corre, P. 1975. Manuel d’analysis des sels nutritifs and l’eau de mer. 2ème éd. Brest, Université de
Bretagne Occidentale. 110p.
Van Raaphorst, W. & Malschaert, J. F. P. 1996. Ammonium adsorption in superficial North Sea sediments. Continent. Shelf Res., 16(11):1415-1435.
ZoBell, C. E. 1946. Studies on redox potential of marine sediments. Bull. Am. Ass. Petrol. Geol. Bull., 30:470-513.
Sources of unpublished material
Sommaruga, R. X. 1987. Dinámica de la interfase agua-sedimento en un sistema eutrófico, Lago Ton-Ton (Canelones, Uruguay). Con caracterización físico-química y biológica del sedimento. MSc. Thesis. Montivideo, Uruguay, Facultad de Humanidades y Ciencias, Universidad de la República. 93p.