Article
Printed in Brazil - ©2017 Sociedade Brasileira de Química0103 - 5053 $6.00+0.00
*e-mail: [email protected]
Speciation of Chromium in Water Samples after Dispersive Liquid-Liquid
Microextraction, and Detection by Means of High-Resolution Continuum Source
Atomic Absorption Spectrometry
Daniele S. Porto,a Naomi Akiba,a Marcone Augusto L. de Oliveirab and
Ivanise Gaubeur*,a
aCentro de Ciências Naturais e Humanas, Universidade Federal do ABC, Av. dos Estados, 5001,
09210-971 Santo André-SP, Brazil
bDepartamento de Química, Universidade Federal de Juiz de Fora, Campus Universitário,
36036-330 Juiz de Fora-MG, Brazil
A newly analytical method has been developed to determine total chromium and speciation of this element in water samples through dispersive liquid-liquid microextraction combined with a high-resolution continuum source flame atomic absorption spectrometry. The most significant variables affecting complexation and extraction were optimized by using response surface methodology and univariate optimization. The best conditions for both the complexation and extraction elements in this study were: complexing agent ammonium pyrrolidine dithiocarbamate (APDC 6.0 mmol L-1); pH at 2.0 (CrVI) and at 7.0 (Cr total); NaCl (5% m/v); 1-undecanol (50 µL)
and ethanol 300 (CrIV) and 275 µL (total Cr). Under optimal conditions, this method resulted
in a 20-100 µg L-1 linear range for CrVI and total chromium, detection limits of 0.35 (CrVI) and
6.7 µg L-1 (total Cr), as well as enriching factor of 26 (CrVI) and 19 for total Cr. The method accuracy
was carried out by using certified water reference material (NIST CRM 1643e), and the results achieved were in agreement with the certified value (t-test at a confidence interval of 95%). The method developed was applied in samples of mineral water, tap water (the recovery values ranged from 88 to 115%) and seawater.
Keywords: dispersive liquid-liquid microextraction, chromium, speciation, trace element, atomic absorption spectrometry
Introduction
Chromium is an element commonly found in rocks, animals, plants, soil, rivers and seawater, dusts and volcanic fumes, as well as in Earth’s crust at a concentration of approximately 100 mg kg-1.1 Chromium in the environment
can be of natural origins, such as rock and soil erosion, volcanic eruptions, or of anthropogenic origins, through the use of this chemical element in a range of industrial activities such as metallurgy (steel, aluminum and alloys), refractories (cement, glass and clay) and chemical industries (leather tanning, wood preservation and pigments).2 The
second source is significantly responsible for CrIII and CrVI
in the environment.
Trivalent chromium, CrIII, is essentially found in the
mechanisms for metabolism of carbohydrates, lipids and
proteins, with a lower level of toxicity and less mobility than hexavalent chromium in the environment, due to the fact that the element is present in mineral structures, in the form of precipitates with some elements as iron, aluminum and/or manganese, and complexed with organic matter.3 In contrast, hexavalent chromium, CrVI, is said
to be carcinogenic as it is highly permeable in biological membranes, this being related to the fact that the chromate ion is a predominant specie of CrVI in physiological pH,
whose tetrahedral structure is similar to other ions, such as sulfate and phosphate, leading it to make a path into cells by carrying ions.4,5 Since chromium’s toxicological properties
are dependent on the element’s oxidation state, it is, therefore, important to carry out the correspondent chemical speciation for quantification purposes of these species.5
prior to the detection process.6 This procedure will allow the
concentration and separation of the matrix analyte, aiming to further detectability and eliminate any expected effects of the matrix and foreign ions.7
The so-called dispersive liquid-liquid microextraction
(DLLME) was created by Rezaee et al.8 in 2006
and consists of quickly inserting, with the aid of a microsyringe, a mixture of extractant and disperser solvents with an aqueous solution containing the analyte. The build-up of fine and disperse droplets in the extractant solvent allows for extraction the analyte. Among other advantages of DLLME, an important one is that can enhance the use of reduced volumes of organic solvents, at low cost, with quickness, good values of recovery and enrichment factors.9 DLLME has been widely used to
determine organic and inorganic analytes,10 considering
that for the second analyte a complexing agent is usually added, thus resulting in a hydrophobic complex for an extraction at a later stage.11 Dithiocarbamates (DTCs)
are mostly used as complexing agents, forming stable and neutral complexes with a wide range of metals.12
Sodium diethyldithiocarbamate (DDTC) and ammonium pyrrolidine dithiocarbamate (APDC) are two of the most widely used in DLLME.13
Generally, the detection of metals after DLLME is carried out using absorption and atomic emission techniques. Some of the techniques most widely applied are flame atomic absorption spectrometry (FAAS) and graphite furnace absorption atomic spectrometry (GFAAS).13 Other
detection methods have been combined with DLLME including inductively coupled plasma optical emission
spectrometry (ICP OES),14 laser-induced breakdown
spectrometry (LIBS)15-19 and tungsten coil atomic emission
spectrometry (WCAES).20 In this work, the authors used a
high-resolution continuum source flame atomic absorption spectrometry (HR-CS FAAS) for chromium detection, which in contrast with the line source (LS FAAS) uses a radiation source of high-intensity emission in continuum 190-850 nm (Xe short-arc lamp), a high-resolution double Echelle monochromator (DEMO) and a charge coupled device (CCD) array detector, allowing a resolution of ca. 2 pm per pixel as well as an increased detection capacity.21-25
In this context, this work aims at developing an analytical method for determination and speciation of Cr in water samples (tap water, mineral water and seawater) by using the DLLME procedure combined with HR-CS FAAS. To do so, the authors of this study assessed two complexing agents widely used, DDTC and APDC. Those variables encountered in complexation and microextraction were optimized by using response surface
methodology and univariate optimization, which makes it possible to look into the influences of such variances, as well as the interaction effects between them on the analytical response.
Experimental
Reagents and solutions
All the solutions used in this work were prepared with analytical-grade reagents and ultrapure water (Milli-Q Plus system, Millipore, Bedford, MA, EUA). The standard solutions of chromium were then prepared by diluting standard solutions of K2CrO4 10% (m/v) and CrIII
1000 mg L-1 (Specsol, Jacareí, SP, Brazil).
DDTC and APDC (Sigma-Aldrich, St. Louis, MO, USA) were two complexing reagents used. For adjusting the values of pH, solutions of sulfuric acid and ammonium hydroxide were used in different concentrations that resulted from diluting sulfuric acid at 95-97% (Merck, Darmstadt, Germany) and ammonium hydroxide at 28-30% (Sigma-Aldrich).
In the DLLME procedure, this was used as an extractant solvent, i.e., 1-undecanol (Sigma-Aldrich) and disperser solvent ethanol ≥ 99.5% PA (Fluka Analytical). A NaCl solution 25% (m/v) obtained from Sigma-Aldrich reagent was used as an electrolyte.
To study the effect of foreign ions, solutions containing aluminum, barium, cadmium, calcium, lead, chlorite, cobalt, copper, iron, manganese, nickel, nitrate, potassium, sodium, sulfate and zinc were prepared by diluting the standard solutions with a concentration of 1000 µg mL-1
(Ultra Scientific, USA).
To assess the method accuracy, a certified reference material (CRM) of water was used (NIST 1643e trace elements in water) from the National Institute of Standards and Technology (Gaithersburg, MD, USA). Tap water (from our lab in the city of Santo André, SP, Brazil), mineral water (bought locally) and seawater (from city of Santos, SP, Brazil) were used as real samples. The tap and mineral water samples were used without any previous treatment and to remove particle material from the seawater the sample was filtered using a 0.45 µm pore size membrane filter.
DLLME procedure
For determining total chromium
The pH value was adjusted with ammonium hydroxide (pH 7.0) then 600 µL APDC (90 mmol L-1) and 1800 µL
NaCl 25% (m/v) solutions were added. The resulting solution was heated in a water bath at 80 ºC for 15 minutes26
and cooled at room temperature, then the mixture 50 µL of 1-undecanol and 275 µL of ethanol was added using a glass syringe. The separation of phases was carried out in a centrifuge at 2000 rpm for 3 minutes. The organic phase was collected with a micropipette, then diluted in 200 µL of ethanol and then all volume introduced into HR-CS FAAS, with the aid of a pipette tip.
For the determination of CrVI
After acidification with sulfuric acid 1 mol L-1 (pH 2.0),
600 µL APDC (90 mmol L-1) and 1800 µL NaCl 25% (m/v)
were added. By using a glass syringe, the mixture 50 µL of 1-undecanol and 300 µL of ethanol were added. The other steps followed the same procedure used for total chromium.
For the determination of CrIII
It was evaluated from the difference between the total Cr and CrVI concentrations found using the above mentioned
procedures.
Instrumentation
A pH meter model 780 Metrohm (Herisau, Switzerland) equipped with a combined glass electrode was used to measure pH, a hotplate model IKA C-MAG HS 7 (Germany) was used to heat to 80 °C, and a Quimis centrifuge model Q222T (São Paulo, Brazil) for speeding up the separation of phases. The stirred extracting and dispersing solvents were added to the sample through a glass syringe with a capacity of 1000 µL (SGE Analytical Science, USA).
The detection of chromium by HR-CS FAAS was carried out through a ContrAA® 300 (Analytik Jena AG, Jena, Germany) equipped with a xenon short-arc lamp (XBO 301, 300 W, GLE, Berlin, Germany) operating in hotspot mode. The measurements were made at 357.9 nm, the main line of chromium. The other instrumentation conditions used were: air flow 490 L h-1, acetylene flow
110 L h-1, burner height 13 mm, sample flow rate at
6 mL min-1 and spectral resolution 0.2 nm.
Results and Discussion
Effect assessment of sample volume in analytical signal
In the proposed DLLME procedure, the volume
produced within the organic phase, containing the analytes extracted in 1-undecanol, was 45 µL. Even after dilution, the final volume with ethanol did not enable the continuous nebulization process in the detection. As result, it was then decided to carry out discrete nebulization. Discrete volumes (50 to 200 µL) of a solution containing Cr 50 µg L-1
obtained from the DLLME procedure were manually added to a pipette tip (20 to 200 µL) connected to the nebulizer aspiration tube.27 By keeping the instrumental parameters
as above mentioned and a reading time of 10 s, transient signals were produced and then measured at peak area. Taking into account that the manual insertion of the sample can lead to a higher standard deviation of measurements, the sample volume selected was based on the peak area and corresponding relative standard deviations (n = 3). The intensity of peak area increased with the sample volume, and the relative standard deviations reached 15, 11, 7.0 and 7.7% for volumes of 50, 100, 150 and 200 µL, respectively. A sample volume insertion of 200 µL was selected for further experiments.
Oviedo et al.28 achieved analytical calibration curves
by performing continuous and discrete nebulization of Mo in an aqueous and organic medium. The ratio of angular coefficients of analytical calibration curves of samples in an organic medium obtained by discrete and continuous nebulization was around 10, displaying an increased sensitiveness level. That is, another advantage from discrete nebulization in addition to a reduced sample volume.
Optimization of flame composition in chromium detection
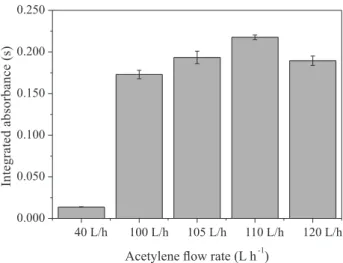
A study was carried out for flame composition in chromium analytical signal. Five different flame compositions were assessed with acetylene flow rate at 40, 100, 105, 110 and 120 L h-1 and by also keeping the
air flow rate at 490 L h-1 (C:O 0.40; 0.97; 1.0; 1.1 and
1.2, respectively). Figure 1 shows that the stoichiometric flame with a C:O 0.40 ratio has the lowest sensitiveness level. On the other hand, in an air-acetylene flame formed by composition of 490 and 110 L h-1 air-acetylene,
respectively (C:O 1.1), it was observed the highest sensitiveness level. A strategy widely used to increase sensitiveness in determining chromium consists of using a reducing flame;29,30 however, as noticed in Figure 1, in
higher flow rates of acetylene at 120 L h-1, for example,
the reduction of sensitiveness can be the result of carbides formation which makes the atomization process difficult. Thus a flame composition of 490 and 110 L h-1 of air
DLLME procedure optimization
The DLLME procedure was optimized by using multivariate designs in an Excel spreadsheet. The integrated absorbance signal achieved after microextraction was based on Origin®, version 9.0 (Copyright© 1991-2012, OriginLab
Corporation) and Statistica®, version 10 (Copyright©
1984-2011, StatSoft). The optimization study was carried out independently for CrIII and CrVI.
In order to perform the first screening of assessed variables, a fractional factorial design 2v5-1 was carried out.
Table 1 shows all the factors studied and their respective levels, Table S1 (APDC complexant) and Table S2 (DDTC complexant) (Supplementary Information section) complete matrix of factorial design and integrated absorbance values.
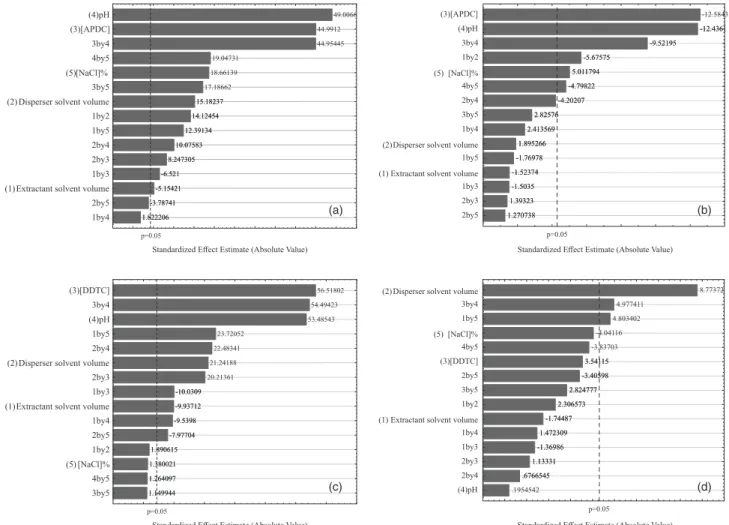
Along with the results displayed in Tables S1 and S2, Pareto charts are presented in Figures 2a-2d, making it possible to assess the influence of variables and interaction between them on the analytical response. The horizontal bars represent the absolute values of estimated effects, while the vertical bar is known as a reference line. The effects that go beyond the reference line are significant
for the analytical response within the confidence interval of 95% (p < 0.05).31
Figures 2a and 2b show that the two chromium species have the most significant effects for variables, pH value, complexant concentration and interaction between them, thus enhancing the importance of both variables in the DLLME procedure. At low pH values, CrIII is complexed
with water molecules forming aqua complexes which are kinetically inert. By increasing pH value, the water molecules are then replaced with OH− ions, forming
complexes with higher lability thus increasing the interaction of CrIII with complexant reagent molecules
APDC and DDTC.26,32-37 The pH value is one of the
variables allowing the speciation of chromium, as different from CrIII, the hexavalent specie is immediately reduced to
the trivalent form in the presence of the complexant agent, thus quickly forming the complexes.
Figure 2c indicates the same occurrence to variables, pH value, complexant concentration and interaction between them show significant. As for CrVI, Figure 2d, the
only variable seen as significant was the disperser solvent (ethanol) volume.
Based on the results from the fractional factorial design and considering: (i) the need to keep the concentration of complexants, APDC and DDTC, in excess related to the chromium species in order to ensure the quantitative complexation in the presence of other metal ions; (ii) the value of pH is one of the variables allowing the speciation of chromium; (iii) the increase of extractant solvent volume (1-undecanol) results in a reduced analytical signal due to lower enrichment factor; and (iv) the increase of electrolyte concentration displayed a positive effect on complex CrIII/APDC it was then decided to carry out a factorial
design 32 with variables, pH value and disperser solvent
in complexation and extraction of CrIII with APDC and
DDTC. The remaining variables such as 6.0 mmol L-1 of
APDC and DDTC (highest level), 50 µL of 1-undecanol (lowest level), 5.0% (m/v) of NaCl (highest level) for CrIII/APDC and 0.0% (no addition) of NaCl (lowest level)
for CrIII/DDTC were kept constant.
The design experimental matrix generated a total of 11 experiments, and the values of integrated absorbance are shown in Table S3 (Supplementary Information section). Table 2 shows statistical results calculated to 32 factorial
design.
Taking into account the results presented in Table 2, it can be observed that just the average was considered significant within 95% confidence interval (p-value < 0.05). The factors investigated did not present significance within 95% interval because all p-values were higher than 0.05.
Figure 1. Flame composition study. Experimental conditions: 1000 µg L-1
CrIII, 6.0 mmol L-1 APDC, 0.02% (v/v) NH
4OH (pH = 7.0), NaCl 5% (m/v),
200 µL of 1-undecanol and 300 µL ethanol. Air flow rate: 490 L h-1.
Table 1. Factors and levels assessed to fractional factorial design 2v5-1
Factor Level
(−1) (0) (+1)
pH 2.0 4.5 7.0
Complexant concentration / (mmol L-1) 0.40 3.2 6.0
Extractant volume / µL 50 125 200
Disperser volume / µL 100 200 300
The lack of fit test returned Fcalculated (MSlack of fit/MSpure error)
equal to 4.33 for CrIII/APDC and 0.57 for CrIII/DDTC,
lower than Fcritical0.05,v1=3,v2=2 = 19.16, which indicates
absence of lack of fit within 95% confidence interval (Tables S4 and S5, Supplementary Information section). The regression significance test returned the value of Fcalculated
(MSmodel/MSresidual) equal to 0.91 for CrIII/APDC and 2.84
for CrIII/DDTC, lower than F
critical 0.05,n1=5,n2=5 = 5.05 which
indicates a no significant regression within 95% confidence interval (Tables S4 and S5, Supplementary Information
section).31 However, taking into account that the percentage
of variation explained by regression and maximum percentage of variation explained can be considered acceptable and the models residue for CrIII/APDC
and CrIII/DDTC presented normal behavior through
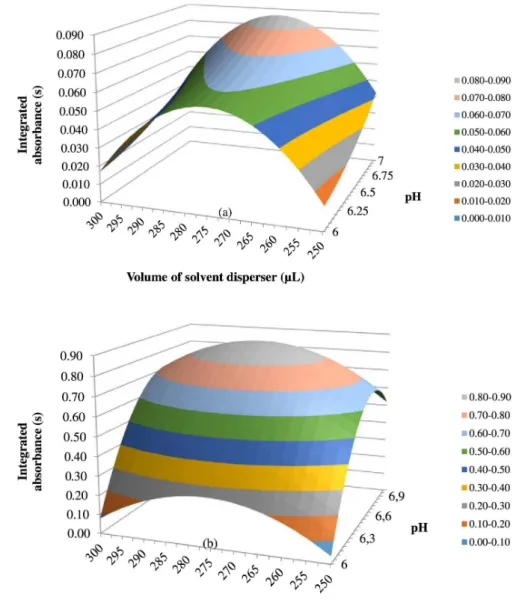
Shapiro-Wilk test for 95% confidence (p-value > 0.05), the response surface was built from the experiments.
Figures 3a and 3b, these graphs show that by using APDC, optimal conditions for DLLME were disperser solvent volume 275 µL and pH value 7.0, and also using Figure 2. Pareto charts achieved in optimizing factors from fractional factorial design 2v5-1 (a) CrIII with APDC; (b) CrVI with APDC; (c) CrIII with DDTC;
(d) CrVI with DDTC.
Table 2. Statistical results for 32 factorial design
Factor Cr
III with APDC CrIII with DDTC
Coefficient Error p-value Coefficient Error p-value
Constant 0.067 0.011 0.024 0.827 0.146 0.030
X1 0.014 0.008 0.231 0.249 0.117 0.166
X2 0.002 0.008 0.866 0.030 0.117 0.821
X1X1 0.005 0.013 0.755 −0.325 0.179 0.212
X2X2 −0.042 0.013 0.084 −0.194 0.179 0.390
X1X2 −2E-04 0.010 0.989 0.010 0.143 0.951
DDTC the best conditions for DLLME corresponded to the central point, that is, 275 µL of disperser solvent and pH value of 6.5.
For CrVI based on the results obtained from the fractional
factorial design, Figures 2b and 2d, and considering:
(i-iii) as previously mentioned for CrIII; (iv) that the increase
of concentration of electrolyte displayed a positive effect on complex CrVI/APDC and (v) that the only significant
variable for CrVI/DDTC was the disperser solvent volume,
it was also decided to assess the disperser solvent (ethanol) volume influence on microextraction of CrVI with DDTC.
The other variables were maintained fixed: 6.0 mmol L-1 of
DDTC (highest level), pH value 2.0 (lowest level), 0.0% (no addition) of NaCl (lowest level) and 50 µL of 1-undecanol (lowest level).
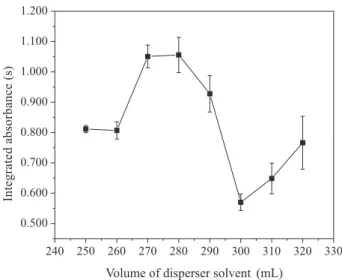
Figure 4 shows an increased integrated absorbance up to 280 µL of disperser solvent. In DLLME, the disperser
solvent promotes the extractant solvent dispersion in aqueous solution, but an excess of disperser solvent should be avoided due to an increase in solubility of hydrophobic complex in aqueous phase, thus its reduced quantity in the organic phase.19 Even though the integrated absorbance
displayed a slight increase at 310 and 320 µL of disperser solvent (Figure 4) the analytical signal was kept below the initial volumes, 250 and 260 µL. As the extraction efficiency was higher between 270 and 280 µL of disperser solvent, we decided then to keep the volume of 275 µL for remaining part of this study.
In summary, using DDTC the selected experimental conditions as follows: value of pH 2.0 for CrVI and pH 6.5
for total Cr, concentration of DDTC 6.0 mmol L-1, with
no addition of NaCl, 50 µL for 1-undecanol and 275 µL of ethanol. By using APDC, conditions as follows: value of pH 2.0 for CrVI and pH 7.0 for total Cr, concentration
of APDC 6.0 mmol L-1, 5.0% (m/v) NaCl, 50 and 275 µL
of 1-undecanol and ethanol, respectively, for total Cr and 300 µL of ethanol for CrVI.
The reaction between CrIII and APDC is then accelerated
by heating the solution prior to the extraction procedure.26,33,35,36
To assess the influence of temperature and time on formation of the CrIII complex with APDC after adjusting pH value
(7.0) and addition of APDC (6.0 mmol L-1) to an aqueous
solution containing 50 µg L-1 of CrIII, the resulting solution
was heated to 80 °C for 15 minutes26 and after cooling at
room temperature, microextraction took place. Integrated absorbance increased by 32 times in compared with the absorbance achieved without the heat step, thus showing the importance of the latter in higher sensitivity.
To select the type of complexant, the DLLME procedure was followed (n = 3), using experimental conditions previously selected and a heating step using APDC at pH 7.0, in aqueous solutions containing a mixture of CrIII and CrVI
50 µg L-1. The selection of complexant was based on both
the peak area and the relative standard deviations (RSD). At pH 2.0 (CrVI), integrated absorbance corresponded to 0.129
(RSD 21%) and 0.257 (RSD 3.2%) for DDTC and APDC, respectively. For total chromium-pH 6.5 (DDTC) and pH 7.0 (APDC)-the values of integrated absorbance were respectively 0.469 (RSD 9.3%) and 0.418 (RSD 0.98%). Apart from the lowest relative standard deviation using APDC for CrVI and total chromium, it was possible to notice
that the analytical signal was twice as high for determining CrVI with APDC. It was then decided to use APDC as
the complexant in the DLLME procedure proposed for determination and speciation of chromium. Table 3 shows optimal conditions for the DLLME procedure as well as for detection by HR-CS FAAS.
Analytical features of the proposed method
The analytical curves were achieved with and without the DLLME procedure (DLLME-HR-CS FAAS and HR-CS FAAS). Both curves were also obtained in triplicate and for the analytical curve without the DLLME procedure, the standards solutions of Cr were prepared in a medium of ethanol. Table 4 summarizes the analytical features for DLLME-HR-CS FAAS and HR-CS FAAS.
By comparing the angular coefficient of the analytical curves with and without the DLLME procedure, an increased level of sensitivity was obtained (26 times for CrVI and 19 times for total Cr). The combination of
DLLME and HR-CS FAAS made it possible to reach quantification limits considerably below the acceptable levels of Cr established for drinking water by the World Health Organization(WHO),38 Brazil’s Ministry of Health39
and European Drinking Water Directive of the European Union Council (EUC)40 of 50 µg L-1 and the Environmental
Protection Agency (EPA) of 100 µg L-1.41
Effect of foreign ions
The study of interfering elements is carried out, in general, in an univariate way, where only one ion is assessed at a time, although this type of study requires a Figure 4. Effect of disperser solvent (ethanol) volume for CrVI using
DDTC. Experimental conditions: 1000 µg L-1 CrVI, H
2SO4 (pH = 2.0),
6.0 mmol L-1 DDTC and 50 µL of 1-undecanol.
Table 3. Commitment conditions used for chromium speciation and detection
Variable Condition
Complexant agent APDC
Concentration / (mmol L-1) 6.0
pH 2.0 (CrVI)
7.0 (total Cr)
NaCl (m/v) / % 5.0
Heat temperature and time total Cr 80°C for 15 min Extractant solvent / µL 50 (1-undecanol) Disperser solvent / µL ethanol 300 (CrVI)
275 (total Cr) Centrifugation condition / rpm 2000 (for 3 min) Organic phase diluent / µL 200 (ethanol) Instrumental parameter
Wavelength / nm 357.9
Flame composition / (L h-1) 490 (air); 110 (acetylene)
Burner height / mm 13
Nebulization type discrete
Aspiration rate / (mL min-1) 6
Analytical signal peak area
Time of integration / s 10
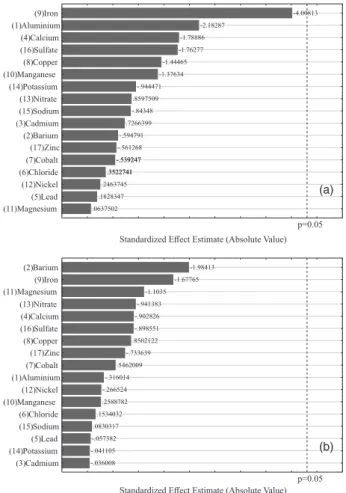
long time frame, as the ions are simultaneously present in the sample. In this paper, the study of foreign ions was conducted in a multivariate way by means of a two-level Plackett-Burman design allowing the calculation of the main effects of an experimental set through a reduced number of experiments.42,43
The foreign ions assessed were the following: aluminum, barium, cadmium, calcium, lead, chloride, cobalt, copper, iron, manganese, nickel, nitrate, potassium, sodium, sulfate and zinc. Except for chloride anions, nitrate and sulfate, the selection for the concentration of foreign ions was based on the value stated in the certified reference material NIST CRM 1643e (trace elements in water). The concentrations of foreign ions and levels assessed in the Plackett-Burman design are shown in Table S6 (Supplementary Information section).
Based on the design used, a matrix was designed with 27 experiments, out of which three correspond to the triplicate in the central point. For the DLLME procedure, the solution used was one containing 50 µg L-1
CrVI and CrIII in the presence of foreign ions as well as
in the conditions previously set (Table 3). The entire matrix and integrated absorbance values are displayed in Tables S7 and S8 (Supplementary Information section). Such values were used to design Pareto charts, Figures 5a and 5b, where it can be noticed that in the conditions as selected for the DLLME procedure, all the foreign ions did not interfere in the complexation, microextraction and detection of chromium, due to the fact that the variances encountered did not deviate any further from the reference line. As a result, they were not seen as significant for the analytical response within the confidence interval of 95% (p < 0.05).
Assessment of accuracy evaluation and applicability of the method to water samples
Table 5 shows the results obtained for the addition and Table 4. Analytical features of DLLME-HR-CS FAAS and HR-CS FAAS methods for CrVI and Cr total
DLLME-HR-CS FAAS CrVI Cr total
Analytical curve equation R2a
Linear range / (µg L-1)
LOD / (µg L-1)
LOQ / (µg L-1)
Repeatability (RSD)b / %
Relative sensitivityc
A = 5.1 (± 0.2) × 10-3 C
CrVI + 1.3 (± 5.0) × 10-3
0.9987 20-100 0.35
1.1 7 26
A = 3.7 (± 0.2) × 10-3 C
Cr total + 15 (± 6) × 10-3
0.9998 20-100 6.7
22 18 19
HR-CS FAAS Chromium
Analytical curve equation R2a
Linear range / (mg L-1)
LOD / (mg L-1)
LOQ / (mg L-1)
A = 0.198 (± 0.006) CCr total + 0.028 (± 0.006)
0.9994 0.5-3.0 0.032
0.11
aNumber of calibration points, n = 8; brelative standard deviation, n = 10, CrVI 20 µg L-1 and Cr total 80 µg L-1; csensitivity DLLME-HR-CS FAAS/sensitivity
HR-CS FAAS; DLLME-HR-CS FAAS: dispersive liquid-liquid microextraction high-resolution continuum source flame atomic absorption spectrometry; LOD: limit of detection; LOQ: limit of quantification.
recovery trials of CrIII and CrVI in different water samples
and for determining CrIII on certified reference material
NIST CRM 1643e (trace elements in water). Recovery values ranged from 88 to 115%, suggesting that the proposed method is free from matrix effect. According to the t-test carried out (at a confidence interval of 95%) there, were no significant differences between the values set and certified in the water reference material.
The proposed method was also applied to the detection of Cr in seawater, but both species of Cr were not detected. In order to compare the obtained results, total Cr was determined for mineral water 3 and seawater samples using the graphite furnace absorption atomic spectrometry (GFAAS) method. Table S9 (Supplementary Information section) presents information about the heating program using GFAAS, and some analytical features provided by the method. As obtained for the proposed method, Cr was not detected in both samples using GFAAS (LOD: 0.03 and LOQ: 0.10 µg L-1).
Comparison of the proposed method with those previous reported
Table 6 shows a comparison of some experimental conditions and analytical features with those attained in procedures for Cr speciation and/or determination using liquid phase microextraction (LPME) procedures and FAAS detection.26,27,44-46 The proposed method leads
to detection limits higher than or comparable to the ones obtained by using different chelating reagents and extractant solvents. The proposed DLLME procedure uses a reduced volume of non-chloride solvents and low toxicity by combining 1-undecanol as an extractant solvent and ethanol as a disperser solvent. Moreover, the speciation of Cr was performed without adding any other reagent such as KMnO4 for the oxidation of CrIII to CrVI or Na2SO3 to
reduce CrVI to CrIII, and the organic phase was introduced
without any previous evaporation of chloride solvent. The results presented in the study of influence from other ions, Figures 5a and 5b, as well as those presented in Table 5 showed the good method selectivity without the need to add masking agent such as ethylenediamine tetraacetic acid (EDTA), that are at times necessary to the elimination of the interference of other ions, Co, Fe and Ni, for the detection of Cr by FAAS.26,35,36 The
combination of DLLME with HR-CS-FAAS to detect Cr presents, in addition to the advantages previously showed, the possibility to a simultaneous correction of the background within the proximities of the analytical line, enabling to view the spectral region around the analytical line and automatic correction covering every continuum events.24
Conclusions
The development of analytical methods that allow speciation and determination of potentially toxic chemical
Table 5. Determination of CrIII and CrVI in water samples and certified reference materials using the proposed DLLME-HR-CS FAAS method
Sample Added / (µg L
-1) Found concentrationa / (µg L-1) Recovery / %
CrIII CrVI CrIIIb CrVI Cr total CrIII CrVI Cr total
Tap water
0.0 0.0 − < LOQ < LOQ − − −
20 20 19 ± 2 19.7 ± 0.1 39 ± 2 96 98 97
30 30 32 ± 8 31 ± 4 63 ± 5 107 103 105
40 40 36 ± 15 39 ± 5 75 ± 12 90 98 94
Mineral water 1
0.0 0.0 − < LOQ < LOQ − − −
20 20 18 ± 5 22 ± 1 40 ± 4 90 108 100
30 30 31 ± 3 33 ± 1 64 ± 3 103 111 107
40 40 36 ± 13 40 ± 1 76 ± 11 90 100 95
Mineral water 2
0.0 0.0 − < LOQ < LOQ − − −
20 20 20 ± 10 23 ± 2 43 ± 11 100 114 107
30 30 26 ± 19 32 ± 3 58 ± 17 88 106 97
40 40 38 ± 17 43 ± 2 81 ± 18 95 108 101
Mineral water 3
0.0 0.0 − < LOQ < LOQ − − −
20 2 23 ± 2 1.9 ± 0.5 25 ± 2 115 93 114
50 20 56 ± 1 20 ± 2 76 ± 5 112 100 109
CRM NIST 1643ec − − − − 16.01 ± 1.93 − −
aValue ± standard deviation, n = 3; bCrIII concentration was evaluated from the difference between total Cr and CrVI concentration, (value ± standard
deviation, n = 3); ccertified value 20.40 ± 0.24 µg L-1 Cr; At 95% confidence limit (n = 3) t
elements has become of paramount importance, mainly when toxicological characteristics are dependent on the oxidation state, which can be seen for CrIII and CrVI. The
DLLME procedure proposed in this paper made it possible to carry out the determination and speciation of chromium in different water samples by using reduced volumes of non-chloride solvents, 1-undecanol and ethanol, and a consequent reduction in residue produced. The combination of DLLME and HR-CS FAAS also made it possible to reach quantification limits, 1.1 and 22 µg L-1 for CrVI and total
Cr, respectively, considerably below the acceptable levels of Cr established for drinking water.
Supplementary Information
Supplementary data (tables and figures) are available free of charge at http://jbcs.sbq.org.br as PDF file.
Acknowledgments
This research has been supported by National Council for Science and Technological Development (CNPq) and São Paulo Foundation Research (FAPESP Project No. 2011/19730-3). We thank Rodrigo Papai (PhD student) for assistance with GFAAS water sample analysis.
References
1. Scancar, J.; Milacic, R.; J. Anal. At. Spectrom. 2014, 29, 427.
2. Markiewicz, B.; Komorowicz, I.; Sajnóg, A.; Belter, M.; Baralkiewicz, D.; Talanta2015, 132, 814.
3. Hsu, L. C.; Liu, Y. T.; Tzou, Y. M.; J. Hazard. Mater.2015, 296, 230.
4. Matović, Z. D.; Jeremic, M. S.; Jelic, R. M.; Zlatar, M.; Jakovljević, I. Z.; Polyhedron2013,55, 131.
5. Templeton, D. M.; Ariese, F.; Cornelis, R.; Danielsson, L.; Muntau, H.; Leeuwen, H.; Lobinski, R.; Pure Appl. Chem.
2000,72, 1453.
6. López-García, I.; Vicente-Martínez, Y.; Hernández-Córdoba, M.; Talanta2015,132, 23.
7. Galbeiro, R.; Garcia, S.; Gaubeur, I.; J. Trace Elem. Med. Biol.
2014,28, 160.
8. Rezaee, M.; Assadi, Y.; Hosseimi, M. R. M.; Aghaee, E.; Ahmadi, F.; Berijani, S.; J. Chromatogr. A2006,1116, 1. 9. Gong, A.; Zhu, X.; Talanta2015,131, 603.
10. Leong, M. I.; Fuh, M. R.; Huang, S. D.; J. Chromatogr. A 2014,
1335, 2.
11. Sereshti, H.; Khojeh, V.; Samadi, S.; Talanta2011,83, 885. 12. Pytlakowska, K.; Kozik, V.; Dabioch, M.; Talanta2013,110,
202.
13. Andruch, V.; Balogh, I. S.; Kocúrová, L.; Sandrejová, J.; J. Anal. At. Spectrom. 2013, 28, 19.
14. Gaubeur, I.; Aguirre, M. A.; Kovachev, N.; Hidalgo, M.; Canals, A.; Microchem. J.2015,121, 219.
15. Aguirre, M. A.; Legnaioli, S.; Almodóvar, F.; Hidalgo, M.; Palleschi, V.; Canals, A.; Spectrochim. Acta, Part B2013, 79, 88.
16. de Jesus, A. M. D.; Aguirre, M. A.; Hidalgo, M.; Canals, A.; Pereira-Filho, E. R.; J. Anal. At. Spectrom.2014,29, 1813. 17. Aguirre, M. A.; Selva, E. J.; Hidalgo, M.; Canals, A.; Talanta
2015,131, 348.
18. Aguirre, M. A.; Nikolova, H.; Hidalgo, M.; Canals, A.; Anal. Methods 2015, 7, 877.
Table 6. Comparison of the proposed method with other extraction methods for Cr determination
Sample treatment/ spectrometric technique
Chelating reagent
Extractant solvent / µL
Disperser solvent
Sample
volume / mL LOD / (µg L-1) Reference
DLLME/FAAS APDC 60 carbon
tetrachloride
2 mL ethanol 25 0.07 CrVI 0.08 total Cr 26
DLLME/MIS-FAAS APDC 100 carbon
tetrachloride
1 mL ethanol 40 0.037 CrVI − 27
RTILs-DLLME/FAAS DDTC 40 [C8MIM][PF6] 1 mL methanol 5 0.41 CrVI 1.00 CrIII 44
M-IL-CIA-DLLME/FAAS Schiff’s base 90 mg [Hmim][PF6] 500 µL ethanol 30 − 0.7 45
SALLME-IL/FAAS DPC 150 [C4mim][BF4] – 10 1.25 CrVI − 46
DLLME/HR-CS FAAS APDC 50 1-undecanol 300 µL CrVI
275 µL total Cr ethanol
9 0.35 CrVI 6.7 total Cr this work
LOD: limit of detection; DLLME: dispersive liquid-liquid microextraction; FAAS: flame atomic absorption spectrometry; MIS-FAAS: microsample injection system; RTILs: room temperature ionic liquids; APDC: ammonium pyrrolidine dithiocarbamate; DDTC: sodium diethyldithiocarbamate; [C8MIM][PF6]:
1-octyl-3-methylimidazolium hexafluorophosophate; M-IL-CIA: modified ionic liquid cold-induced aggregation; Schiff’s base: bis(2-methoxybenzaldehyde) ethylene diimine; [Hmim][PF6]: 1-hexyl-3-methylimidazolium hexafluorophosphate; SALLME-IL: salt-assisted liquid-liquid microextraction with ionic
19. Gaubeur, I.; Aguirre, M. A.; Kovachev, N.; Hidalgo, M.; Canals, A.; J. Anal. At. Spectrom.2015, 30, 2541.
20. Vidal, L.; Silva, S. G.; Canals, A.; Nóbrega, J. A.; Talanta2016,
148, 602.
21. Paz-Rodríguez, B.; Domínguez-González, M. R.; Aboal-Somoza, M.; Bermejo-Barrera, P.; Food Chem.2015,170, 492. 22. Oliveira, S. R.; Raposo Jr., J. L.; Neto, J. A. G.; Spectrochim.
Acta, Part B2009,64, 593.
23. Oliveira, S. R.; Neto, J. A. G.; Nóbrega, J. A.; Jones, B. T.;
Spectrochim. Acta, Part B2010, 65, 316.
24. Welz, B.; Vale, M. G. R.; Pereira, E. R.; Castilho, I. N. B.; Dessuy, M. B.; J. Braz. Chem. Soc.2014, 25, 799.
25. Welz, B.; Morés, S.; Carasek, E.; Vale, M. G. R.; Okruss, M.; Becker-Ross, H.; Appl. Spectrosc. Rev.2010, 45, 327. 26. Hemmatkhah, P.; Bidari, A.; Jafarvand, S.; Hosseini, M. R. M.;
Assadi, Y.; Microchim. Acta2009, 166, 69.
27. Baig, J. A.; Hol, A.; Akdogan, A.; Kartal, A. A.; Divrikli, U.; Kazi, T. G.; Elci, L.; J. Anal. At. Spectrom.2012, 27, 1509. 28. Oviedo, J. A.; de Jesus, A. M. D.; Fialho, L. L.; Pereira-Filho,
E. R.; Quim. Nova 2014,37, 249.
29. Welz, B.; Sperling, M.; Atomic Absorption Spectrometry, 3rd ed.; Wiley-VCH: Weinheim, Germany, 1999.
30. Aggett, J.; O’Brien, G.; Analyst1981, 106, 497.
31. Montgomery, D. C.; Design and Analysis of Experiments, 6th ed.; Wiley: New York, USA, 2004.
32. Kotaś, J.; Stasicka, Z.; Environ. Pollut. 2000, 107, 263. 33. Paleologos, E. K.; Stalikas, C. D.; Tzouwara-Karayanni, S. M.;
Pilidis, G. A.; Karayannis, M. I.; J. Anal. At. Spectrom.2000,
15, 287.
34. Chen, H.; Du, P.; Chen, J.; Hu, S.; Li, S.; Liu, H.; Talanta2010,
81, 176.
35. Paleologos, E. K.; Stalikas, C. D.; Karayannis, M. I.; Analyst
2001, 126, 389.
36. Tsogas, G. Z.; Giokas, D. L.; Vlessidis, A. G.; Evmiridis, N. P.; Spectrochim. Acta, Part B2004,59, 957.
37. Chwastowska, J.; Skwara, W.; Sterlinska, E.; Pszonicki, L.;
Talanta2005,66, 1345.
38. World Health Organization (WHO), Guidelines for Drinking-Water Quality, http://www.who.int/water_sanitation_health/ dwq/fulltext.pdf., accessed in May 2016.
39. Ministério da Saúde, Portaria No. 2914, Dispõe sobre os Procedimentos de Controle e de Vigilância da Qualidade da Água para Consumo Humano e seu Padrão de Potabilidade, de 12 de Dezembro de 2011; http://bvsms.saude.gov.br/bvs/ saudelegis/gm/2011/prt2914_12_12_2011.html, accessed in May 2016.
40. European Commission (EC); Council Directive 98/83/EC;
Quality of Water Intended for Human Consumption; Off. J. Eur. Communities L330 (05/12/1998) 0032-0054, http://ec.europa. eu/environment/water/water-drink/legislation_en.html, accessed in May 2016.
41. United States Environmental Protection Agency (US EPA); Chromium in Drinking Water; http://www.epa.gov/ dwstandardsregulations/chromium-drinking-water, accessed in May 2016.
42. Carletto, J. S.; Roux, K. C. D. P.; Maltez, H. F.; Martendal, E.; Carasek, E.; J. Hazard. Mater.2008, 157, 88.
43. Callao, M. P.; TrAC, Trends Anal. Chem.2014,62, 86. 44. Wen, S.; Wu, J.; Zhu, X.; J. Mol. Liq. 2013, 180, 59. 45. Zeeb, M.; Ganjali, M. R.; Norouzi, P.; Food Anal. Methods
2013, 6, 1398.
46. Majidi, B.; Shemirani, F.; Microchim. Acta2012, 176, 143.
Submitted: February 11, 2016 Published online: June 7, 2016