Nota Técnica
*e-mail: [email protected]
CONSTRUCTION AND APPLICATION OF A PORTABLE MICROCONTROLLED TURBIDIMETER FOR THE IN
SITU DETERMINATION OF SULFATE
Vagner B. dos Santos, Thiago B. Guerreiro, Ronaldo C. Faria e Orlando Fatibello-Filho*
Departamento de Química, Universidade Federal de São Carlos, Centro de Ciências Exatas e de Tecnologia, CP 676, 13560-970, São Carlos-SP, Brasil
Willian T. Suarez
Departamento de Química, Universidade Federal de Viçosa, Centro de Ciências Exatas e Tecnológicas, 36570-000, Viçosa-MG, Brasil
Recebido em 27/4/11; aceito em 5/10/11; publicado na web em 4/1/12
This study reports on the construction of a turbidimeter employing light emitting diodes as radiation source at a wavelength of 405 nm, a photodiode as detector, a temperature sensor and a microcontroller used for data acquisition and processing. The turbidimeter was applied to determine sulfate concentrations in natural water employing barium chloride as reagent. Potential interferences and recovery studies were performed and an interference of 3.5 % and a recovery between 97.8 and 108 % were estimated. The analytical performance of in situ turbidimeter for the determination of sulfate was evaluated and compared with two commercial spectrophotometers and a good agreement was obtained.
Keywords: turbidimetry; in situ analyses; sulfate determination.
INTRODUCTION
Water pollution is a major problem all around the world. Human activities such as uncontrolled urbanization and industrialization are factors that have most contributed to increased pollution, because large quantities of waste are released directly into the water without pretreatment.1,2 High concentration of organic waste has contributed
to the increased level of sulfate in environmental water and these polluting activities may lead to irreversible changes in many aquatic ecosystems because sulfate is a potential micronutrient for several plant species. Studies have shown that small variations in sulfate levels can lead to a loss of the aquatic moss Fontinalis antipyretica used as a biomarker.3 There is evidence found in this study that the pollution
from certain activities were responsible for a loss of this plant species. Sulfate has been determined using a classical gravimetric proce-dure employing barium chloride as a precipitant agent;4 however, this
method is time-consuming and laborious. Researchers have therefore modified this procedure with the aim of reducing the analysis time, minimizing sample and reagent consumption and increasing the sensitivity of method.4-6 In order to enhance the detection of sulfate,
techniques such as AAS (Atomic Absorption Spectrometry),7
HG-ICP-OES (Hydride Generation-Inductively Coupled Plasma Atomic Emission Spectroscopy),8 capillary electrophoresis,9 and
potentiome-try with sulfate10 and barium11ion-selective electrodes have also been
employed for direct and indirect determination of sulfate.
However, some of these methods require expensive instrumenta-tions and high maintenance cost, and often not portable, and this can render in situ analysis of sulfate problematic. Because such equipment cannot be transported to the field, the following conventional proce-dures are often employed: sampling, collection, storage, packaging, transport, and analysis in the laboratory. Those procedures can lead to a substantial loss of substance or changes in sample properties that may occur during the analyses, and may also increase the chance of contamination and analysis cost.12In situ analyses are fast, reliable,
easy to use, and offer good precision and accurate results in compa-rison with conventional laboratory methods. A viable alternative to
overcome these disadvantages is the use of a portable instruments based on microcontrollers as central processing units (CPU) and light emission diode as radiation source, and photodiodes as detector because of their small size and low power consumption.
Microcontrollers are sophisticated devices with various integrated peripherals, such as memory, digital and analog ports for input and output data, clock and analog-to-digital converters.13 Because of these
features, microcontrollers are employed as CPU in portable device such as digital cameras, cellular phones, audio devices, and analytical ins-truments. Microcontrollers are used for sensing on physico-chemical14
and biological parameters;15 and they are also applied to the fields of
computer sciences and electrical engineering.16 Microcontrollers have
been used for a range of applications including chemistry mainly due to the low cost and fast analysis time provided by these devices and the possibility to develop miniaturized system because of their small size, low power consumption and multi-functionality.17-20 There are
few articles that present the use of LED (Light Emitting Diodes) and microcontrollers for turbidimetric analysis,19-21 however this study
proposes a simple and easy-to-use portable turbidimeter (does not use a microcomputer) that presents a temperature control system useful for in situ analyses to determine sulfate in water samples.
EXPERIMENTAL
Reagents and solutions
Deionized water (resistivity >18.2 MΩ cm) was obtained from a Milli-Q plus system (Millipore Corp., USA) and was used to prepare all aqueous solution. Stock solutions of 15 % (m/v) barium chloride, 500 mg L−1 sodium sulfate and 1.5 % (m/v) polyvinyl alcohol were
Instrumentation
A spectrophotometer model UV-2550 (Shimadzu, Japan) and a spectrophotometer model USB-2000 (Ocean optics, USA) equipped with an optical fiber model Ps 50-2 were employed as reference instruments. In both instruments, a 1.0 cm quartz cuvette was used. A LED (InGaN) model L200CUV405-8D (LEDtronics, USA) with a bandwidth (λ1/2 max) of 15 nm was used as a radiation source at 405
nm. A TSLB 257 (Texas Instruments, USA) and a LM35 (National Semiconductor, USA) was used as photodetector and temperature sensor, respectively.22,23 A microcontroller PIC18F4550 (Microchip,
USA) was employed as central processing unit (CPU).13 An Orion
model EA 940 (USA) pH meter equipped with a combined glass electrode (Analion, model V 620) and an external Ag/AgCl (3.0 mol L−1KCl) reference electrode was used to verify the pH of the
solu-tions. A USB interface model NI-6008 (National Instruments, USA)24
coupled to a microcomputer equipped with a Pentium 4 processor was employed to acquire data by the microcontrolled turbidimeter. This interface has a 12-bit resolution and a sample rate of 10 kS/s (Samples/second). Variations in temperature were measured using a portable digital thermometer Instrutherm® model TE-400 with a
resolution of 0.1°C.
Development of the microcontrolled turbidimeter with temperature control
The TSLB 257 sensor combines a photodiode and a transim-pedance amplifier on a single monolithic CMOS (complementary metal-oxide-semiconductor) integrated circuit with a color filter over the photodiode. Thus, this sensor is specific for detections in the wa-velength region of 400 - 480 nm. The TSLB 257 has a transimpedance gain of 320 MΩ with improved offset voltage stability with a low noise (4 mV) and current consumption of 10 mA.22 The LED model
L200CUV405-8D employed has maximum emission intensity in the blue-violet region of the electromagnetic spectrum (405 nm), on exactly the same wavelength of maximum sensitivity of the sensor. The sensor and LED were connected to the microcontroller and the analog response was converted to a digital signal through the AD (analog to digital) channel, analog input (AN0), of the PIC18F4550 with 10 bit resolution.13
The LM35 device was used for monitoring the temperature.23
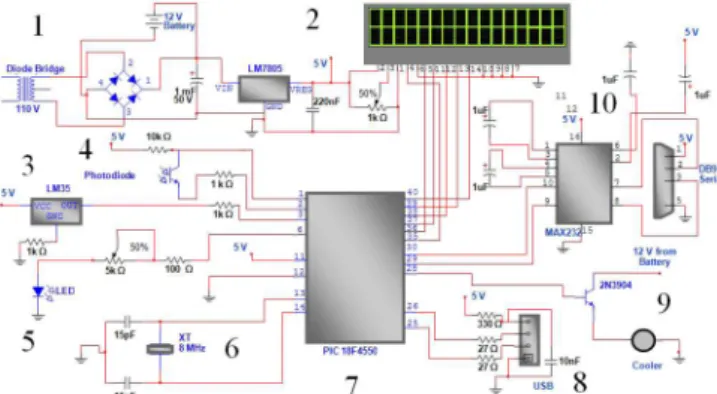
With an increase in the temperature at the optical compartment (LED, photodiode and cuvette), this sensor generated a voltage proportional to the temperature variation at the pin 2 (output). Each change of 1.0 °C corresponds to 10 mV. This potential variation is collected by the PIC through the AD channel, analog input (AN1) of the microcontrol-ler. When the collected voltage corresponds to a temperature above 25 °C, the microcontroller sends a current of 25 mA with an electric potential of 5 V to port D5 (pin 28 of the PIC18F4550) activating the 2N3904 transistor, which supplies a current of 200 mA to the cooler. The calibration curve results should be stored in EEPROM of the PIC. The purpose of this procedure is to allow the user to set the turbidimeter to display temperature values in °C on the LCD screen. The full electronic circuit diagram for turbidimeter is shown Figure 1, with the PIC as CPU for switching the LED, sensor, cooler, recording of experimental data, and displaying the data on the LCD screen.
A rechargeable 12 V battery is able to supply 7000 mA h−1 to
the turbidimeter. This battery was adapted to the electronic circuit, as can be seen in Figure 1, supplying continuous power for a period of 30 h, which is extremely important for in situ analysis. Before, the obtained response is calculated in a preset integration process where an average of 60,000 data are collected at a short lapse (0.25 s) carried out by PIC. Once properly calibrated, the developed turbidimeter
was applied for in situ determination of sulfate. Measurements in the laboratory were performed in an acclimatized room at 20 ± 1 °C. When in the field, temperature control was carried out using the temperature sensor and the cooler embedded in the turbidimeter as can be seen in Figure 2 (A). In the Figure 2 (B) is shown the inside design of the developed turbidimeter.
In a previous work it was described the program written in C language, the processing of experimental data14,19 and a few details
on the use of the microcontroller as CPU.20 In this present work, a
full electronic circuit of turbidimeter with a microcontroller to ther-mal compensation for in situ sulfate determination was developed. Moreover, dedicated software for temperature control and a new design for the instrument were developed.
Figure 1. The electronic circuit of the turbidimeter is composed of the follo-wing main components: power supply (1), LCD screen (2), temperature sensor (3), photodiode (4), radiation source (5), crystal oscillator (6), central control unit (7), USB communication (8), cooler (9), and serial communication (10)
Signal-to-noise ratio tests and calibration of the microcontrolled turbidimeter
The most commonly used tests to demonstrate the quality of the results provided by the instruments is the stability of the signal and signal-to-noise ratio. For this, a NI-USB interface was coupled to the turbidimeter for acquisition and processing of data supplied by the turbidimeter. After this, a calibration curve of the temperature sensor was constructed aimed at monitoring the temperature during measurements. For this, a digital thermometer was used as a reference. The temperature of the sensor was allowed to vary from 17 to 60 °C using conductive ceramics based on LTCC (low temperature co-fired ceramics) by changing of the applied potential.25-27 The signal was
recorded and a calibration curve was obtained. Analytical application: factorial design for sulfate determination
In order to determine sulfate in natural water using the method based on the precipitation reaction with barium sulfate, four variable (analyte (A), reagent (R), surfactant (S), and pH) were simultaneously studied, applying a 24 factorial design with replicate (n = 3) for the
central point. Thus, a total of 19 experiments were evaluated, 16 of the 24 design and 3 at the central point. The obtained results were
presented in the Table 1. RESULTS AND DISCUSSION
Tests of stability and signal-to-noise ratio of the turbidimeter
In order to perform the signal-to-noise ratio test, the data acqui-red from the turbidimeter coupled to the interface were plotted and presented on the computer screen. For this purpose, NI-DAQmx®
software furnished by National Instruments was employed with LED switched on (the reference signal was recorded) and off (the spurious signal (instrumental noise) was recorded).24
When the analyses are started, the radiation emitted by the LED reaches the sensor generating a peak of ca 4.60 V during 0.25 s. On the other hand, in the absence of radiation (LED switched off) the noise was very low with an average of 0.037 V. In addition, the useful signal presented a relative standard deviation (RSD) of 0.07 %. Thus, the signal-noise ratio (S/N) was estimated at ca 1429 (1/RSD × 100) to the developed turbidimeter.
Calibration of the temperature sensor
An advantage of the instrument design with microcontrollers is its ability to include calibration curves with thermal compensation. Therefore, in order to monitor the variation of temperature in the optical compartment, a calibration curve was obtained with temperature sensor (LM35) using a conductive ceramic based on LTCC.25-27 Thus, the
tur-bidimeter was calibrated for temperature ranging from 17 °C to 60 °C, as can be seen in Figure 1S, presented in supplementary information. As seen in Figure 1S, there is a linear correlation between tem-perature and the obtained signal (r = 0.997). This equation (Y (A.U.) = − 4512.00 + 383.13 × T(°C)) was recorded in the EEPROM memory of the microcontroller and thus, the data could be displayed on the LCD in Celsius degree (°C). A digital thermometer was used as a reference for temperature measurement.
Baseline stability test of the turbidimeter in battery module
The battery module was switched on to verify the portability and
stability of the developed turbidimeter. It was tested in two different environments, one under controlled temperature (acclimatized room) and another in an environment subjected to temperature variation. Analyzing the data presented in Figure 2S (presented in supplemen-tary information), there is no statistical difference between both data sets obtained in each temperature at a confidence level of 95%. In fact, when operated using a rechargeable battery the turbidi-meter provided good stability with an RSD of 0.08 % for a period of 30 h. A longer operating time can be obtained if many batteries are used in parallel connection, however increasing the cost and size of the turbidimeter. Moreover, the software automatically places the equipment in a standby mode when not in use (the LED, cooler and many functions of the microcontroller are switched off), which significantly reduces power consumption. The LED and photodiode used do not show a significant variation in performance when used in the temperature range between 20-35 °C due to the efficiency of cooling for temperatures higher than 25 °C. The addition of a battery module allows users to increase the energy autonomy, portability and versatility of the turbidimeter. The turbidimeter consumes about 230 mA h−1, which is considered a low electric current consumption in
operational terms. However, because the response time of the turbi-dimeter is only about 0.25 s, many tests can be performed while the device is switched on in battery. When in use, the cooler is switched on only when the temperature is higher than 25°C. The battery module was designed for analysis in remote locations subject to temperature variations. This technique for field analysis is of paramount impor-tance to maintain the physical and chemical properties of samples and to obtain quick results with satisfactory precision and accuracy. Analytical application
Factorial design applied to sulfate determination
As can be observed in Table 1, all experiments carried out in the factorial design show distinct results which present a good selection of the studied variable levels. Each experiment of the 24 factorial
design used in statistic studies was performed in triplicate (Exp.1, Exp.2 and Exp.3) employing the proposed turbidimeter.
Observing Table 1, experiments 1 and 16 are completely antago-nistic and also present completely different results. When analyzing the experiment 5 and 1, it was observed that the variable surfactant in concentration of 0.01 (level (−)) allowed to obtain better result. Additionally, more acidic solutions (pH = 1) and higher concen-trations of reagent and analyte increase the turbidimetric signal. In addition, the reproducibility expressed in terms of RSD values is distinct to the experiments 2, 12, 14 and offering poor reproduci-bility to experiment 16. Thus, experiment 5 was selected because it showed the best results among all assays. In order to support the obtained data, it was noted that the concentration of 0.01 % (m/v) PVA is suitable to achieve good stability of the suspension in the concentration levels studied.
Interference and recovery studies
In order to evaluate environmental samples (lake water), many substances were properly analyzed as possible interferents. Thus, so-dium chloride, potassium dihydrogen phosphate, potassium chloride, calcium carbonate, magnesium chloride, potassium bromide, sodium nitrate and iron (III) chloride hexahydrate were added in a suspension containing 8.33 × 10⁻⁴ mol L−1 SO
4
2− (standard solution), 5.9 % (m/v)
BaCl2 and 0.01 % (m/v) polyvinyl alcohol at pH = 1 (0.1mol L −1
interference of 3.5 % was acquired when all concomitants were added. The interference study, which includes the presence of organic matter, such as humic and fulvic acids were also investigated. No interference was observed, due to the precipitation of these acids in acid solution (pH 1) prior to the determination of sulfate with barium chloride, as can be observed in the Figures 3S and 4S presented in supplementary information.
Moreover, the spectral interference could be avoided by using the LED and photodiode in infrared region (880 nm) as discussed in our previous article.19
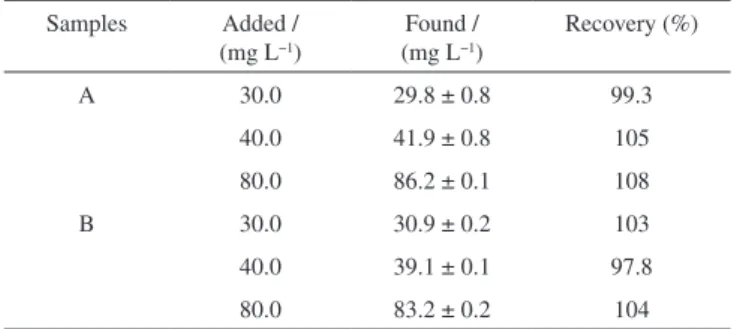
The natural water samples were collected at the dam of Monjolinho Lake in two distinct points (downstream and upstream). The samples were properly filtered and the additions of analytes in three different concentrations were studied. The results are shown in Table 2.
According to Table 2 a recovery percentage ranging from 97.8 to 108% was obtained. These values are acceptable and are in agreement with the evaluation of the effect of concomitant, thus, an analytical curve was constructed and water samples were analyzed.
Analytical performance
In order to evaluate the performance of the constructed turbidi-meter, analytical curves based on the previously optimized method (precipitation reaction of sulfate ions with barium chloride) were constructed using two commercial spectrophotometers (Ocean
Optics USB 2000 (Eq.1) and Shimadzu spectrophotometer UV- 2550 (Eq.2)) and the developed turbidimeter (Turb.). All measurements were carried out using a 1.0 cm cuvette and wavelength of 405 nm; the obtained results are shown in Table 3. The limit of detection was calculated using: LOD = 3×σb/ β. σb is the standard deviation of the blank with n = 3 and βthe analytical sensitivity.
As can be observed, the turbidimeter presented analytical sensi-tivity, reproducibility and a linear range that is compatible with the commercial equipment. However, the limit of detection (LOD) using microcontrolled turbidimeter was almost ten times lower than those obtained employing the commercial devices. The specific optical Table 1. Application of the 24 factorial design for sulfate determination. Assays 1 to 16 are of the factorial design and the last 3 at the central point
Assays Aa Rb Sc pH d Exp.1e/T.S. Exp.2e/T.S. Exp.3e/T.S. RSD (%)
1 + + + + 0.667 0.670 0.673 0.4
2 − + + + 0.207 0.184 0.187 6.6
3 + − + + 0.398 0.400 0.399 0.2
4 − − + + 0.140 0.140 0.145 2.2
5 + + − + 0.811 0.811 0.812 0.1
6 − + − + 0.249 0.251 0.248 0.7
7 + − − + 0.520 0.516 0.514 0.6
8 − − − + 0.149 0.148 0.145 1.3
9 + + + − 0.608 0.608 0.605 0.2
10 − + + − 0.173 0.172 0.172 0.2
11 + − + − 0.449 0.445 0.445 0.6
12 − − + − 0.088 0.093 0.100 6.3
13 + + − − 0.516 0.525 0.524 0.9
14 − + − − 0.091 0.088 0.104 8.8
15 + − − − 0.350 0.342 0.351 1.5
16 − − − − 0.061 0.065 0.065 3.4
17 0 0 0 0 0.320 0.318 0.323 0.8
18 0 0 0 0 0.283 0.282 0.280 0.5
19 0 0 0 0 0.308 0.311 0.315 1.1
aAnalyte, b barium chloride (reagent), c polyvinyl alcohol (surfactant), d pH solution adjusted with HCl,e Exp./T.S.= Experiment / turbidimetric signal in arbitrary
units (A.U.). Levels -, 0 and + of the variable: (A): 10, 60 and 110 mg L-1; (R): 0.1, 3.0 and 5.9 %; (S): 0.01, 0.05 and 0.09 % and (pH): 3.0, 2.0, 1.0, respectively.
Table 2. Recovery studies using water samples from the dam of Monjolinho Lake. The results are accompanied by their standard deviation values (n = 3)
Samples Added / (mg L−1)
Found / (mg L−1)
Recovery (%)
A 30.0 29.8 ± 0.8 99.3
40.0 41.9 ± 0.8 105
80.0 86.2 ± 0.1 108
B 30.0 30.9 ± 0.2 103
40.0 39.1 ± 0.1 97.8
80.0 83.2 ± 0.2 104
Table 3. Figures of merit obtained by turbidimetric method using the commercial spectrophotometers and the proposed device
Equipment Linear range/ (mg L−1)
Coefficient of Correlation (r)
Analytical sensitivity/ (A.U.)/(mg L−1)
LOD/ (mg L−1)
Coefficient of variation (n = 3) to 80 (mg L−1)
Eq. 1 10 – 130 0.994 0.0069 0.40 0.06 %
Eq. 2 10 – 150 0.992 0.0091 0.20 0.08 %
system based on a LED and very sensitivity sensor, equipped with an efficient microcontroller used as an acquisition and processing unit led to obtain the best results. The good stability of the power supply, radiation source and the efficiency of the integration process where an average of 60,000 data were obtained at each measurement generating a very good repeatability in a short time interval (0.25 s). All results were obtained in an acclimatized room in order to avoid changes in the physical-chemical properties of the formed suspension, necessary for efficient calibration.28,29
In situ turbidimetric determination of sulfate
Sulfate concentrations in water samples were determined in situ by employing the developed turbidimeter where parameters of the analytical curve and turbidimetric equation were recorded in its internal memory for the purpose of exhibiting the concentration of sulfate on the LCD screen in real time. The values of turbidity can also be presented in the LCD screen according to the user selection. For comparison purposes, measurements employing the commercial spectrophotometers were carried out. Water samples from the lake were analyzed to obtain the concentration of sulfate. For this purpose, turbidimetric determinations were performed with the commercial devices and the results showed that the sulfate concentrations were lower than the quantification limits for all the equipment and thus, outside the linear range of the constructed analytical curves, Table 3. Therefore, the samples were spiked with a standard sulfate solution of 5.2 × 10⁻³mol L−1 (500 mg L−1) to obtain a final concentration of 3.1
× 10−4 mol L−1 (30 mg L−1). Meanwhile, the commercial equipment
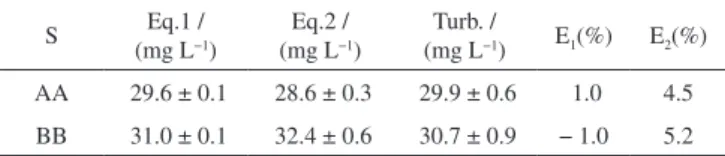
were maintained in an acclimatized room of the laboratory at 20°C, the turbidimeter in battery module was employed in situ to measure sulfate, subjected to changes in temperature, humidity and luminosity. During the measurements, the ambient temperature varied between 18°C and 28°C. Table 4 shows the obtained results to determine sulfate in water samples (S).
In the case of in situ determination, the results showed relative errors of less than 5.5 %. These results are quite satisfactory, since they were performed in the field and in real time, which preserves the characteristics of the samples. Applying the paired t-test to the obtained results using both methods, the calculated values of t (1.5) were smaller than the critical value (4.3, α= 0.05); one may conclude that the results obtained with the proposed procedure are not statis-tically different from those obtained in the comparative methods, at a 95 % confidence level.
Besides, the equipment was programmed to automatically and pe-riodically check the signal level at 60,000 data (baseline signal) used as reference by the microcontroller. Thus, when these data were more than 10 % discordant, the microcontroller has an alert system that is able to inform the user that a new calibration needs to be performed. Although the equipment made measurements at only 405 nm (blue LED), other LEDs with different wavelengths and photodiodes can be used in this equipment since the microcontroller may be connected to many LEDs and detectors simultaneously, as shown in detail in our previous work.19 This is possible because the microcontroller
has multiple analog and digital ports that can be used.14,18The arrays
of detectors and radiation sources connected to the microcontroller, allow a multi-function (multichannel) characteristic of the developed equipment, consequently increasing its applicability and robustness and decreasing the interference generated from colored matrices that may be observed. Currently, our research group is exploring these multifunction features of the microcontrolled equipment developed in this study to construct nephelometers, fluorimeters and photometers for analytical purposes.19,20
CONCLUSION
The microcontrolled turbidimeter showed good stability, accuracy and sensitivity for in situ determination of sulfate in water samples. The detection limit of the microcontrolled turbidimeter was better than those obtained using a commercial spectrophotometer with a relative error of less than 5.5 %. Portable devices such as the develo-ped turbidimeter has been shown to be advantageous because those instruments can be used to perform analysis in remote locations where the displacement of samples from one site to another is often difficult, and so, it is possible to retain the original characteristics of the samples. In fact, sulfates can be easily monitored by employing a low cost microcontroller turbidimeter designed to provide a fast and reliable response for in situ analyses.
SUPPLEMENTARY MATERIAL
Supplementary material (Figures 1S, 2S, 3S and 4S) is available free of charge at http://quimicanova.sbq.org.br, as PDF file. ACKNOWLEDGEMENTS
The authors are grateful to the Conselho Nacional de Desenvolvimento Científico e Tecnológico (CNPq), Fundação de Amparo à Pesquisa do Estado de São Paulo (FAPESP) and Coordenação de Aperfeiçoamento de Pessoal de Nível Superior (CAPES) for their financial support and scholarships. We also ac-knowledge Prof. Dr. M. O. de O. Rezende from IQSC-USP for kindly supply us humic and fulvic acids samples.
REFERENCES
1. Kurucu, Y.; Chiristina, N. K.; Environ. Monit. Assess. 2008, 136, 289. 2. USEPA, Drinking water advisory: Consumer acceptability advice
and health effects analysis on sulfate, 822-R-02_033, United States Environmental Protection Agency, 2002.
3. Davies, T. D.; Chemosphere 2007, 66, 444.
4. Liu, H.; Dasgupta, P. K.; Anal. Chim. Acta 1996, 326, 13.
5. Santelli, R. E.; Lopes, P. R. S.; Santelli, R. C. L.; Wagener, A. D. R.; Anal. Chim. Acta 1995, 300, 149.
6. Zárate, N.; Pérez-Olmosa, R.; Reis, B. F.; J. Braz. Chem. Soc. 2011, 22, 1009.
7. Chang, C. M.; Huang, H. J.; J. Chin. Chem. Soc. 1993, 40, 425. 8. Colon, M.; Iglesias, M.; Hidalgo, M.; Todoli, J. L.; J. Anal. At. Spectrom.
2008, 23, 416.
9. Gebauer, P.; Deml, M.; Bocek, P.; Janak, J.; J. Chromatogr. 1983, 267, 455.
10. Lomako, S. V.; Astapovich, R. I.; Nozdrin-Plotnitskaya, O. V.; Pavlova, T. E.; Lei, S.; Nazarov, V. A.; Okaev, E. B.; Rakhman’ko, E. M.; Egorov, V. V.; Anal. Chim. Acta 2006, 562, 216.
11. Ouzounian, G.; Michard, G.; Anal. Chim. Acta 1978, 96, 405. 12. Chen, Y.; Guo, Z.; Wang, X.; Qiu, C.; J.Chromatogr., A 2008, 1184,
191. Table 4. In situ determination of sulfate by turbidimetry employing the
equipment operating in battery module. Both commercial devices were used as reference. E1 and E2 are the relative errors of results supplied by the
com-parison between the proposed turbidimeter and Eq. 1 and Eq. 2, respectively S Eq.1 /
(mg L−1)
Eq.2 / (mg L−1)
Turb. /
(mg L−1) E1(%) E2(%)
13. http://www.microchip.com/, accessed December 2011.
14. Lima, R. S.; Santos, V. B.; Guerreiro, T. B.; Gaião, E. N.; Araújo, M. C. U.; Quim. Nova 2011, 34, 135.
15. Berg, R.; Koniger, M.; Schjeide, B. M.; Dikmak, G.; Kohler, S.; Harris, G. C.; Photosynth. Res. 2006, 87, 303.
16. Frankowiak, M. R.; Grosvenor, R. I.; Prickett, P. W.; Microprocessors and Microsystems 2005, 29, 189.
17. Martínez-Cisneros, C. S.; da Rocha, Z.; Ferreira, M.; Valdés, F.; Seabra, A.; Góngora-Rubio, M.; Chamarro, J. A.; Anal. Chem. 2009, 81, 7448. 18. Gaião, E. D.; Santos, S. R. B.; Santos, V. B.; Nascimento, E. C. L.;
Lima, R. S.; Araujo, M. C. U.; Talanta 2008, 75, 792.
19. Santos, V. B.; Guerreiro, T. B.; Suarez, W. T.; Faria, R. C.; Fatibello-Filho, O.; J. Braz. Chem. Soc. 2011, 22, 726.
20. Santos, V. B.; Guerreiro, T. B.; Suarez, W. T.; Faria, R. C.; Fatibello-Filho, O.; J. Braz. Chem. Soc. 2011, 22, 1968.
21. Garcia, A.; Perez, M. A.; Ortega, G. J. G.; Dizy, J. T.; IEEE Trans. In-strum. Meas. 2007, 56, 907.
22. http://www.alldatasheet.com/datasheet-pdf/pdf/203057/TAOS/TSLB257. html, accessed December 2011.
23. http://www.national.com/ds/LM/LM35.pdf, accessed December 2011. 24. http://sine.ni.com/nips/cds/print/p/lang/en/nid/201986, accessed
December 2011.
25. Ibanez-Garcia, N.;, Mercader, M. B.; Rocha, Z. M.; Seabra, C. A.; Góngora-Rubio, M. R.; Chamarro, J. A.; Anal. Chem. 2006, 78, 2985. 26. Vásquez-Alvarez, E.; Degasperi, F. T.; Morita, L. G.; Góngora-Rubio,
M. R.; Giudici, R.; Braz. J. Chem. Eng. 2010, 27, 483.
27. Suarez, W. T.; Pessoa-Neto, O. D.; Santos, V. B.; Nogueira, A. R. A.; Faria, R. C.; Fatibello-Filho, O.; Puyol, M.; Chamarro, J. A.; Anal. Bioanal. Chem. 2010, 398, 1525.
28. Shaw, D. J.; Introduction to colloid and surface chemistry, 4th ed.,
Butter-worth/Heinemann: Oxford, 1992.