Article
J. Braz. Chem. Soc., Vol. 26, No. 1, 64-73, 2015. Printed in Brazil - ©2015 Sociedade Brasileira de Química 0103 - 5053 $6.00+0.00
A
*e-mail: [email protected]
Multivariate Control Charts for Simultaneous Quality Monitoring of Isoniazid
and Rifampicin in a Pharmaceutical Formulation Using a Portable Near Infrared
Spectrometer
Fernanda S. L. Costa,a Ricardo H. P. Pedroza,a Dayanne L. Porto,b Marcelo V. P.
Amorimb and Kássio M. G. Lima*,a
aGrupo de Pesquisa Química Biológica e Quimiometria, Instituto de Química, Programa de
Pós-Graduação em Química and bNUPLAM, Universidade Federal do Rio Grande do Norte,
59072-970 Natal-RN, Brazil
Uma das chaves para manter a melhoria da alta qualidade de fabricação está no uso de cartas de controle. Neste trabalho, cartas de controle multivariada baseadas nos escores da componente principal mais significativa e no sinal analítico líquido foram desenvolvidas para monitoramento simultâneo da qualidade de dois princípios ativos (isoniazida e rifampicina) numa formulação farmacêutica (amostras produzidas no laboratório e na produção) empregando um espectrômetro portátil na região do infravermelho próximo. Os limites previstos em ambas as cartas multivariadas foram calculados a partir das especificações de qualidade da formulação farmacêutica (± 5% do valor nominal para cada princípio ativo). O uso das cartas de controle multivariadas forneceu uma simples e poderosa ferramenta para avaliar a formulação farmacêutica aliada a espectroscopia no infravermelho próximo. O procedimento é rápido e flexível para o monitoramento da produção desta formulação farmacêutica produzida na UFRN/Brasil, com o objetivo de introduzir a tecnologia analítica de processos ao tratamento de tuberculose pulmonar.
One of the keys to maintain high manufacturing quality improvement is the use of control charts. In this work, multivariate control charts based on significant principal component (PC) scores and net analytical signal (NAS) were developed to simultaneously monitor the quality of two active pharmaceutical ingredients (API) (isoniazid and rifampicin) in pharmaceutical formulation (laboratory samples and production samples) using a portable near infrared spectrometer. The limits for both multivariate charts were estimated using the quality specifications from the pharmaceutical formulation (± 5% of the nominal content of each API). The use of these multivariate control charts has provided a simple and powerful tool to evaluate the content of pharmaceutical formulations based on isoniazid and rifampicin capsules combined with near infrared spectroscopy. The procedure is rapid and adjustable for monitoring the production of the pharmaceutical preparations produced at UFRN/Brazil toward the process analytical technology (PAT) for the treatment of pulmonary tuberculosis.
Keywords: multivariate control chart, principal component analysis, net analyte signal, process analyte technology, near infrared spectroscopy
Introduction
The pharmaceutical industry traditionally employs batch processing with laboratory assays (identification of raw materials, homogeneity, moisture, particle size, hardness, dissolution testing, chemical composition, and polymorph) carried out on finished products to evaluate
non-destructive analysis, speed, low cost, automation and less consumption of chemicals and toxic reagents compared with wet chemical methods.
The Food and Drug Administration (FDA) launched the “Guidance for Industry PAT-A Framework for Innovative Pharmaceutical Manufacturing and Quality Assurance”,10 which describes a new regulatory framework [process analytical technology (PAT)]. The primary aim of PAT and quality by design (QbD) strategies is to increase the current understanding and knowledge of production processes. As a result of the FDA’s PAT initiative, PAT is now being promoted in the pharmaceutical industry to encourage the pharmaceutical industry to introduce and develop innovative processing systems that will improve the efficiency of manufacturing. In this situation, analytical methodologies based on NIRS must comply with the PAT.11,12
An area with increasing importance within PAT is multivariate data analysis (MVDA) including multivariate statistical process control (MSPC), which can provide a holistic view of a sample and its process fingerprint. Regulatory acceptance is already included in the original FDA PAT guidance. Although a process’s fingerprint (NIR spectrum, for example) can be used as a criterion for end processing or for taking specific control actions, a process fingerprint will define process supervision and control. In this context, chemometric techniques such as multivariate control charts have been applied for monitoring and diagnosis in multivariable processes.13 Several multivariate control charts applied in the pharmaceutical industry have been proposed based on principal component analysis (PCA),14,15 partial least squares,16,17 multivariate exponential weighted moving average (MEWMA),18 multivariate cumulative sum (MCUSUM)19 and net analyte signal (NAS).20-22 The goal of multivariate control charts is to build an empirical model of a set of measurements achieved under normal operating conditions (NOC). Statistical confidence limits are calculated when building the model, and it is possible to identify the samples that are “in” and “out” of control, concerning the concentration of their analytical parameter.
Multivariate control charts based on PCA present two different charts: a T2 chart using the most significant
principal components and a Q chart with the remaining principal components. Recently, Clavaud et al.14 proposed the use of the T2 chart to perform multivariate quality
monitoring of the cultivation of mammalian Chinese hamster ovary (CHO) cells in a fed-batch culture process with NIRS. NIR spectra and reference analytics data were computed using control charts to evaluate the monitoring abilities. The authors employed control charts of each media component under control by NIRS. Alcala et al.15 used a
noninvasive mode to develop qualitative methods based on PCA scores to monitor a wet granulation process with NIRS. The formulation contained active pharmaceutical ingredients (API) (10% m/m) and microcrystalline cellulose and maize starch as the main excipients. The proposed strategy provides excellent results for monitoring the granulation processes in the pharmaceutical industry using only the spectral data. Essentially, the advantages of the PCA chart in these studies can be summarized as follows: (i) generation of simple monitoring charts; (ii) easy tracking of the progress in each batch run and monitoring of the occurrence of observable perturbations; and (iii) easily interpretable T2 and Q charts.
Recently, new multivariate control charts based on the NAS applied in pharmaceutical formulations have been proposed to perform multivariate quality monitoring. Rocha et al.20 investigated the multivariate control charts based on NAS in conjunction with NIRS to monitor the quality of a pharmaceutical formulation containing nimesulide. In this study, it was possible to identify the samples that were outside the specifications concerning nimesulide concentration and to identify the presence of different constituents in the standard formulation. Recently, Rocha et al.21 built multivariate statistical control charts based on NAS and NIRS applied to the polymorphic characterization of piroxicam samples. In the case studied, the authors concluded that the methodology could identify piroxicam polymorphic forms that differed from the pattern normally present in specifications relative to form I of piroxicam. Skibsted et al.22 employed multivariate control charts based on NAS to monitor the homogeneity in pharmaceutical mixing processes using NIRS. The method presented by the authors was rapid, easy to use, non-destructive and provided statistical tests of homogeneity. The advantage of these charts based on NAS is that systematic variation in the product due to the property of interest is separated from the remaining systematic variation resulting from all the other compounds in the matrix. This could enhance the ability to flag products that are not within statistical control.
use of multicomponent analytical methods based on NIR spectroscopy can considerably improve the analytical control of the production process, which consequently improves the quality. In addition, the vast majority of published studies using multivariate control charts applied in pharmaceutical formulations contain a single active principle. The joint multivariate control charts for two active principles in a multicomponent formulation is challenging.
The aims of this paper were to build and validate multivariate control charts based on principal component analysis and net analyte signal for the quality monitoring of two API (isoniazid and rifampicin) of a pharmaceutical formulation produced at UFRN using a portable near infrared spectrometer. The new method is intended to replace the current method of choice, which uses high performance liquid chromatography (HPLC) for two API.
Theory
Fundamentally, to build a multivariate control chart based on PCA and NAS, an out-of-control indicator is required for diagnostic and corrective measures. In this sense, two steps are required: (i) (diagnostic) discover which measured variables contribute to the out-of-control signal and (ii) (corrective) determine what occurs in the process that perturbs the behavior of these variables.
Multivariate Shewhart control charts based on PCA
PCA is a multivariate analysis technique that extracts a new set of variables by projecting the original variables onto a principal component space. Essentially, there are some commonly used multivariate statistical control charts that use measures based on the PCA model23 including Shewhart charts,24 cumulative sums,13 scores monitoring and residual tracking (SMART) charts, and T2 and Q charts.25,26
Having established a PCA model based on data collected when only common use variation was present, future behavior can be referenced against this “in-control” model. In this sense, new multivariate observations can be projected onto the plane defined by the PCA loading vectors to obtain their scores (ti,new = pi
T y
new) and the residuals
enew = ynew – ŷnew, where ŷnew = PATA,new, tA,new is the (A × 1)
vector of scores from the model and PAis the (q × A) matrix
of loadings.
The presence of samples within the ± 2 s control limits in the Shewhart control chart built using the relevant PC scores or of trends and systematic behaviors in the score plot are clear indications of “out-of-control” processes (in this case, the content of the pharmaceutical formulation).
Multivariate statistical control charts based on NAS
In 2005, Witte et al.27 proposed a new methodology to perform multivariate product quality monitoring based on the NAS approach. Recently, Rocha et al.20,21 reported the theory regarding the NAS approach. Essentially, the main idea for the development of the control charts based on NAS is carried out in two stages: (i) model building; and (ii) calculation of statistical limits. The model consists of the decomposition of a sample spectrum (vector r) into three different contributions: rNAS, rINT and rres:
r = rNAS + rINT + rres (1)
where rNAS is a regression vector that is unique for the analyte, rINT is a vector that describes all variation due to the other compounds (interfering constituents) and rres is a residual vector.
Statistical limits are calculated in the second stage for the multivariate control chart in which a set of spectra that are statistically “in-control” are used (RNOC). To derive statistical limits for the NAS chart, the NAS value for each of the NOC spectra is computed as follows:
nasNOC = RNOCTbk (2)
where nasNOC is a vector with the NAS values of the individual NOC spectra. The mean (nasNOC) and standard deviation (sNOC) of the INOC NAS values are computed. With these values, the statistical limits (95% and 99.7% confidence limits) can be computed and plotted in the NAS chart. In other words, for the control charts based on NAS applied in pharmaceutical formulation, it is necessary to prepare one data set with “in-control” samples that must contain only the API and excipients.
The interference charts are built by projecting the RNOC matrix on the interference space. It is estimated that the projected “under control” spectra (named RINT) occupy a restricted region of the interference space. In the pharmaceutical formulation, the interference space is constructed with blank samples or placebo (only excipients). For the validation step on the control charts, it is necessary to have two data sets: (i) “out-of-control” samples that contain the API in concentrations outside of the specification and (ii) a data set with “in-control” samples.
Experimental
Samples
All of the chemicals used were either pharmaceutical or analytical grade. The studied pharmaceutical formulation (in capsule form) contained isoniazid (99.29%, Amsal Quality Control Laboratory, India) and rifampicin (98.87%, Sanofi Aventis, Italy) as the active principle, cellulose as the major excipients, and magnesium stearate, sodium starch glycolate and talc as the minor excipients. The capsules produced at UFRN were available in one absolute API content per dose. The capsules were uncoated, thus permitting diffuse reflectance.
Laboratory samples were prepared using a D-optimal experimental design (MODDE 4.0 from Umetrics, Umeå, Sweden), DoE. D-optimality of a design is performed when the classical symmetrical designs cannot be used because the shape of the experimental region is irregular or the number of experiments selected by a classical design is too large. The design contained 3 concentration levels within ± 5% of the nominal content of each active substance and excipient. A total of 30 different formulations were generated by the design software to efficiently represent the design space for the large number of possible combinations of these substances and 24 blank samples (12 for isoniazid and 12 for rifampicin). Samples containing only the excipients were also prepared. The laboratory samples were weighted on an analytical balance with an accuracy of 0.0001 g. Then, the samples were mixed for 3 min and vortexed for 1 min.
In addition, production lots were collected over a period of several months to include possible changes in sample constituent concentration, suppliers, process changes or variations in storage conditions up to a shelf life of 1 year, resulting in a total of 52 samples. These lots were also selected to ensure that each API concentration was included in the models covering a concentration range that was amenable to modeling.
“In-control” (± 5% around the nominal value for each active principle and excipient) and “out-of-control” (upper ± 5% of each substance) samples were prepared by the formulation development department using production department guidelines. To maintain industrial confidentiality, no detailed information about the chemical composition of the data sets can be given.
Apparatus
Spectra in the near infrared range of 950-2500 nm were recorded in triplicate using an ARCspectro FT-NIR
(Neuchâtel, Switzerland) with a spectral resolution of 8 cm−1. Thirty-two scans were co-added, and the diffuse reflectance mode was used. The mean spectrum for each tablet was then calculated by averaging the triplicate spectra. The portable NIR device uses an InGaAs photodiode (0.9 µm to 2.6 µm), and the reflected light was directed to the spectrometer via a bundle of optical fiber (model R600-7-VIS-125F, Ocean Optics, USA) linked to the probe end and controlled via ARCspectro ANIR 1.64 software. In addition, the instrument uses a miniature scanning Fourier-transform based on a lamellar grating interferometer (35 mm × 35 mm × 65 mm), and it also uses a micro-mechanical actuator. The powder samples were deposited on the aluminum-plated backing plate (0.1 mm sample thickness). The transflectance probe was positioned on the sample surface (less than 1 cm and 90° from the surface). The transflectance probe was washed with ethanol (70% v/v) and dried using tissue paper after each sample. The spectrum of a polytetrafluoroethylene (PTFE) sample was used as the background. The spectrometer was placed in an air-conditioned room (22 °C), and the samples were allowed to equilibrate to this temperature before analysis. After NIR analysis, the samples were subjected to reference analysis using HPLC. The API isoniazid and rifampicin were determined by performing isocratic analysis for each active compound using an HPLC instrument from Shimadzu (Kyoto, Japan) equipped with a degasser (DGU-20A5), pump (LC-20AT), auto-injector (SIL-20A), column oven (CTO-20A), SPD-M20A photodiode array detector and CBM-20A communication bus module. The Purospher Star® 250 mm × 4.6 mm × 5 µm column was obtained from Merck, and it was used at 25 °C. For each analysis, the mobile phases used were 96:4 v/v and 55:45 v/v phosphate buffer pH 6.8 and acetonitrile, respectively.
HPLC analysis
Multivariate control charts
Multivariate Shewhart based on the PCA scores
Data set 1 contains 106 NIR spectra obtained from the DoE (30 samples), blank (24 samples) and production samples (52 samples). For the development of the control charts based on PCA, subsets of calibration (42 “in-control” samples), named the cal set, subsets of validation (42 “out-of-control” samples), named the val set, and subsets of prediction (11 “in-control” and 11 “out-of-control” samples), named the pred set were generated.
Net analyte signal (NAS)
Data set 2 contains 106 NIR spectra obtained from the DoE (30 samples), blank (24 samples: 12 for isoniazid and 12 for rifampicin) and production samples (52 samples). For the development of the control charts based on NAS, one control chart for each API (isoniazid and rifampicin) was also prepared.
In the first control chart, 20 “in-control” samples (called set A1) containing the active principle (isoniazid) and excipients (cellulose, magnesium stearate, sodium starch glycolate and talc) were obtained from the DoE and the production sample; 12 blank samples (called set B1, only excipients) were prepared for the construction of the control chart and the interference space for isoniazid API. For validation of the control chart for isoniazid, 29 “out-of-control” samples for isoniazid (named set C1) were obtained from the production sample and 23 “in-control”
samples for isoniazid (named set D1) obtained from the DoE design and the production sample were prepared.
In the second control chart, 20 “in-control” samples (named set A2) containing the active principle (rifampicin) were obtained from the DoE and the production sample in excipients (cellulose, magnesium stearate, sodium starch glycolate and talc); 12 blank samples (called set B2, placebo) were prepared for the construction of the control chart and the interference space for isoniazid API. For validation of the control chart to rifampicin, 29 “out-of-control” samples containing rifampicin were obtained from DoE (named set C2) and 23 “in-control” samples for rifampicin (named set D2) obtained from the DoE design and the production sample were prepared.
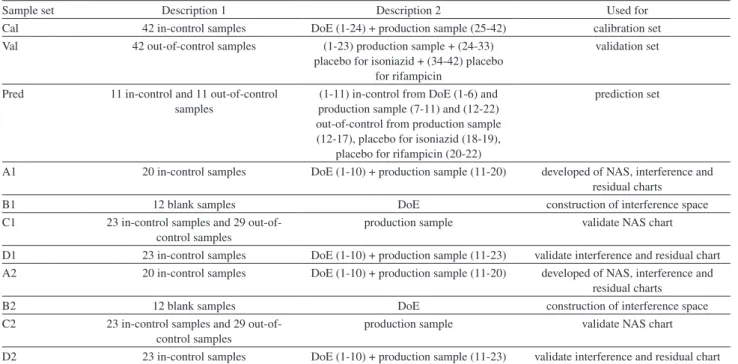
Table 1 is an overview of the samples that were used to construct and validate the control charts based on PCA and NAS. The criterion used to select the number of principal components used for the construction of the interference space was the root mean standard error of cross validation (RMSECV).
Software
The data import, pre-treatment, and construction of multivariate control charts were implemented in MATLAB version 6.5 (Math-Works, Natick, USA) using a method developed in-house. Different preprocessing methods were used, including baseline correction, multiplicative
Table 1. Overview of the samples used for construction of control charts (PCA and NAS)
Sample set Description 1 Description 2 Used for
Cal 42 in-control samples DoE (1-24) + production sample (25-42) calibration set Val 42 out-of-control samples (1-23) production sample + (24-33)
placebo for isoniazid + (34-42) placebo for rifampicin
validation set
Pred 11 in-control and 11 out-of-control samples
(1-11) in-control from DoE (1-6) and production sample (7-11) and (12-22) out-of-control from production sample (12-17), placebo for isoniazid (18-19),
placebo for rifampicin (20-22)
prediction set
A1 20 in-control samples DoE (1-10) + production sample (11-20) developed of NAS, interference and residual charts
B1 12 blank samples DoE construction of interference space
C1 23 in-control samples and 29 out-of-control samples
production sample validate NAS chart
D1 23 in-control samples DoE (1-10) + production sample (11-23) validate interference and residual chart A2 20 in-control samples DoE (1-10) + production sample (11-20) developed of NAS, interference and
residual charts
B2 12 blank samples DoE construction of interference space
C2 23 in-control samples and 29 out-of-control samples
production sample validate NAS chart
scattering correction (MSC), variance scaling, derivative, smoothing Savitzky-Golay methods using a first- and second-order polynomial and varying the number of window points (3, 5, 7 and 11).
Results and Discussion
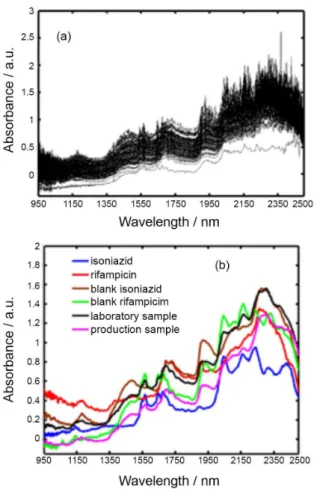
The raw NIR spectra (data set 1, 82 samples) obtained from the experimental design (30 samples) and line production (52 samples) are shown in Figure 1a, and they are the averages of triplicate measurements for each sample recorded in the region from 950 to 2500 nm. The spectra are highly overlapping and noisy, and visual inspection does not permit the identification of the active ingredients and excipients or the ability to distinguish similar features between them (“in-control” or “out-of-control”). Figure 1b shows the NIR spectra for the API (isoniazid and rifampicin), placebo (isoniazid and rifampicin), laboratory sample and production sample. As observed, the spectra for the placebo, two API, the production and the laboratory sample were distinct, which was largely a result of the spectral contribution of the API.
Multivariate Shewhart based on the PCA scores
In Figure 1, the raw spectra that are affected by noise, overlapping and additive/multiplicative effects that are common in solid measurements are readily observed. Therefore, for the development of the control chart based on PCA, a series of preprocessing methods were applied to reduce instrumental noise and light scattering that can affect the interpretation of the signal, such as Savitzky-Golay smoothing, MSC, variance scaling, and first and second derivative. The performance of developed models for each preprocessing method was evaluated according to their correct classifications (predicted sample index equal to the correct sample index) and incorrect classifications (predicted sample index different from the correct class index) using a calibration and validation set. The best prediction rates were obtained using Savitzky-Golay smoothing (11 points) combined with MSC and variance scaling (see Figure 2a), given that the samples were classified correctly in the control chart. The derivative preprocessing methods were tested, but some samples were not classified correctly in the control charts.
Figure 1. (a) Raw NIR spectra of the original 82 samples (30, DoE and 52, production); (b) raw NIR spectra for the active principle ingredient (API, isoniazid and rifampicin), placebo for each API and laboratory and production sample powder sample.
Afterward, the PCA model was set up to investigate the unique patterns and the correlation structure among the variables. The model analyzed six principal components that globally explain 53.27% of the variation (R2). The
first component accounts for 25.89% of the explained variation; the second and third components explain 11.49% and 5.59% of the variation, respectively. Although the first two PC explained the major variance, the best classification control charts were achieved using PC3. As observed in Figure 2, the loading plot of PC3, some significant bonds related to both compounds (isoniazid and rifampicin) were identified.
Some characteristic absorption peaks were observed, and they were interpreted as follows: 1100-1170 nm region is assigned to C–H and C=C for the second overtone of rifampicin; 1200-1400 nm is assigned to –CH3 for the combination of rifampicin; 1500-1700 nm is assigned to C=C and O–H for the first overtone of rifampicin and to N–H, C–O for the first overtone of isoniazid; 1750-1900 nm is assigned to −CH3 for the first overtone of rifampicin and isoniazid; and 1950-2300 nm is assigned to C–O, N–H, C=C, O–H and C–H for combination vibrations of rifampicin and isoniazid.
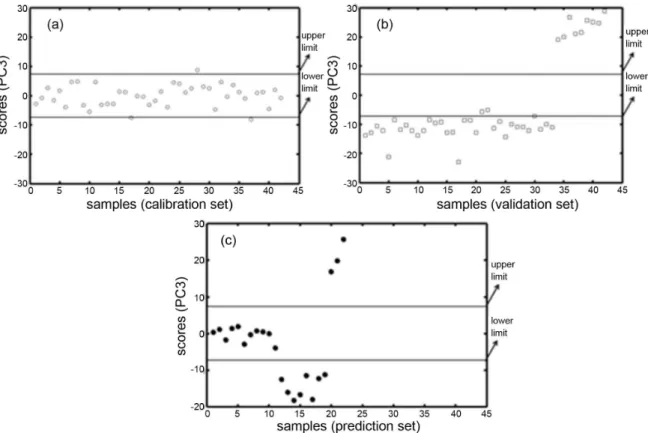
Figure 3a represents the Shewart chart of PC3 using 42 “in-control” samples and 24 DoE/18 production samples (cal1 set). The confidence limits take into account a variation
of ± 5% of the concentration of each active principle in the trade pharmaceutical formulation. This chart clearly indicates that the samples are correctly classified as “in-control,” which is in agreement with what was projected because these samples were prepared and produced in the laboratory with concentrations within the normal operating range. However, some samples were misclassified. Samples 17, 28 and 37 (cal1 set) were misclassified as “out-of-control.” Upon further analysis, these samples were not homogeneous, and some different particle sizes are present among the constituents. However, the particle size of the material affects the scattering, which was most likely a source of variation in the NIR spectra for these samples. However, as expected, 39 samples were correctly classified within the confidence limit from the calibration set with a success rate of 92.8% (39 of 42 samples).
After the construction of the calibration control chart, validation was performed with 42 different “out-of-control” samples: 23 production/10 blanks for isoniazid/9 blanks for rifampicin (val1 set). Figure 3b shows the results obtained with the validation set. The confidence limits also take into account a ± 5% variation of the concentration of each active principle in the trade pharmaceutical formulation. In Figure 3b, it is evident that the samples were correctly classified as “out-of-control,” which is in agreement with what was expected. Only three samples
(21, 22 and 30) from the produced line were misclassified. Investigating these samples, it was observed that they are also not homogeneous, which could affect the NIR spectra. However, as expected, 39 samples were correctly classified within the confidence limit from the calibration set, which had a success rate of 92.8% (39 of 42 samples) that was similar to the calibration set.
Finally, to evaluate the multivariate control chart based on PCA, a prediction set (pred1 set) including 22 samples was prepared comprised of 11 “in-control” samples (6 DoE/5 production) and 11 “out-of-control” samples (6 production/2 blanks for isoniazid/3 blanks for rifampicin). The control chart for the prediction set is shown in Figure 3c. As observed, all samples were correctly classified taking into account a variation of ± 5% of the concentration of each active principle in the trade pharmaceutical formulation. Thus, it was possible to identify the samples that were “in” and “out” of control using the multivariate control chart based on PCA, regarding the concentration of both API in the laboratory samples and the production sample formulation produced in UFRN, Brazil.
Multivariate control chart based on NAS
For the development of the control chart based on NAS, spectral preprocessing was performed using Savitzky-Golay smoothing, MSC, variance scaling, and first and second derivative. The best models (samples were classified correctly in the control chart) obtained during the pretreatment stage utilized the 900-1650 nm region from which the distribution information of isoniazid and rifampicin in excipients was extracted very well. In addition, the Savitzky-Golay smoothing (with a window of 11 points), MSC and variance scaling were chosen for the data preprocessing.
Isoniazid
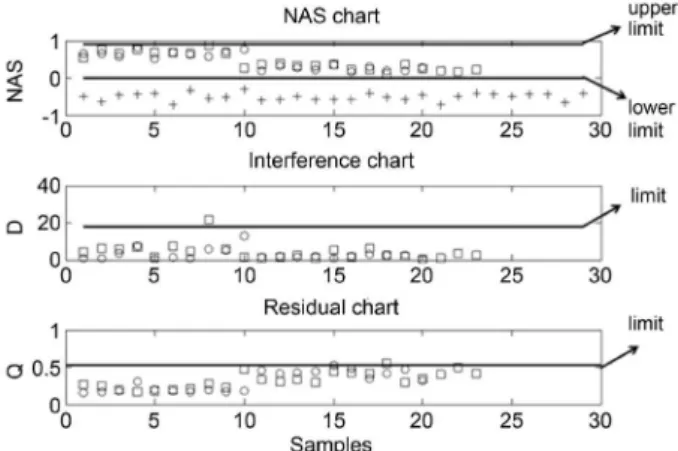
Using data set A1 (“in-control” samples) obtained from the DoE and the production sample for isoniazid, the NAS regression vector was obtained and the decomposition of each spectrum was determined. Using the NAS chart, the upper and lower confidence limits of isoniazid concentration in the samples (data set A1) were determined by taking into account a variation of ± 5% of the concentration of the API. Then, PCA using 4 components [PC1 (96.80%), PC2 (0.64%), PC3 (0.51%) and PC4 (0.37%)] was applied to the B1 set (12 blank samples for isoniazid) for the construction of the interference space and the confidence limit. The confidence limit for the interference chart was obtained according to d-statistics, resulting in a value of 17.71.
Q-statistics were used for the residuals chart resulting in a value of 0.53 at 95% confidence. The validation chart for isoniazid was developed after the construction of the three charts (NAS, interference and residual) using 52 samples (called set C1) obtained from the production samples (23 “in-control” and 29 “out-of-control”) to validate the NAS chart and 23 “in-control” samples (named set D1) to validate interferences and the residuals chart. Figure 4 shows the control charts developed for isoniazid. It can be observed that the samples are correctly classified, which agrees with what was expected. Furthermore, Figure 4 also shows that samples from data set C1 (29 “out-of-control” samples) are outside the NAS charts, which is in agreement with what was expected, given that these samples were obtained in the production phase. The data from set D1 (23 “in-control” samples) are within the interference and residuals charts, which is also in agreement with what was expected. Considering the interference chart, as observed in Figure 4, only one sample is “out-of-control.” Further analysis of this sample indicates that sample 8 has a higher cellulose concentration. Only sample 18 is “out-of-control” in the residuals chart. One can considerer the hypothesis that the samples are not adequately homogeneous and that the laboratory and production samples have diverse particle sizes.
Rifampicin
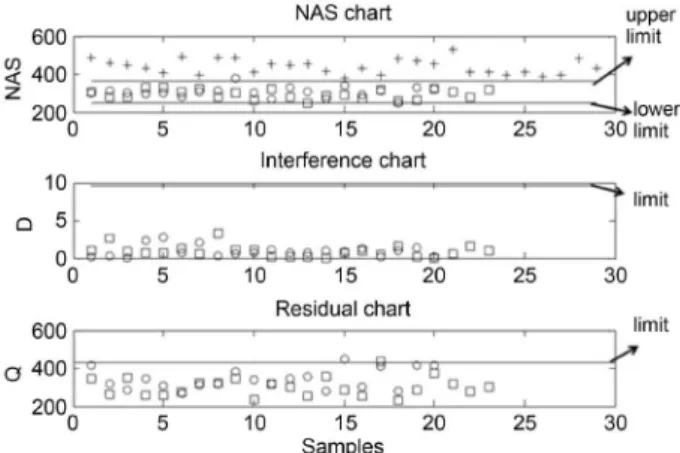
Using data set A2 (“in-control” samples) obtained from DoE, for rifampicin, the NAS regression vector was obtained and the decomposition of each spectrum was determined. Using the NAS chart, the upper and lower confidence limits of rifampicin concentration in the samples (data set A2) include a variation of ± 5% of the concentration of the API. PCA using 2 components [PC1 (89.75%) and PC2 (9.04%)] was applied to set B2
(12 blank samples for isoniazid) for the construction of the interference space and the confidence limit. A confidence limit of 9.62 for the interference chart was obtained according to d-statistics, and Q-statistics were used for the residuals chart, resulting in a value of 432.8, considering a 95% confidence level. The validation chart for rifampicin was constructed after the construction of the three charts (NAS, interference and residual), using 52 samples (named set C2) obtained from the production samples (23 “in-control” and 29 “out-of-control”) to validate the NAS chart and 23 “in-control” samples (called set D2) to validate interferences and the residuals chart. Figure 5 shows the control charts developed for rifampicin. As shown in Figure 5, the samples are correctly classified, which is in agreement with what was expected. Furthermore, it is possible to note in Figure 5 that samples from data set C2 (29 “out-of-control” samples) are outside the NAS charts, which is in agreement with what was expected, given that these samples were obtained in the production phase. The data in set D2 (23 “in-control” samples) are within the interference and residuals charts, which is also in agreement with what was expected. Considering the interference chart, all 23 of the “in-control” samples are in agreement with what was expected. With respect to the residuals chart, as observed in Figure 5, samples 15 and 17 are “out-of-control.” These samples were prepared in the production and could have different particle sizes between the laboratory and production samples, which would consequently affect the scattering in the NIR spectra.
Conclusion
This paper presents an application of multivariate control charts based on PCA and NAS using near infrared spectra to simultaneously monitor two API (isoniazid and rifampicin) in a pharmaceutical formulation produced at UFRN for the
treatment of pulmonary tuberculosis. For control charts based on PCA, three control charts were developed (calibration, validation and prediction data set), and the confidence limit was calculated. For NAS, three control charts were developed for each contribution (NAS, interferences and residual), and their individual control limits were calculated. Both multivariate control charts were validated, and it was possible to successfully identify samples that were in- and out-of-control. For the studied cases, the methodology provides a simple, rapid, non-destructive and powerful tool for monitoring the production of isoniazid and rifampicin because it does not require production samples; in fact, only laboratory samples that are obtained by combining the ingredients in appropriate amounts and samples that are under control are required for model development.
Acknowledgments
F. S. L. Costa would like to acknowledge the financial support from the PPGQ/UFRN/CAPES for a fellowship. K. M. G. Lima acknowledges the CNPq/CAPES project (Grant 070/2012) and FAPERN (Grant 005/2012) for financial support. The authors thank NUPLAM-UFRN for supporting this work.
References
1. Blanco, M.; Romero, M. A.; Analyst2001, 126, 2212. 2. Duong, N.-H.; Arratia, P.; Muzzio, F.; Lange, A.; Timmermans, J.;
Reynolds, S.; Drug Dev. Ind. Pharm.2003, 29, 679.
3. Rantanen, J.; Antikainen, O.; Mannermaa, J. P.; Yliruusi, J.;
Pharm. Dev. Technol.2000, 5, 209.
4. Otsuka, M.; Powder Technol.2004, 141, 244.
5. Blanco, M.; Alcalá, M.; Anal. Chim. Acta2006, 557, 353. 6. Neves, A. C. O.; Soares, G. M.; de Morais, S. C.; da Costa,
F. S. L.; Porto, D. L.; de Lima, K. M. G.; J. Pharm. Biomed. Anal.2012, 57, 115.
7. Li, W.; Worosila, G. D.; Wang, W.; Mascaro, T.; J. Pharm. Sci.
2005, 94, 2800.
8. Trafford, A. D.; Jee, R. D.; Moffat, A. C.; Graham, P.; Analyst
1999, 124, 163.
9. Roggo, Y.; Chalus, P.; Maurer, L.; Lema-Martinez, C.; Edmond, A.; Jent, N.; J. Pharm. Biomed. Anal.2007, 44, 683. 10. Guidance for Industry Guidance for Industry PAT-A Framework for Innovative Pharmaceutical; 2004 available at http://www. fda.gov/downloads/Drugs/Guidances/ucm070305.pdf accessed in September 2014.
11. Coates, J. P. In Process Analytical Technology; Bakeev, K. A., ed.; 2nd ed.; Blackwell Publishing Ltd: Oxford, 2010, ch. 6.
12. Matero, S.; Berg, V.; Poutiainen, S.; Rantanen, J.; Pajander, J.;
J. Pharm. Sci.2013, 102, 1385.
13. Macgregor, J. F.; Kourtl, T.; Control Eng. Pract.1995, 3, 403. 14. Clavaud, M.; Roggo, Y.; Von Daeniken, R.; Liebler, A.;
Schwabe, J.-O.; Talanta2013, 111, 28.
15. Blanco, M.; Bautista, M.; Gonza, J. M.; J. Pharm. Sci.2010,
99, 336.
16. Kourti, T.; Lee, J.; Macgregor, J. F.; Comput. Chem. Eng.1996,
20, 745.
17. Kourti, T.; Nomikos, P.; MacGregor, J. F.; J. Process Control
1995, 5, 277.
18. Zou, C.; Tsung, F.; Wang, Z.; Technometrics2007, 49, 395. 19. Bodnar, O.; Schmid, W.; J. Stat. Plan. Inference2011, 141,
2055.
20. Rocha, W. F. D. C.; Rosa, A. L.; Martins, J. A.; Poppi, R. J.; J. Mol. Struct.2010, 982, 73.
21. Rocha, W. F. D. C.; Poppi, R. J.; Microchem. J.2010, 96, 21.
22. Skibsted, E. T. S.; Boelens, H. F. M.; Westerhuis, J. A.; Witte, D. T.; Smilde, A. K.; J. Pharm. Biomed. Anal.2006, 41, 26. 23. Wise, B. M.; Ricker, N. L.; Veltkamp, D. F.; Kowalski, B. R.;
Process Control Qual.1990, 1, 41.
24. Mastrangelo, C. M.; Montgomery, D. C.; Qual. Reliab. Eng. Int.1995, 11, 79.
25. Montgomery, D. C.; Introduction to Statistical Quality Control, 5th ed.; Wiley: New York, 2005.
26. Ferrer, A.; Qual. Eng.2007, 19, 311.
27. Skibsted, E. T. S.; Boelens, H. F. M.; Westerhuis, J. A.; Smilde, A. K.; Broad, N. W.; Rees, D. R.; Witte, D. T.; Anal. Chem.
2005, 77, 7103.