online | memorias.ioc.fiocruz.br Wastewater treatment plants (WWTPs) generate
large amounts of residual sludge as part of the sewage treatment process. This sludge contains a series of con-centrated contaminants, mainly heavy metals and patho-genic microorganisms, such as bacteria, viruses, proto-zoa and helminths (Monpoeho et al. 2004, Guzmán et al. 2007, Viau & Peccia 2009, Wong et al. 2010).
Enteric viruses, which cause several diseases, in-cluding hepatitis and gastroenteritis, can be detected at high concentrations in sludge and represent a potential health risk due to disposal and reuse practices (Sidhu & Toze 2009). In Brazil, approximately 40% of the sewage sludge generated in WWTPs is disposed of in landfills, 15% is discharged in rivers, 8% is disposed of in waste-lands, 2% is incinerated, 0.1% in discharged in the ocean and 15% is reused (IBGE 2008).
Sewage sludge may have beneficial uses because it contains nutrients and organic matter and may be used as soil fertiliser or for soil improvement (Godfree & Farrell 2005). However, under certain conditions, these practices could lead to the contamination of surface wa-ter, groundwawa-ter, soil and the food chain.
Several stabilisation treatments are used to reduce the organic matter and pathogens in sludge, otherwise known as biosolids. Mesophilic anaerobic digestion (MAD),
aerobic digestion, composting, air drying and lime stabi-lisation are among the most commonly used treatments. Virus resistance to different stabilisation treatments is variable (Godfree & Farrell 2005), e.g., enteric viruses have been found in treated sewage sludge (Monpoeho et al. 2004, Viau & Peccia 2009, Wong et al. 2010).
Most concentration methods used to detect viruses in sewage sludge involve an elution and concentration step. Beef extract, an eluent recognised by the US EPA (2003), has been reported to concentrate inhibitors in the final eluent, thereby affecting polymerase chain reaction (PCR) efficiency (Sano et al. 2003, Rock et al. 2010).
Some concerns that need to be addressed include the standardisation of simplified concentration methods and establishment of detection limits to ensure a reliable health risk analysis (Girones et al. 2010). In addition, in-formation on detecting the presence and concentration of rotaviruses and norovirus (NoV) in biosolids (Sidhu & Toze 2009) is limited; therefore, this study aimed to evaluate the different concentration methods for recov-ering adenoviruses (AdV), rotaviruses A (RVA), NoV genogroup II (NoV GII) and hepatitis A viruses (HAV) from digested mesophilic sludge samples by using a real-time PCR assay for virus detection. To avoid false nega-tive results, bacteriophage PP7 was used as an internal control (IC) for the multiplex quantitative PCR (qPCR) assays (Rajal et al. 2007, Fumian et al. 2010). Digested mesophilic sludge samples obtained from a conventional activated sludge process were evaluated for the presence and concentration of AdV, RVA, NoV GII and HAV. Dif-ferent virus concentration methods were used and detec-tion was conducted by qPCR assay. This paper discusses the efficacy of these concentration methods.
Financial support: CNPq/PAPESV (403530/2008-3), IOC-FIOCRUZ + Corresponding author: [email protected]
Received 1 June 2012 Accepted 8 August 2012
The efficiency of concentration methods
used to detect enteric viruses in anaerobically digested sludge
Tatiana Prado1/+, Wilma de Carvalho Pereira Bonet Guilayn2, Ana Maria Coimbra Gaspar3, Marize Pereira Miagostovich1
1Laboratório de Virologia Comparada e Ambiental 3Laboratório de Desenvolvimento Tecnológico em Virologia, Instituto Oswaldo Cruz-Fiocruz, Rio de Janeiro, RJ, Brasil 2Departamento de Saneamento e Saúde Ambiental,
Escola Nacional de Saúde Pública-Fiocruz, Rio de Janeiro, RJ, Brasil
The presence of enteric viruses in biosolids can be underestimated due to the inefficient methods (mainly molecu-lar methods) used to recover the viruses from these matrices. Therefore, the goal of this study was to evaluate the different methods used to recover adenoviruses (AdV), rotavirus species A (RVA), norovirus genogroup II (NoV GII) and the hepatitis A virus (HAV) from biosolid samples at a large urban wastewater treatment plant in Brazil after they had been treated by mesophilic anaerobic digestion. Quantitative polymerase chain reaction (PCR) was used for spiking experiments to compare the detection limits of feasible methods, such as beef extract elution and ultra-centrifugation. Tests were performed to detect the inhibition levels and the bacteriophage PP7 was used as an inter-nal control. The results showed that the inhibitors affected the efficiency of the PCR reaction and that beef extract elution is a suitable method for detecting enteric viruses, mainly AdV from biosolid samples. All of the viral groups were detected in the biosolid samples: AdV (90%), RVA, NoV GII (45%) and HAV (18%), indicating the viruses’ resis-tance to the anaerobic treatment process. This is the first study in Brazil to detect the presence of RVA, AdV, NoV GII and HAV in anaerobically digested sludge, highlighting the importance of adequate waste management.
MATERIALS AND METHODS
Biosolid samples - Digested mesophilic sludge samples (biosolids) were obtained from a large urban WWTP lo-cated in Rio de Janeiro (RJ), Brazil. The WWTP receives
urban sewage with a mean inflow rate of 1.600 L s-1. The
WWTP utilises an aerobic process (conventional activat-ed sludge), MAD and dewatering in its treatment process. From February-July 2011, 11 biosolid samples were col-lected after MAD. Samples were colcol-lected monthly (with 15 days intervals, approximately), except in March, when four biosolid samples were provided by the Wastewater Sanitation Company (CEDAE). These biosolids are the final product of the treatment process. Samples were col-lected in sterile plastic bags, kept at 4ºC and transported to the laboratory for immediate analysis.
Viruses and the IC - RVA G1P[8] (GenBank acces-sion GU831596) and NoV GII/4 strain (GenBank ac-cession DQ997040), both of which were isolated from a positive faecal suspension (10%) and identified during acute gastroenteritis outbreaks in Brazil, were used in the spiked experiments. The AdV serotype 5, which was propagated in cell culture (Hep-2) and the HAV strain (HAF-203), which was propagated in Rhesus kidney cell cultures (FRhK-4), were used in all of the experi-ments (Villar et al. 2006). A PP7 bacteriophage (ATCC 15692-B2) was kindly provided by Dr Verónica Rajal (Salta University, Argentina) and included as an IC. Its
replication was performed by culture in Pseudomonas
aeruginosa (ATCC 15692) using a previously described protocol (Rajal et al. 2007).
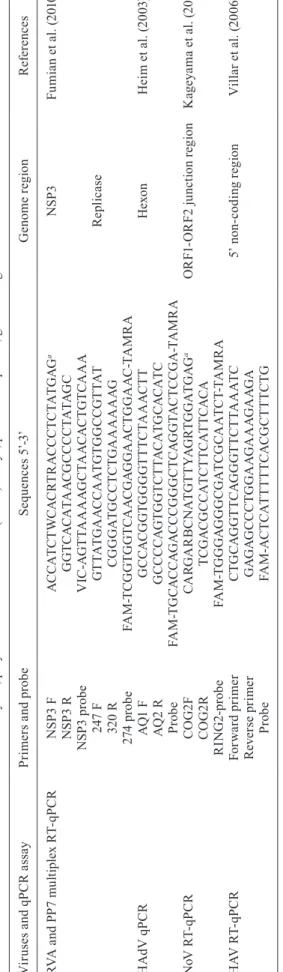
Virus stock solutions were quantified according to real-time PCR protocols (Table I) to determine the viral concentrations used to spike the biosolid samples.
Virus concentration methods - Viruses were con-centrated using two different techniques. Method 1, de-scribed by Pina et al. (1998), consists of an ultracentrifu-gation-based method, with minor modifications. Briefly, 5 g [dry matter (d.m.)] of biosolid were suspended in 15 mL of 0.25 N glycine buffer (pH 9.5) and incubated on ice for 30 min. The solution was neutralised by adding 10 mL of 2 x phosphate-buffered saline (PBS) (pH 7.2).
The mixture was centrifuged (12,000 g for 15 min, 4ºC)
and the supernatant was ultracentrifuged (Beckman ul-tracentrifuge, equipped with a type 35 rotor) at 100,000
g for 1 h at 4ºC. The pellet was resuspended in 1.0 mL
of 1 x PBS, pH 7.2.
Method 2, described by Guzmán et al. (2007), con-sists of a simplified method similar to that used by the US EPA (2003). Briefly, 10% beef extract solution (LP029B, Oxoid Ltd Basingstoke, Hants, England), pH 7.2 at 1:10 (v/v) or (w/v) was added to 5 g (d.m.) of sewage sludge. The sample was magnetically stirred (500 rpm) for 20 min at room temperature. Afterwards, the sample was
centrifuged at 4000 g for 30 min at 4ºC. The supernatant
was recovered and filtered through low protein binding membrane filters (Millipore, 0.22 µm pore size) to de-contaminate it.
All of the concentrated samples were stored at -70ºC until molecular biology analysis was performed.
Spike experiments and inhibition tests - The biosolid samples were autoclaved at 121ºC for 30 min for decon-tamination. Viruses were spiked in 5 g [d.m. - deter-mined according to US EPA (2003)] of biosolid sample and the virus titres (final concentrations) seeded into the samples were determined by a qPCR assay. The viral
titres spiked in each method were as follows (GC mL-1):
Method 1: 1.1 x 10⁹ (AdV), 3.2 x 10⁶ (RVA), 1.4 x 10⁴
(NoV), 2 x 10⁵ (HAV) and 4.2 x 10⁷ (PP7); Method 2: 2.7
x 107 (AdV), 3.8 x 10⁶ [± standard deviation (SD) 2.8 x
105] (RVA), 3.4 x 10⁴ (± SD 2.3 x 10⁴) (NoV), 9 x 10⁵ (±
SD 1 x 10⁶) (HAV) and 4.2 x 10⁷ (PP7).
Viruses were adsorbed onto sludge flocs by
adjust-ing the pH to 3.5 ±0.1 with HCl (1 N), as described by
Sano et al. (2003), and magnetically stirring the samples for 30 min. The biosolid samples were then centrifuged
(10,000 g, 15 min, 4ºC) and the supernatant (1 mL) and
pellet generated in each experiment were analysed with a qPCR assay to determine the virus recovery yield. Pro-cedures were performed in triplicate and repeated on dif-ferent dates. In all of the experiments, negative controls were also included (unseeded decontaminated biosolid samples). Extracted nucleic acids were diluted in RNA/ DNAse free water using tenfold serial dilutions (1:10 and 1:100) to verify inhibitors of the PCR reactions. PP7, which was used as an IC for the biosolid samples, was spiked with high concentrations of viral particles (ranging
from 107-109). The initial viral titres used in the spiked
ex-periments were diluted to test the limits of virus detection when using the concentration methods and qPCR assays.
Viral genomic extraction and the reverse transcrip-tion (RT) reactranscrip-tion - Nucleic acids were extracted from 140 µL of the eluate to obtain a final volume of 60 µL using the QIAamp Viral RNA kit (Qiagen, Inc, Valencia, CA) according to the manufacturer’s instructions.
cDNA synthesis was conducted by RT using a
ran-dom primer (PdN6, 50A260 units, Amersham Biosciences,
Chalfont St Giles, Buckinghamshire, UK) for RV, NoV GII, HAV and PP7. Two microlitres of dimethyl sul-phoxide (Sigma, St. Louis, MO) and 10 µL of RNA were mixed briefly, heated at 97ºC for 7 min and chilled for 4 min. The components of the mixture and their final con-centrations for the 50-µL RT reaction were as follows: 2.5 mM of each deoxynucleoside triphosphate (GIBCO BRL, Life Technologies, Inc, Grand Island, NY), 1.5 mM
MgCl2, 200 U of Superscript III reverse transcriptase
(In-vitrogen) and 1 µL of PdN6. The RT reaction mixture was
incubated in a thermal cycler (PTC-100 Programmable Thermal Controller, MJ Research, Inc, Watertown, MA) at 25ºC for 5 min, 50ºC for 60 min and 70ºC for 20 min.
qPCR - The sequence of primers and probes, region of amplification on the genome and references to qPCR protocols for virus quantification can be found in Table I.
To avoid false-positive results, quality control mea-sures such as the use of separate rooms and the inclusion of negative controls in each set of amplifications were adopted. Inhibition tests were performed by diluting nucleic acids (10-fold serial dilutions: 1:10 and 1:100) in all of the analysed samples.
A standard curve (107-101 copies per reaction) was
generated for all of the viruses using 10-fold serial di-lutions of pCR2.1 vectors (Invitrogen, USA) containing the target region. The qPCR reaction was performed in a final volume of 25 µL by using 12.5 µL of the Universal PCR Master Mix (Applied Biosystems, CA, USA) and 5 µL of the DNA/cDNA under the following incubation conditions: 50ºC for 2 min to activate UNG, 95ºC for 10 min for initial denaturation, 40-45 cycles at 95ºC for 15 s and then 50-60ºC for 1 min, depending on virus type. Amplification data were collected and analysed
using Applied Biosystems 7500 Software® version 2.0
(Applied Biosystems, Foster City, CA). All of the reac-tions were performed in duplicate. A positive result was considered when the sample signals crossed the thresh-old line, presenting a characteristic sigmoid curve. The number of viral particles was determined by adjusting the values according to the volumes used for each step of the procedure (extraction, cDNA synthesis and qPCR reaction). The amount of genome copies (GC) detected using each methodology was reported in g (d.m.) of con-centrated sample.
The total number of viral particles spiked in the samples (per mL) vs. the total number of viral particles recovered (per g dry matter) was considered to estimate the virus recovery efficiency (%).
RESULTS
Virus recovery efficiency - Three different virus con-centration methods were tested to evaluate the recovery efficiencies for each type of virus. PP7 bacteriophage was used as an IC in all of the experiments. The mean
values (GC mL-1) of the viruses detected in the
super-natant of the spiked experiments (i.e., viruses not ad-sorbed onto sludge flocs) are shown in Table II. All of the viruses analysed were adsorbed onto sludge flocs in percentages higher than 99% (Table II). Negative results were obtained for all of the viruses analysed in the nega-tive control samples.
Higher mean viral loads (VLs) (GC g-1 d.m.) from
each method performed, including the inhibition tests, are shown in Fig. 1. In general, higher mean VLs were recovered when the nucleic acids were diluted at least once (1:10), except for the RVA in Method 1 (Fig. 1).
PP7 was recovered from all of the analysed samples and the mean VLs detected by Methods 1 and 2 were
as follows: 5.2 x 10⁶ GC g-1 ± SD 1.1 x 10⁶ and 2.8 x 10⁶
GC g-1 ± SD 2.3 x 10⁶, respectively. When the nucleic
acids were diluted 1:100 in Method 2, a higher mean
recovery rate was obtained for PP7: 1.3 x 10⁷ ± SD 1.1
x 107 GC g-1 (Fig. 2).
The mean maximum value (GC g-1) obtained from
The detection limits of the qPCR assays were tested for Methods 1 and 2. HAV showed the worst results in
both methods, with detection limits higher than 103 GC
mL-1. For NoV, the detection limits were 1.4 x 10² GC
mL-1 and 4.8 x 10² GC mL-1 for Methods 1 and 2,
re-spectively. The detection limits for AdV were 1.1 x 10³
GC mL-1 and 1.5 x 10² GC mL-1 for Methods 1 and 2,
respectively. Finally, for RVA the detection limit was 3 x
101 GC mL-1 for both methods.
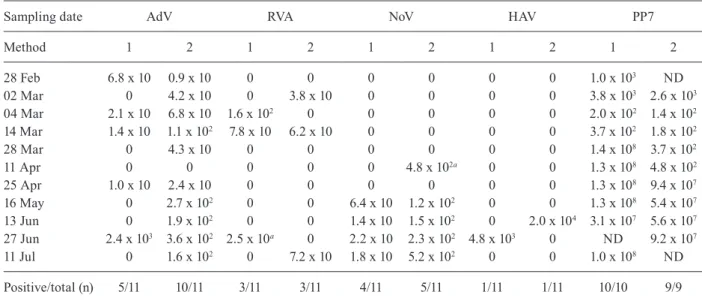
Natural occurrence of enteric viruses - Table III shows the VL for AdV, RVA, NoV and HAV from 11 bio-solid samples collected from an activated sludge process. Elution with beef extract (Method 2) showed a better re-covery for AdV, which was detected in 90% of the analy-sed samples. The second most detected viruses were RVA and NoV (45%) (Table III). RVA was detected at
higher concentrations by the ultracentrifugation method (Table III) and NoV GII was only detected in May, June and July, when higher concentrations of the virus were obtained by the beef extract method (Table III). HAV was only detected in two samples at relatively high concentra-tions (Table III). PP7 was detected in all of the spiked field samples, with lower concentrations obtained from samples collected in February and March (Table III).
Samples with negative results were submitted to a second round of experiments based on the dilution of the nucleic acids (1:10 and 1:100). The 1:10 dilution enabled detection of NoV in one sample that had been negative when tested with Method 1 (sampling date: April 11th) (Table III). This dilution also enabled detection of RVA in a sample that had been negative when tested with Method 2 (sampling date: June 27th) (Table III). How-ever, all of the samples were still negative for HAV when this dilution was made (1:10). Negative results were ob-tained for all of the viruses analysed at a 1:100 dilution.
pH measurements showed a mean result of 6.7 (± SD 0.5) in the biosolid samples; however, samples collected in February had a lower pH value, at 5.5.
TABLE II
Percentage of viruses adsorbed on sludge flocs
Viruses
Viruses spiked onto sludge samples
(GC mL-1)
meana/SD
Viruses in supernatant (GC mL-1)
meana/SD
Viruses adsorbed on sludge flocs (%)
AdV 4 x 10⁸/5.9 x 108 6.7 x 10³/5.4 x 103 99.99
RVA 3.5 x 10⁶/2.8 x 105 8.5 x 10²/8.5 x 102 99.97
NoV 3.6 x 10⁴/1.9 x 104 2.5 x 10/1.5 x 10 99.93
HAV 2.7 x 10⁵/6.3 x 104 2.6 x 10²/4.5 x 102 99.90
PP7 4.2 x 10⁷/0 4.2 x 10⁵/4.0 x 105 99.0
a: methods were performed in triplicate; AdV: adenoviruses; GC: genome copies; HAV: hepatitis A virus; NoV GII: norovirus genogroup II; RVA: rotavirus species; SD: standard deviation.
Fig. 1: mean numbers in log10 units of viruses recovered [genome
copies (GC) g-1] from biosolid samples. Methods were performed in
triplicate. Ten-fold serial dilution of nucleic acids are shown in paren-thesis (1:10 and 1:100) on the x axis. Viral titres spiked are described in Materials and Methods. AdV: adenoviruses; bars: minimum and maximum value; HAV: hepatitis A virus; Method 1: ultracentrifuga-tion; Method 2: beef extract; NoV GII: norovirus genogroup II; RVA: rotavirus species A; square in black: mean value.
DISCUSSION
Viruses are charged particles that can be highly con-centrated in biosolids due to aggregation and adhesion to sludge solids (Sidhu & Toze 2009). Several methods have been tested for detecting viruses in sewage sludge samples (Monpoeho et al. 2004, Belguith et al. 2006, Guzmán et al. 2007); however, few comparisons be-tween the different viruses have been made regarding recovery yields of the different viral groups, specifically HAV and other enteric viruses (Sidhu & Toze 2009). In some cases, the negative results can be attributed to the inefficiency of the methods used.
The methods chosen for this study have been rec-ommended by the Resolution of the National Council of the Environment (CONAMA 2006), which provides guidelines for monitoring enteric viruses in biosolids. These guidelines recommend protocols that use beef extract or those based on ultracentrifugation for virus concentration. PCR is also recommended for the de-tection of some viral groups, including RV and HAV (CONAMA 2006).
The primers and probes used in TaqMan qPCR as-says target more conservative regions of the virus ge-nome and have been considered suitable for detecting enteric viruses in several environmental matrices (Villar et al. 2006, Fumian et al. 2010, 2011, Prado et al. 2011a, Simmons & Xagoraraki 2011). However, there is some difficulty in amplifying targeted nucleic acids in biosol-id samples due to the presence of a variety of inhibitors, such as humic and fulvic acids, fats, proteins, organic and inorganic compounds, including polyphenols and heavy metals that form complexes with nucleic acids and inhibit amplification enzymes (Sano et al. 2003, Sidhu & Toze 2009, Rock et al. 2010).
The results obtained in this study indicate that dif-ferent virus recovery rates are the result of the difdif-ferent virus concentration methods used. The mean recovery rates of the beef extract method were 6.2% and 6.3% for AdV and NoV, respectively, and are similar to the results obtained by Sano et al. (2003), who detected a 7% recovery rate for poliovirus from sewage sludge by RT-PCR.
Ultracentrifugation was considered the best alterna-tive method for detecting RVA and HAV in the spiked experiments, but not suitable for naturally contaminated biosolid samples. It is possible that in the spiked experi-ments, the original organic matter was compromised due to autoclaving, contributing to an elevated recovery ef-ficiency rate for the concentration methods.
However, the mean recovery rate of AdV was very low when using glycine buffer followed by ultracentrifu-gation. Rock et al. (2010) has reported that beef extract and glycine buffer can concentrate different inhibitor compounds responsible for causing different results when using a qPCR assay. Nevertheless, it is difficult to determine which compound affected the qPCR effi-ciency because ultracentrifugation was used as the final step to concentrate the viruses. The pellet that is gener-ated may contain viruses and other substances, such as suspended solids of the final eluate.
AdV had a higher level of adsorption in this particu-late matter because the virus size affects the interaction mechanisms with the colloidal particles of the environ-mental matrices (Dowd et al. 1998). Moreover, the pres-ence of suspended solids in the final eluate can affect the results of the nucleic acid extraction. A higher volume of glycine may be more suitable for detecting viruses by ultracentrifugation.
TABLE III
Results of viral genome loads g-1 (dry matter) detected in anaerobically digested sludge samples using two concentration methods
Sampling date AdV RVA NoV HAV PP7
Method 1 2 1 2 1 2 1 2 1 2
28 Feb 6.8 x 10 0.9 x 10 0 0 0 0 0 0 1.0 x 10³ ND
02 Mar 0 4.2 x 10 0 3.8 x 10 0 0 0 0 3.8 x 10³ 2.6 x 10³
04 Mar 2.1 x 10 6.8 x 10 1.6 x 10² 0 0 0 0 0 2.0 x 10² 1.4 x 10²
14 Mar 1.4 x 10 1.1 x 10² 7.8 x 10 6.2 x 10 0 0 0 0 3.7 x 10² 1.8 x 10²
28 Mar 0 4.3 x 10 0 0 0 0 0 0 1.4 x 10⁸ 3.7 x 10²
11 Apr 0 0 0 0 0 4.8 x 10²a 0 0 1.3 x 10⁸ 4.8 x 10²
25 Apr 1.0 x 10 2.4 x 10 0 0 0 0 0 0 1.3 x 10⁸ 9.4 x 10⁷
16 May 0 2.7 x 10² 0 0 6.4 x 10 1.2 x 10² 0 0 1.3 x 10⁸ 5.4 x 10⁷
13 Jun 0 1.9 x 10² 0 0 1.4 x 10 1.5 x 10² 0 2.0 x 10⁴ 3.1 x 10⁷ 5.6 x 10⁷
27 Jun 2.4 x 10³ 3.6 x 10² 2.5 x 10a 0 2.2 x 10 2.3 x 10² 4.8 x 10³ 0 ND 9.2 x 10⁷
11 Jul 0 1.6 x 10² 0 7.2 x 10 1.8 x 10 5.2 x 10² 0 0 1.0 x 10⁸ ND
Positive/total (n) 5/11 10/11 3/11 3/11 4/11 5/11 1/11 1/11 10/10 9/9
Several strategies can be adopted to minimise or predict the interference of environmental inhibitors in PCR reactions (Viau & Peccia 2009, Rock et al. 2010), but the dilution of nucleic acids appears to be the sim-plest of these strategies, specifically by avoiding the ad-dition of other reagents. Nevertheless, in contrast to the results obtained from the spiked experiments, nucleic acids from the field samples diluted at 1:100 showed negative results, which indicates that the VL of these samples may have been diluted below the detectable limits of the assays.
The use of an IC (PP7 Bacteriophage) to monitor the stages of detection provides an interesting solution for avoiding false negative results. When high concentrations of PP7 were seeded in the field samples, the VLs recovered were low in some samples. The negative results obtained for some of the enteric viruses in these samples may be attributed to variable compositions of the biosolids.
Experiments using anaerobically digested sludge samples detected at least one virus in each of the analy-sed samples. Comparatively, AdV was the most detected virus, demonstrating its widespread dissemination in treated sewage sludge. These results support the hypoth-esis that AdV could be a good indicator for evaluating the presence of enteric viruses in sewage sludge samples (Bofill-Mas et al. 2006, Schlindwein et al. 2010, Wong et al. 2010). While Bofill-Mas et al. (2006) reported similar concentrations for AdV, other investigations have found higher AdV genome loads in sewage sludge treated by
MAD, with concentrations varying from 104-106 GC g-1
(d.m.) (Viau & Peccia 2009, Wong et al. 2010).
RVA can be detected at higher levels (≥ 45%) in biosolid samples; recent studies have shown a large dissemination of RVA (≥ 90%) in wastewaters from RJ (Fumian et al. 2011, Prado et al. 2011a). However, researchers hypothesise that RV is poorly adsorbed in solid fractions of sludge (Arraj et al. 2005, Sidhu & Toze 2009), possibly explaining the lower frequency of detection and VLs when compared with the amount of AdV found in these samples.
Interestingly, NoV GII was predominantly detected in the colder months, suggesting a higher burden and circu-lation of these viruses during this period and corroborat-ing previous results concerncorroborat-ing the peak occurrences of NoV in Brazilian sewage samples (Victoria et al. 2010).
HAV was poorly recovered from the sewage sludge samples, corroborating data from other studies (Schlind-wein et al. 2010, Wong et al. 2010, Simmons & Xago-raraki 2011). The lower frequency of HAV detection in biosolids can be expected because improvements in sanitary and socioeconomic conditions may be prevent-ing the circulation of these viruses in the community and consequently, in wastewaters, as recently verified in studies conducted in RJ (Prado et al. 2011b). However, another explanation is related to the low detection limits of the methods used to detect HAV in biosolids, as dem-onstrated in this study and by other authors (Jebri et al. 2012). Therefore, the detection of HAV in biosolids can be underestimated, primarily when low VLs are circu-lating in these environments.
Although viral infectivity is not determined by meth-ods based on nucleic acid amplification, studies have confirmed that a great proportion of viral genomes de-tected by molecular methods correspond with viable in-fectious particles detected in sewage sludge or biosolids (Schlindwein et al. 2010, Wong et al. 2010, Simmons & Xagoraraki 2011). Moreover, the aggregation of viruses onto sludge flocs could prevent viral inactivation (Sidhu & Toze 2009).
The concentration method using beef extract elution followed by qPCR assay seems suitable for detecting AdV in biosolids. However, other concentration meth-ods should be investigated for the detection of other vi-ruses, especially HAV, to avoid inaccuracies related to potential contamination and quantification of viruses in biosolids, ensuring a reliable public health risk analysis.
ACKNOWLEDGEMENTS
To Dr Marise Dutra Asensi and Dr Liliane Myiuki (Labo-ratory of Bacteriology, IOC/Fiocruz), for supporting bacterio-phage PP7 replication, and to the WWTP staff, for supplying the sewage sludge samples under the agreement between Fi-ocruz and CEDAE.
REFERENCES
Arraj A, Bohatier J, Laveran H, Traore O 2005. Comparison of bacte-riophage and enteric virus removal in pilot scale activated sludge plants. J Appl Microbiol 98: 516-524.
Belguith K, Hassen A, Aouni M 2006. Comparative study of four ex-traction methods for enterovirus recovery from wastewater and sewage sludge. Bioresour Technol 97: 414-419.
Bofill-Mas S, Albinana-Gimenez N, Clemente-Casares P, Hundesa A, Rodriguez-Manzano J, Allard A, Calvo M, Girones R 2006. Quantification and stability of human adenoviruses and polyo-mavirus JCPyV in wastewater matrices. Appl Environ Microbiol 72: 7894-7896.
CONAMA - Conselho Nacional do Meio Ambiente 2006. Guidelines and procedures for use of sewage sludge in agriculture soil. Avail-able from: mma.gov.br/port/conama/res/res06/res37506.pdf.
Dowd SE, Pillai SD, Wang S, Corapcioglu MY 1998. Delineating the specific influence of virus isoelectric point and size on virus ad-sorption and transport through sandy soils. Appl Environ
Micro-biol 62: 405-410.
Fumian TM, Leite JPG, Castello AA, Gaggero A, Caillou MSL, Mi-agostovich MP 2010. Detection of rotavirus A in sewage samples using multiplex qPCR and an evaluation of the ultracentrifuga-tion and adsorpultracentrifuga-tion-eluultracentrifuga-tion methods for virus concentraultracentrifuga-tion.
J Virol Methods 170: 42-46.
Fumian TM, Leite JPG, Rose TL, Prado T, Miagostovich MP 2011. One year environmental surveillance of rotavirus specie A (RVA) genotypes in circulation after the introduction of the Rotarix vac-cine in Rio de Janeiro, Brazil. Water Res45: 5755-5763.
Girones R, Ferrús MA, Alonso JL, Rodriguez-Manzano J, Calgua B, Corrêa AB, Hundesa A, Carratala A, Bofill-Mas S 2010. Molecu-lar detection of pathogens in water - The pros and cons of molecu-lar techniques. Water Res 44: 4325-4339.
Godfree A, Farrell J 2005. Processes for managing pathogens. J
En-viron Qual 34: 105-113.
Heim A, Ebnet C, Harste G, Pring-Akerblom P 2003. Rapid and quan-titative detection of human adenovirus DNA by real-time PCR.
J Med Virol 70: 228-239.
IBGE - Instituto Brasileiro de Geografia e Estatística 2008. Pesquisa Nacional de Saneamento Básico. Available from: ibge.gov.br/home/ estatistica/populacao/condicaodevida/pnsb2008/default.shtm.
Jebri S, Jofre J, Barkallah I, Saidi M, Hmaied F 2012. Presence and fate of coliphages and enteric viruses in three wastewater treat-ment plants effluents and activated sludge from Tunisia. Environ
Sci Pollut ResInt19: 2195-2201.
Kageyama T, Kojima S, Shinohara M, Uchida K, Fukushi F, Hoshino FB, Takeda N, Katayama K 2003. Broadly reactive and highly sen-sitive assay for Norwalk-like viruses based on real-time quantita-tive reverse transcription-PCR. J Clin Microbiol 41: 1548-1557.
Monpoeho S, Maul A, Bonnin C, Patria L, Ranarijaona S, Billaudel S, Ferré V 2004. Clearance of human-pathogenic viruses from sludge: study of four stabilization processes by real-time reverse transcription-PCR and cell culture. Appl Environ Microbiol 70: 5434-5440.
Pina S, Jofre J, Emerson SU, Purcell RH, Girones R 1998. Charac-terization of a strain of infectious hepatitis E virus isolated from sewage in an area where hepatitis E is not endemic. Appl Environ
Microbiol 64: 4485-4488.
Prado T, Silva DM, Guilayn WC, Rose TL, Gaspar AMC, Miagos-tovich MP 2011a. Quantification and molecular characterization of enteric viruses detected in effluents from two hospital waste-water treatment plants. Water Res 45: 1287-1297.
Prado T, Fumian TM, Miagostovich MP, Gaspar AMC 2011b. Moni-toring the hepatitis A virus in urban wastewater from Rio de Ja-neiro, Brazil. Trans R Soc Trop Med Hyg 106: 104-109.
Rajal VB, McSwain BS, Thompson DE, Leutenegger CM, Kildare BJ, Wuertz S 2007. Validation of hollow fiber ultrafiltration and real-time PCR using bacteriophage PP7 as surrogate for the quantifi-cation of viruses from water samples. Water Res 41: 1411-1422.
Rock C, Alum A, Abbaszadegan M 2010. PCR inhibitor levels in con-centrates of biosolid samples predicted by a new method based on excitation-emission matrix spectroscopy. Appl Environ
Mi-crobiol76: 8102-8109.
Sano D, Fukushi K, Yoshida Y, Omura T 2003. Detection of enteric viruses in municipal sewage sludge by a combination of the enzy-matic virus elution method and RT-PCR. Water Res 37: 3490-3498.
Schlindwein AD, Rigotto C, Simões CMO, Barardi CRM 2010. De-tection of enteric viruses in sewage sludge and treated wastewa-ter effluent. Water Sci Technol 61: 537-544.
Sidhu JPS, Toze SG 2009. Human pathogens and their indicators in biosolids: a literature review. Environ Int 35: 187-201.
Simmons FJ, Xagoraraki I 2011. Release of infectious human enteric vi-ruses by full-scale wastewater utilities. Water Res 45: 3590-3598.
US EPA - Environmental Protection Agency of the United States 2003. Control of pathogens and vector attraction in sewage sludge. Un-der 40 CFR Part 503, Appendix H - Method for the recovery and assay of total culturable viruses from sludge. (EPA/625/R-92/013). Available from: epa.gov/nrmrl/pubs/625r92013/625R92013.pdf.
Viau E, Peccia J 2009. Survey of wastewater indicators and human pathogen genomes in biosolids produced by class A and class B stabilization treatments. Appl Environ Microbiol 75: 164-174.
Victoria M, Guimarães FR, Fumian TM, Ferreira FFM, Vieira CB, Shubo T, Leite JPG, Miagostovich MP 2010. One year monitor-ing of norovirus in a sewage treatment plant in Rio de Janeiro, Brazil. J Water Health 8: 158-165.
Villar LM, de Paula VS, Diniz-Mendes L, Lampe E, Gaspar AMC 2006. Evaluation of methods used to concentrate and detect hepa-titis A virus in water samples. J Virol Methods 137: 169-176.
Wong K, Onan BM, Xagoraraki I 2010. Quantification of enteric vi-ruses, pathogen indicators and Salmonella bacteria in class B an-aerobically digested biosolids by culture and molecular methods.