Working Paper Series
Return Migration, Self-Selection and Entrepreneurship
in Mozambique
Cátia Batista
Nova School of Business and Economics
Tara McIndoe-Calden
Central Bank of Ireland
Pedro C. Vicente
Nova School of Business and Economics
ISSN 2183-0843
NOVAFRICA Working Paper Series
NOVAFRICA | Nova School of Business and Economics|Faculdade de Economia | Universidade Nova de Lisboa Any opinions expressed here are those of the author(s) and not those of NOVAFRICA.
Research published in this series may include views on policy, but the center itself
takes no institutional policy positions.
NOVAFRICA is a knowledge center created by the Nova School of Business and
Economics of the Nova University of Lisbon. Its mission is to produce distinctive
expertise on business and economic development in Africa. A particular focus is on
Portuguese-speaking Africa, i.e., Angola, Cape Verde, Guinea-Bissau, Mozambique,
and Sao Tome and Principe. The Center aims to produce knowledge and disseminate
it through research projects, publications, policy advice, seminars, conferences and
other events.
NOVAFRICA Working Papers often represent preliminary work and are circulated to
encourage discussion. Citation of such a paper should account for its provisional
Return Migration, Self-Selection and Entrepreneurship
in Mozambique
*Catia Batista†, Tara McIndoe-Calder‡, and Pedro C. Vicente§ May 2014
Abstract
Does return migration affect entrepreneurship? This question has important implications for the
debate on the economic development effects of migration for origin countries. The existing
literature has, however, not addressed how the estimation of the impact of return migration on
entrepreneurship is affected by double unobservable migrant self-selection, both at the initial outward migration and at the final inward return migration stages. This paper uses a
representative household survey conducted in Mozambique in order to address this research
question. We exploit variation provided by displacement caused by civil war in Mozambique,
as well as social unrest and other shocks in migrant destination countries. The results lend
support to negative unobservable self-selection at both and each of the initial and return stages
of migration, which results in an under-estimation of the effects of return migration on
entrepreneurial outcomes when using a ‘naïve’ estimator not controlling for self-selection.
Indeed, ‘naïve’ estimates point to a 13 pp increase in the probability of owning a business when there is a return migrant in the household relative to non-migrants only, whereas
excluding the double effect of unobservable self-selection, this effect becomes significantly
larger - between 24 pp and 29 pp, depending on the method of estimation and source of
variation used.
JEL Codes: F22; L26; O15.
Keywords: international migration; return migration; entrepreneurship; self-selection; business ownership; migration effects in origin countries; household survey; Mozambique; sub-Saharan Africa.
*
Corresponding Author: Catia Batista, Nova School of Business and Economics, Faculdade de Economia, Universidade Nova de Lisboa, Campus de Campolide, 1099-032 Lisboa, Portugal. We thank Randy Akee, Ron Davies, Elaine Liu, David McKenzie, Cormac O’Grada, Monica Parra, Matloob Piracha, Panu Poutvaara, Jackie Wahba, Karl Whelan, and other participants in seminars and conferences at the MIT NEUDC Meetings; NORFACE/CReAM Conference on International Migration; Oxford CSAE Conference; Mexico City World Bank/IZA Conference on Employment and Development; Nova University of Lisbon, Trinity College Dublin and University College Dublin for useful comments. We wish to acknowledge financial support from the DfID - Department for International Development (UK), in the context of the International Growth Centre, from the Department of Economics and IIIS at Trinity College Dublin, and from Nova Forum at Nova University of Lisbon.
†
Nova School of Business and Economics - Universidade Nova de Lisboa, CReAM, IZA and NOVAFRICA. Email: [email protected].
‡
Central Bank of Ireland. Email: [email protected] .
§
1.
Introduction
International emigration has been traditionally regarded as detrimental to the origin countries of migrants. Most concerns relate to the type of ‘brain drain’ issues originally proposed by Gruber and Scott (1966) and Bhagwati and Hamada (1974), and refer to the loss of the most educated nationals of a country, which causes the disappearance of a critical mass in production, research, public services (notably health and education) and political institutions. This negative effect would be compounded by the presence of positive production externalities or complementarities between human capital and other factors of production. In addition, fiscal losses would occur in the form of foregone tax revenue when educated nationals leave the country.
The effects of international migration on the economic development of migrant sender countries have, however, lately attracted renewed and considerable interest. In fact, recent studies have emphasized that emigration seems to have a positive impact on the educational attainment of both migrants and non-migrants, as well as on the demand for improved political institutions and on community engagement in the home country, as well as on international trade and FDI between the origin and destination countries of migrants.1
It can be argued that an additional channel through which migration may directly benefit home countries is through the return of migrants, who can bring new productive skills (such as education or managerial capacity) acquired abroad, as well as financial resources provided by past remittances and accumulated savings.
1
While there are currently no systematic data on worldwide return migration, recent literature has focused on the international movements of students - the growing ‘brain circulation’ phenomenon.2 UNESCO (2011) numbers show that the stock of foreign tertiary students in countries for which data are available was greater than 3 million in 2009, which doubles the corresponding number in 1999. Rosenzweig (2007) moreover argues that the proportion of foreign students who remain in the United States as permanent immigrants is only around 20% for the average sending country, which leaves a large room for ‘brain circulation’, i.e. the return of educated migrants to their origin country. In a different line of research, Gibson and McKenzie (2014) study New Zealand’s Recognized Seasonal Employer program, a temporary migration program that targets mainly unskilled workers. They accordingly find that migrants who return home tend to acquire human capital while abroad.
Despite the recent intensified interest regarding both the development impact of international migration for migrant countries of origin, and the temporary nature of some international migratory movements, there has only been limited research on the entrepreneurial effects of return migration – a literature discussed towards the end of this section.Most importantly, the existing literature evaluating the entrepreneurial impact of return migration has not taken into account the role of migrant self-selection, both at the initial migration and at the return migration stages, which this paper shows to be a serious impediment to a causal estimation of this impact.3
2
Rosenzweig (2007) and Nyarko (2011) focus on the magnitude and effects of “brain circulation” from Asia and Ghana, respectively.
3
In this paper we propose to examine the question of whether return migrants contribute to entrepreneurship in the origin country. For this purpose, we conducted a representative household survey in four provinces of Mozambique during September and October 2009, when 1766 respondents were interviewed for this purpose. The retrospective nature of our dataset, as well as the characteristics of the Mozambican context that has migrants departing to different locations subject to a variety of exogenous shocks, allows us to address the issue of unobservable self-selection of return migrants both at the (outward) initial migration and at the (inward) final return migration stages, unlike previous literature. The data we collected and use in this analysis also facilitates an examination of predominantly south-south migration flows (between Mozambique and neighboring sub-Saharan African countries), which have been mostly ignored due to data unavailability in the past economics migration literature.
‘Naïve’ estimates of the entrepreneurial impact of return migration that do not take self-selection into account indicate that having a return migrant in the household contributes to increasing the probability of business ownership by nearly 13 percentage points (pp). However, because we are focusing on entrepreneurial outcomes, our estimates are likely to be affected by unobservable self-selection of individuals, at both the initial migration and at the final return migration stages: potentially, migrants and return migrants will differ substantially from non-migrants in terms of unobservable characteristics such as ability or entrepreneurial motivation, for instance, which should be correlated with entrepreneurial outcomes. Our results indeed highlight that the ‘naïve’ estimation results hide substantial unobservable self-selection bias. When we exclude the effect of migrant unobservable self-selection, both at the outward initial migration and at the inward
return stages, the impact of return migration on the probability of owning a business is estimated to be significantly larger: between 24 pp and 29 pp, depending on the method of estimation and source of variation that is used.
Note that, in order to identify migrant self-selection at the various stages, we use different sources of variation, such as displacement caused by wars and other violent events, and macroeconomic shocks affecting differently origin and destination countries. Using these different sources of variation and also various estimation methods, namely next-neighbor matching and instrumental variable estimation, we obtain evidence of negative unobservable self-selection at both and each of the initial and return migration stages. Clearly, there seems to be an overall positive entrepreneurial effect of return migration, particularly after accounting for outward and inward unobservable self-selection.
address the fact that there are multiple stages of self-selection in the decisions of a return migrant that may complicate causal estimation of the effects of return migration on entrepreneurship – this is exactly the focus and novelty of our paper, which discusses unobservable self-selection at both the initial migration and the return stages, while controlling for this problem using different sources of variation and estimation methods. Finally, Yang (2008) explores exogenous variation in Filipino migrant income caused by the 1997 Asian financial crisis to find a positive impact of migrant income on investment and entrepreneurial activities in the home country. He however recognizes that this positive impact may be mediated by a number of channels, namely remittances, migrant savings or return migration. In this paper, we attempt to isolate the impact of return migration. In addition, further to controlling for self-selection in the decision to return, we also attempt to control for self-selection in the initial decision to migrate.
The remainder of the paper is organized as follows. In the next section, we begin by presenting a brief overview of Mozambique. We then proceed, in section 3, by describing the household survey we conducted and use in our empirical work, including a discussion of descriptive statistics. In section 4, we present the econometric model and identification strategy adopted in our empirical analysis. Section 5 discusses the main empirical findings, including a variety of robustness checks. Finally, section 6 summarizes our findings and presents policy implications.
2.
Mozambique: Country Context
Mozambique, a country with 22.4 million inhabitants, is one of the poorest countries in the world with a GDP per capita of 838 USD in 2008. 4 Indeed, it ranks
4
161 in 189 countries (latest available years) in terms of GDP per capita.5 Without important natural resources until recently, and with 81% of the population directly dependent on agriculture,6 it has been an aid-dependent country for many years, with official aid assistance accounting for 22% of GNI in 2008.7
Politically, Mozambique became independent from Portugal in 1975, after an independence war that started in 1964 and officially ended in 1974. FRELIMO (Frente de Libertação de Moçambique), the independence movement, then started a single-party, socialist regime supported by the former Soviet Union and its allies. Starting in 1977, Mozambique suffered a devastating civil war fought between FRELIMO and RENAMO (Resistência Nacional Moçambicana). RENAMO was supported by Apartheid South Africa and, in the context of the Cold War, by the United States. The civil war ended in 1992 with an agreement to hold multi-party elections. FRELIMO has won all presidential elections since then.
Migratory movements from Mozambique were traditionally labor-driven mainly from the southern Mozambican provinces to South African mines and commercial farms. More recently, emigration from Mozambique has frequently been related to political instability. At independence, in 1975, most Portuguese citizens residing in Mozambique until this time returned to Portugal. During the subsequent civil war, mainly in the 1980s, large refugee movements were generated into neighboring countries. After 1992, peace in Mozambique attracted back over 1.7 million of its refugees and former combatant emigrants. More recently, in May and June 2008, xenophobic attacks in South Africa, against some of the poorest foreign immigrants (mostly Mozambican and Zimbabwean) resulted in the deaths of more than 60 people and prompted further substantial return
5
World Development Indicators, 2009.
6
CIA World Factbook, 2010.
7
migrant movements. Official reports point to 40,000 people fleeing back to Mozambique immediately after the onset of the violence.8
3.
Data description
3.1.Household survey
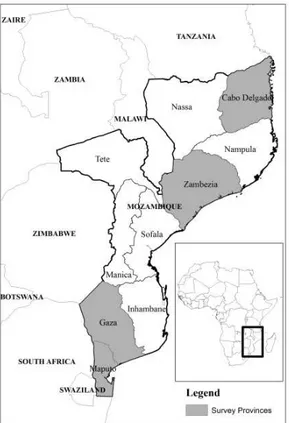
This study is based on a representative household survey including modules on business ownership and international migration. The survey was conducted in four provinces of Mozambique (Cabo Delgado, Zambezia, Gaza, and Maputo-Province) from September 2009 to October 2009 by the CSAE at the University of Oxford.9
The locations covered in the survey, 161 in total, were selected following a standard two-stage clustered representative sampling procedure - first on provinces, then on enumeration areas. The sampling framework was the 2004 electoral map of the country using as weights the number of registered voters per polling location (usually schools) as provided by the CNE/STAE (2004) in their 2004 elections (disaggregated) electoral data electronic publication.10 This sampling procedure implies that all registered voters in the universe under consideration had the same probability of being sampled. The survey is based on a sample of 1763 resident households (including both non-migrants and return migrants), and also provides information on a large sample of current emigrants. Sampling in each enumeration area followed standard household representativeness (nth house calls). However, only household heads or their spouses, one per household, were interviewed. Interviews were also conditional on ‘having access to a cell phone’ for receiving or sending calls and text messages. This included cases in which there was no
8
Red Cross of Mozambique (2009).
9
Figure A1 in Appendix illustrates the geographical coverage of the household survey.
10
ownership of cell phones in the household, but easy access to a neighbor or family member allowing cell phone usage.11
3.2.Descriptive statistics
The dataset highlights the importance of international migration in Mozambique. Table 1 shows that 33% of all households in the sample have at least one member who is currently or has been an international migrant - while 23% of all sampled families has at least on return migrant living in the family home. Table 1 also shows that, in terms of business ownership, 28% of families in our sample report owning a business - 14% of which businesses are owned by return migrants.
[Table 1 about here.]
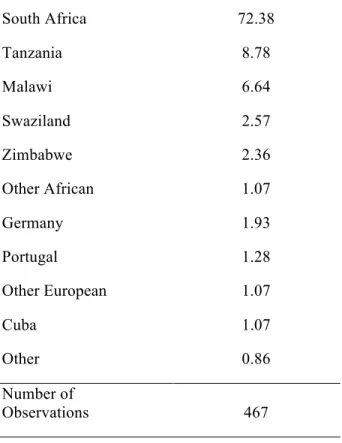
Table 2 indicates that an overwhelming fraction of return migrants (72%) travelled to South Africa from Mozambique. There are, however, significant numbers of return migrants that departed to Tanzania (9%) and Malawi (7%). Most other migrant destinations are in Africa, while only less than 5% of Mozambican migrants head to Europe (mostly Germany and Portugal). This geographic pattern of migration implies that this paper will essentially examine south-south migration flows.
[Table 2 about here.]
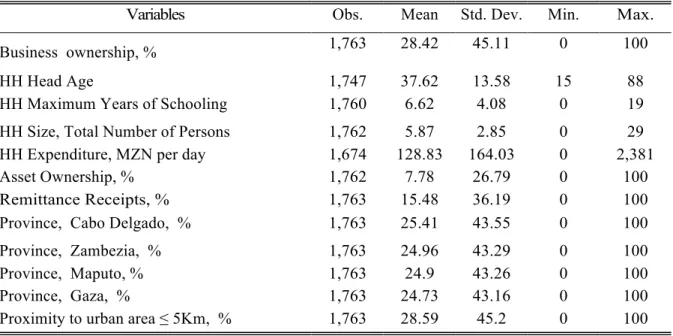
Table 3 shows the summary statistics for all the variables used in the regression analysis that follows and not yet described in Tables 1 and 2. We find that the surveyed households are predominantly rural (only 29% are within 5km of a town), have relatively young household heads with low levels of education (close
11
to 6 years of schooling, on average), expenditure (approximately 4 USD/day) and asset ownership. Further, around 15% of households report receiving remittances.
[Table 3 about here.]
4.
Econometric Framework and Identification Strategy
Econometric framework
Given that one cannot simultaneously observe the actual and the counterfactual entrepreneurial outcomes for each individual in our sample given their return migration status (and hence one cannot directly measure the individual
entrepreneurial gain of return migration for this individual), we need to estimate an
average entrepreneurial effect of return migration. This effect can be described as:
1 0 0 0
E 1 E 0
E 1 E 1 E 0
i i i i
i i i i i i i
E R = E R =
E E R = E R = E R =
⎡ ⎤− ⎡ ⎤=
⎣ ⎦ ⎣ ⎦
⎡ ⎤ ⎡ ⎤ ⎡ ⎤
= ⎣ − ⎦+ ⎣ ⎦− ⎣ ⎦
(1) where E
iand Ri are binary variables denoting, respectively, the entrepreneurial
outcome and return migration status of individual i; E
1i denotes the entrepreneurial
outcome for a return migrant (R
i=1); and E0i represents the entrepreneurial
outcome for a non-migrant (R i=0).
Equation (1) shows that estimating average entrepreneurial effects can be problematic. Indeed, this expression makes clear that simply comparing the average difference in entrepreneurial outcomes between return migrants and non-migrants will not identify a causal effect of return migration on entrepreneurship. Indeed, the causal effect of interest, the Average Treatment on the Treated (ATT)
effect, E E1i−E0i Ri=1 "
# $%, is shown to be masked by a Selection Bias that
An example of selection bias occurs when those who choose to emigrate are broadly more “able”, which could mean that they are more educated, motivated and driven than those who do not emigrate – all characteristics that should improve their entrepreneurial outcomes. In this instance, there is a positive selection bias, which implies that simply comparing average differences in entrepreneurial outcomes between return migrants and non-migrants exaggerates the true entrepreneurial skill gains of return migrants. Conversely, a negative selection bias (occurring if, for example, it is those individuals who lack observable qualifications, such as education, or are less hard-working that decide to leave the origin country and, afterwards, return home) will understate the true entrepreneurial skill gains of return migrants when simply comparing average differences in entrepreneurial outcomes between return migrants and non-migrants. Note that the sign of self-selection is very much an empirical question: it is a priori
equally possible to have negative self-selection or positive self-selection.
An additional issue is that the self-selection of migrants at any of the two relevant stages (initial or return migration) might occur based on observable or unobservable variables. Up to recently, the literature on migrant self-selection as started by Borjas (1987) based on Roy (1951), focused exclusively on self-selection based on observable characteristics, such as education and income. As examined by more recent migration research12, unobservable migrant self-selection often operates based on unobservable personality traits, for instance, which are very likely to be correlated with our outcome of interest, entrepreneurship.13
12
See, for instance, Coulon and Piracha (2005), Batista (2008), Akee (2010), McKenzie et al. (2010) or Bertoli et al. (2013).
13
Identification strategy
In order to devise an identification strategy for our parameter of interest, it is important to examine the nature of the selection bias occurring in our case. The thought experiment we should keep in mind can be summarized as: “What would be the estimated impact of return migration on entrepreneurial outcomes if we
could choose to send abroad and bring back individuals who were randomly
selected from the population of non-migrants?”
This question makes clear that there are two implicit selection problems in this thought experiment: first, randomly select a non-migrant and send her abroad; second, from the pool of randomly selected migrants, randomly choose some of them to return to the origin country. This thought experiment would then avoid the two types of selection issues arising with return migration: (1) (outward)
self-selection at the initial migration stage, which refers to the potentially idiosyncratic
characteristics of those who decide to leave the country; (2) (inward) self-selection
at the return migration stage, which refers to the potentially idiosyncratic
characteristics of those migrants who decide to return to the sending country.
Given the expected self-selection of individuals into migration and return migration, the identification challenge is first to find comparable return migrants and non-migrants on observable and unobservable characteristics before theinitial
migration decision is made; and second, within this restricted sample, to find
comparable return migrants and current migrants on observable and unobservable characteristics before the return migration decision is made.
wars were migrating primarily as a result of events beyond their control - they were hence likely forced to leave the country independently of their characteristics.
In the same way, we choose to use events of forced return migration in order to generate a random sample of return migrants from the existing pool of migrants. In particular, the sample of return migrants is restricted, at this stage, to those who returned from South Africa immediately after the sudden eruption of the violent xenophobic riots against immigrants described in Section 2, as well as to those who were deported due to their illegal migration status14, and also to those who return to the origin country because of illnesses or deaths in the family. All of these return motives are likely to be exogenous in the sense that they are typically unanticipated and outside the individual’s control. They should hence be uncorrelated with the individual’s entrepreneurial outcomes except through the fact that these motives prompted the return itself.
An alternative identification strategy to randomly choose return migrants from the existing pool of migrants is to use the exogenous variation provided by changes in the GDP per capita difference between destination and origin countries, as well as the distance between the migrant origin and destination areas. GDP differentials provide economic incentives to move back to the origin country as incomes change between origin and destination, whereas distance between migrant origin and destination also has predictive power for return migration decisions. Both these variables are exogenous in the sense that they are completely outside individual control and should not, therefore, be systematically correlated with migrant characteristics.
14
Estimation strategy
The simplest possible estimate of the entrepreneurial gains to return migration would be obtained from a regression of the following form:
0 1 2
i i i
E
=
α
+
α
R
+
α
ʹ′
X
+
ε
(2)
where E
i is a proxy for entrepreneurship by individual i in our sample, such as
business ownership or self-employment; R
i denotes whether individual i is a return
migrant; and X denotes a set of observable individual, household and geographical characteristics that potentially affect entrepreneurial activity.
Following the discussion of the econometric framework summarized by (1), we know that an estimate for α1will only be equal to the causal effect of interest if the selection bias disappears after conditioning on observable characteristics X, i.e. if E!"E0i X,Ri=1$#=E!"E0i X,Ri=0#$. This is, however,
unlikely to be the case, as the return migrant status,R
i, is most often correlated
with the error term εi, which may include unobservable characteristics such as motivation, ambition, work diligence or risk preferences. These unobservable characteristics can be expected to affect both the actual entrepreneurial outcomes of non-migrants and the counterfactual outcomes of return migrants had they decided not to migrate and return, hence creating an unobservable self-selection bias in this ‘naïve’ estimate.
First, we will use OLS estimation on samples restricted following the identification exercises proposed in the previous sub-section, so as to isolate selection bias effects and obtain an estimate for the causal effect of return migration on entrepreneurship.
Second, an alternative estimation method to obtain the causal effect of return migration on entrepreneurship (that can also be used to evaluate robustness of the results of running OLS on the restricted samples) will be to conduct nearest-neighbor matching (NNM) estimations.
An additional method to estimate the overall causal effect of interest, which can also be used to examine the robustness of our findings relative to inward self-selection, is to perform a two-stage least square estimation of equation (2).
The outcomes of these estimation strategies are discussed in the next section.
5.
Empirical analysis
In this section, we summarize the main empirical results in this paper. In particular, we present, interpret and discuss the robustness of our estimates of the ‘entrepreneurial gains’ of return migration.
Main empirical results
The entrepreneurial outcome we examine in the baseline results is business ownership at the household level. Table 4 displays the least squares estimates of the likelihood of business ownership for households that have at least one return migrant relative to households with no migrants.15 These estimates are obtained
15 Note that we present least squares estimates for simplicity. Running the same regressions
while controlling for: (i) characteristics of the household and household head that may affect business ownership, such as the age and gender of the household head, as well as maximum completed education and number of persons belonging to the household; (ii) household level proxies for financial resource availability that may limit the possibilities of opening and running a business, such as household expenditure and asset ownership (where we focus on the most durable and precisely measured, namely home, land and car ownership); and, finally, (iii) geographical control variables such as migration destination, urban area and province fixed effects.16
[Table 4 about here.]
Column (1) in Table 4 shows that having a return migrant in the family seems to significantly increase the probability of owning a business. Our least squares estimates point to an average increase in the probability of business creation by 12.5 pp when there is a return migrant in the household. The magnitude and statistical significance of this estimate is unaffected when we include controls for current migrants and remittances being received in the household, as shown in Column (2) of Table 4. While it could be argued that the entrepreneurial effects of current migrants and remittances could be captured to some extent by the return migrant variable, this does not seem to be the case in any of the specifications we run, where the estimated coefficient on return migration is always pretty much unaffected by the inclusion of these control variables.
As discussed in the previous section, our ‘naïve’ OLS estimate of a 12.5 pp increase in the probability of business creation when there is a return migrant in the household is likely combining the true effects of return migration on business
16
ownership with the effects of unobservable self-selection. For this reason, we next use OLS estimation on restricted samples as described in the identification strategy, with the purpose of excluding the various types of selection bias effects and obtaining an estimate for the causal effect of return migration on entrepreneurship.
We start by restricting the return migrant sample to “war migrants”, i.e. those return migrants who left Mozambique during wartime, as this migration decision is much less likely to be influenced by unobservable characteristics than the typical migration decision. This exercise should allow evaluating the effects of
unobservable outward self-selection at the initial migration stage - which can be
done by simply comparing the ‘naïve’ OLS estimates for the whole sample to the OLS estimates for this restricted sample.
Columns (3) and (4) in Table 4 present the least squares estimates of regression (2) when restricting the subsample of return migrants to those who left the country during war time. The estimated results show that there seems to be evidence of overall negative outward self-selection as the estimated impact of return migration on entrepreneurship is significantly raised when we restrict the estimation sample to war migrants compared to the estimation based on the whole sample of return migrants. These results can be understood in the context of the long history of Mozambican migration to South African mines and farms in non-war times. This history implies that strong migrant networks can lower migration costs and improve employment prospects even for those migrants with lower unobservable ability.
community), or illnesses and deaths in the family. This further sample restriction should allow us to evaluate the overall unobservable self-selection at both the
initial and return migration stages, as well as to isolate unobservable inward
self-selection at the return migration stage.
Columns (5) and (6) in Table 4 show that return migrants who left Mozambique in war times and were forced to return by an exogenous motive are 24 pp more likely to own a business than non-migrants. This implies that there is
overall strong negative unobservable self-selection when we consider both the
initial and return migration stages, as the coefficient from the ‘naïve’ OLS estimation nearly doubles relative to the restricted sample estimation.
This 24 pp estimate is our proposed empirical counterpart to the ideal counterfactual thought experiment of assessing the true entrepreneurial gains of return migration by picking a random sample of non-migrants to emigrate and then picking a random subsample of those emigrants to bring back to the origin country. This is, hence, our proposed baseline estimate for the true entrepreneurial gains from return migration excluding unobservable self-selection at both migration
stages.
Comparing this 24 pp estimate to the 14 pp estimate when restricting the sample of return migrants to those who emigrated during war times, we can evaluate the unobservable inward self-selection of return migrants applicable to a
sample of non-selected emigrants, such as war migrants. This self-selection pattern
is clearly negative, implying that it is less able war migrants that self-select to return to the origin country.
When running OLS on equation (2) using a restricted subsample that includes only those return migrants who were forced to return from the sample of all emigrants (i.e. including emigrants who left the country at war and non-war times), estimates for the entrepreneurial gains of return migration cannot be precisely estimated, as shown in Columns (7) and (8) of Table 4. We cannot therefore infer the pattern of unobservable inward self-selection for return migrants in general using our sample.
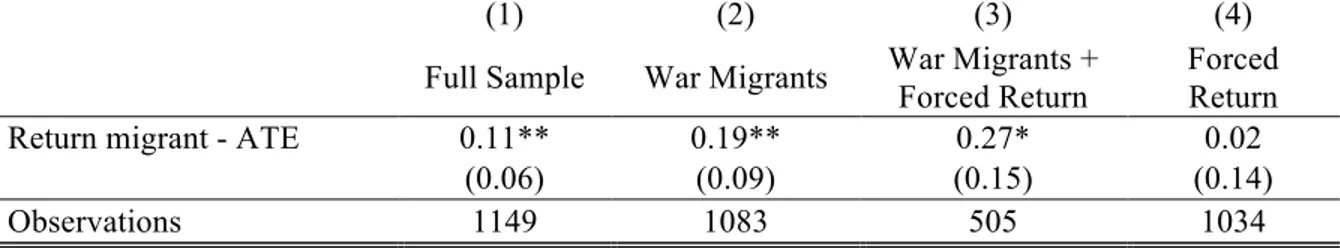
Robustness check: Nearest-Neighbor Matching Estimation
A possible concern with the estimation strategy used in our baseline results might be that the use of linear regressions (or indeed Probit regressions, which yield the same qualitative results) is too restrictive to identify the parameter of interest. To this effect, we redo our estimation of the average treatment effect (ATE) of return migration on the probability of owning a business, but now using a non-parametric matching method. The purpose of this procedure is to investigate whether results are sensitive to the linear approximation embedded in OLS. This matching approach ensures that return migrants are only compared to non-migrants who are sufficiently similar to them in terms of observables. To implement this approach, we rely on the nearest-neighbor matching (NMM) procedure proposed by Abadie and Imbens (2006).
[Table 5 about here.]
Specifically, in the unrestricted sample, Column (1) of Table 5 shows that the ‘naïve’ estimate for the increase in the probability of return migrants owning a business is 11 pp, which compares to 12.5 pp in the OLS estimation.
When restricting the sample to those return migrants who initially left the country in times of war, this coefficient is raised to 19 pp, as can be seen in Column (2) of Table 5. This point estimate is higher than the 14 pp provided by the OLS results, but similarly provides evidence supportive of negative unobservable
outward selection at the initial migration stage.
After restricting the sample to those migrants who were forced to leave due to war and forced to return due to reasons beyond their control, the estimated effect of migration on entrepreneurial outcomes becomes 27 pp, as shown in Column (3) of Table 5. This compares to the 24 pp estimate using OLS, although the NMM is a slightly less statistically significant estimate due to the reduction in sample size imposed by the common support imposed in the NMM estimation. This still underscores the importance of controlling for both types of migration self-selection, and strengthens the findings from the OLS estimated coefficients according to which overall unobservable self-selection at both stages of migration is negative, and a compound effect of both negative unobservable self-selection at
the initial and at the return migration stages.
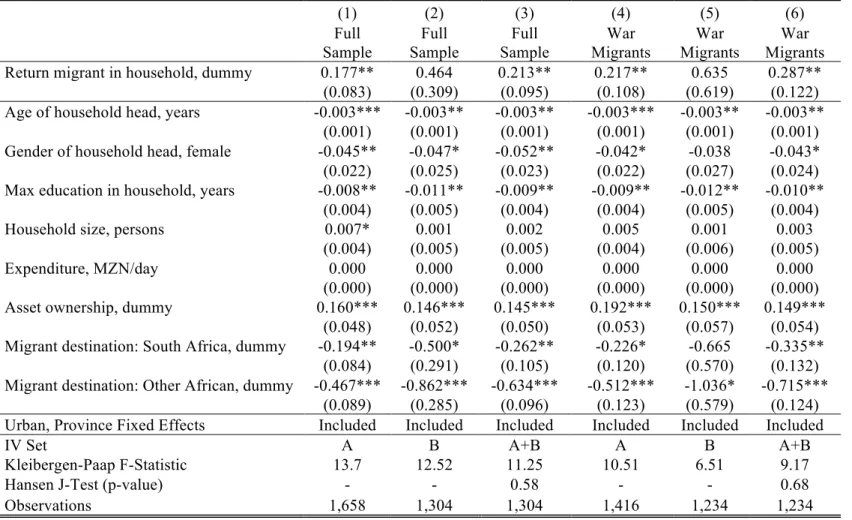
Robustness check: Instrumental Variable Estimation
An alternative way to randomly choose return migrants from the existing pool of migrants, and in this way evaluate the unobservable inward self-selection bias occurring at the return migration stage, is to use an instrumental variable (IV) estimator for the α1 parameter of interest in model (2). For this purpose, we need to
find instruments that are strongly correlated with the decision to return and uncorrelated with the decision to own a business in the home country.
We propose to use the second set of exclusion restrictions described in the identification strategy section of the paper. Namely, we construct instrumental variables that make use of the exogenous variation provided by shocks to GDP per capita in the migrant destination countries, as well as by differences in the distance between areas of residence and migrant destinations.
Variation at the individual level for the relative GDP per capita variable at migrant destination relative to the origin is achieved in the following way. The instrumental variable is computed as a weighted average, where weights are constructed in order to reflect the relative size of the Mozambican migrant population in each migrant destination – a proxy for existing migration networks at each destination.17 This migration-weighted GDP variable is matched to individual migrants in the sample in the year that they turn 30, which is the age at which individuals are most likely to start a business.18 Note that the IPUMS census information from the Minnesota Population Centre (2010) is only available for
17
These weights are computed as the number of Mozambican nationals between the ages of 25 and 34 resident at destination, as a proportion of the non-migrant resident population at the same destination. The weights are established using Mozambican and national IPUMS census data from the Minnesota Population Centre (2010).
18
migrants to South Africa, Tanzania and Portugal, which together account for 82% of the total number of return migrants in the sample.19
It seems reasonable to expect that changes in relative GDP per capita between origin and destination countries are unanticipated and outside the migrants’ control. This relative income variable should hence be uncorrelated with the migrants’ choice to own a business at origin, except through the fact that this motive prompts the return itself – as it is likely that these relative income changes provide economic incentives for return migration decisions. In the same way, it is also expectable that the distance between survey districts and migrant destinations has predictive power for return migration, but should not be directly correlated with the decision to own a business, except through the fact that it prompts the return migration decision itself.
[Table 6 about here.]
The statistics obtained in our sample and displayed in Table 6 provide evidence supportive for these IV rationales. Looking at the full sample, the destination-distance and relative GDP per capita instruments are each and both together significantly correlated with the decision to return, as required of a strong instrument and confirmed by the Kleinberg-Papp F-statistics reported in Columns (1) – (3) of Table 6. These instruments also seem uncorrelated with the decision to own a business in the origin country and indeed pass the tests of over-identifying restrictions shown in Column (3) of Table 6.
The instrumental variable estimation results obtained using both these sources of variation shown in Column (3) of Table 6 show a positive and statistically significant point estimate of 21 pp for the incremental impact of return
19
migration on business ownership. This is our preferred IV specification in that it uses both instruments and thereby attenuates any concerns regarding the local validity of each of these instruments when used separately – even though the estimation results do not vary substantially when using each set of instruments. Indeed, one observes that using only the distance IV points to a slightly lower but significant impact of return migrants – 18 pp as displayed in Column (1) of Table 6, whereas using only relative GDP increases the magnitude of this estimate, but cannot estimate it precisely on its own as is clear from Column (2) of Table 6.
In any event, it seems clear that any of these instrumental variable estimation strategies point to estimates much larger than the ‘naïve’ OLS estimates on the full sample, which is evidence supportive of negative unobservable inward
migrant self-selection at the return migration stage. This is equivalent to say that
return migrants from the existing pool of current migrants seem to be generally less entrepreneurial in terms of non-observable characteristics than randomly chosen existing migrants.
return migrant owning a business relative to a non-migrant is significantly positive and larger than the ‘naïve’ OLS estimates.
These results lend further support to negative unobservable self-selection at both and each of the initial and return stages of migration. This unobservable self-selection pattern results in an under-estimation of the effects of return migration on entrepreneurial outcomes when using the ‘naïve’ OLS estimator. Clearly, there seems to be an overall positive entrepreneurial effect of return migration, particularly after accounting for outward and inward unobservable self-selection.
6.
Concluding remarks
This paper examines broad research questions related to the entrepreneurial impact of return migration. More precisely, it evaluates the effect of sending random national residents abroad and then randomly bringing them back to the origin country, while also evaluating the benefits of bringing an average existing migrant back. For this purpose, we conducted and make use of a tailored representative household survey of Mozambique. This is a typical Southern African country in the sense that migratory flows are mostly directed at neighboring countries. We hence also indirectly ask the important question of whether Southern Africa’s growth promise may be supported by the current substantial south-south migration flows in the area.
return migration: migrants and return migrants may differ substantially from non-migrants in terms of unobservable characteristics correlated with entrepreneurial outcomes, such as ability or motivational drive, for instance.
In order to identify migrant self-selection at these various stages, we use different sources of variation, namely displacement caused by wars and other violent events, but also macroeconomic shocks at destination and physical distance between migrant origin and destination. Using these different sources of variation and also various estimation methods, we obtain evidence of negative unobservable self-selection at both and each of the initial and return migration stages.
Conducting ‘naïve’ OLS estimation shows that being a return migrant is associated with a significant increase of 13 percentage points in the probability of owning a business relative to non-migrants. However, when we exclude the effect of unobservable self-selection, both at the outward initial migration and at the inward return stages, we obtain that this effect is significantly larger and significant - between 24 pp and 29 pp, depending on the method of estimation and source of variation that are used. The fact that we use alternative, totally distinct sources of variation that yield the same qualitative results and quantitative estimates of similar magnitude is reassuring regarding the validity of our analysis.
make a stronger general argument, for this case at least, keeping the doors of richer countries open to migration may be regarded as a form of “efficient aid”.
References
Abadie, Alberto, and Guido Imbens (2006). “Large Sample Properties of Matching Estimators for Average Treatment Effects”, Econometrica, 74 (1), 235-267.
Akee, Randall (2010). “Who’s Leaving? Deciphering Immigrant Self-Selection From a Developing Country”, Economic Development and Cultural Change, 58 (2): 323-344.
Batista, Catia (2008). “Why Doesn’t Labor Flow from Poor to Rich Countries? Micro Evidence from the European Integration Experience”, Oxford Working
Paper 402.
Batista, Catia, Aitor Lacuesta, and Pedro C. Vicente (2012). “Testing the ‘Brain Gain’ Hypothesis: Micro Evidence from Cape Verde”, Journal of Development
Economics, 97 (1): 32-45.
Batista, Catia, and Janis Umblijs (2013). “Migration, Risk Attitudes, and Entrepreneurship: Evidence from a Representative Immigrant Survey”, IZA
Discussion Paper Series, No. 7781.
Batista, Catia, and Pedro C. Vicente (2011). “Do Migrants Improve Governance at Home? Evidence from a Voting Experiment”, World Bank Economic Review, 25 (1): 77-104.
Beine, Michel, Frederic Docquier, and Hillel Rapoport (2008). “Brain drain and LDCs’ growth: winners and losers”, Economic Journal, 118:631-652.
Beine, Michel, Cecily Oden-Defoort, and Frederic Docquier (2011). “A Panel Data Analysis of The Brain Gain”, World Development, 39 (4): 523-532.
Bertoli, Simone, Jesus Fernandez-Huertas Moraga, and Francesc Ortega (2013). “Crossing the Border: Self-Selection, Earnings and Individual Migration Decisions”, Journal of Development Economics, 101 (1): 75-91.
Borjas, George (1987). “Self-Selection and the Earnings of Immigrants”, American
Economic Review, 77(4): 531-53.
Borjas, George, and Bernt Bratsberg (1996). “Who Leaves? The Out-Migration of the Foreign-Born”, The Review of Economics and Statistics: 78, 165–176.
Chiquiar, Daniel, and Gary Hanson (2005). “International Migration, Self-Selection, and the Distribution of Wages: Evidence from Mexico and the United States”, Journal of Political Economy, 113(2): 239-281.
Comissão Nacional de Eleições - Secretariado Técnico de Administração Eleitoral (2004). Resultados Desagregados das Eleições Presidenciais. Maputo, Moçambique: CNE-STAE.
Coulon, Augustin, and Matloob Piracha (2005). “Self-Selection and the Performance of Return Migrants: The Source Country Perspective”, Journal of
Population Economics, 18: 779–807.
Dustmann, Christian, and Oliver Kirchkamp (2002). “Migration Duration and Activity Choice After Re-Migration”, Journal of Development Economics, 67: 351-372.
Gallego, Juan, and Mariapia Mendola (2013). “Labour Migration and Social Networks Participation in Southern Mozambique”, Economica, 80: 721-759. Gibson, John, and David McKenzie (2014). “The Development Impact of a Best Practice Seasonal Worker Policy”, Review of Economics and Statistics, Forthcoming.
Heckman, James, and Richard Robb (1985). “Alternative methods for evaluating the impact of interventions: An overview”, Journal of Econometrics, 30 (1-2): 239-267.
Imbens, Guido, and Joshua D. Angrist (1994). “Identification and Estimation of Local Average Treatment Effects”, Econometrica, 62 (2): 467-475.
Javorcik, Beata, Çaglar Özden, Mariana Spatareanu and Cristina Neagu (2011). “Migrant Networks and Foreign Direct Investment”, Journal of Development
Economics, 94 (2): 231-241.
Kugler, Maurice, and Hillel Rapoport (2007). “International Labor and Capital Flows: Complements or Substitutes?”, Economics Letters, 92 (2): 155-162.
McCormick, Barry, and Jackie Wahba (2001). “Overseas Work Experience, Savings and Entrepreneurship Amongst Return Migrants to LDCs”, The Scottish
Journal of Political Economy, 48(2): 164–178.
McKenzie, David, John Gibson and Steven Stillman (2010). “How Important Is Selection? Experimental vs. Non-Experimental Measures of the Income Gains from Migration”, Journal of the European Economic Association, 8(4): 913-945. Mesnard, Alice (2004). “Temporary migration and capital market imperfections”,
Oxford Economic Papers, 56: 242–262.
Mesnard, Alice, and Martin Ravallion (2006). “The Wealth Effect on New Business Startups in a Developing Economy”, Economica, 73: 367-392.
Minnesota Population Center (2010). IPUMS - Integrated Public Use Microdata
Series, International: Version 6.0. Minneapolis: University of Minnesota.
Nyarko, Yaw (2011). “The Returns to the Brain Drain and Brain Circulation in Sub-Saharan Africa: Some Computations Using Data from Ghana”, NBER
Working Paper 16813.
Piracha, Matloob, and Florin Vadean (2010). “Return Migration and Occupational Choice: Evidence from Albania”, World Development, 38(8): 1141–1155.
Rauch, James, and Vitor Trindade (2002). “Ethnic Chinese Networks in International Trade”, Review of Economics and Statistics, 84: 116–130.
Red Cross of Mozambique (2009). International Federation’s Disaster Relief
Emergency Fund (DREF) Final Report. Operation No. MDRMZ004.
Rosenzweig, Mark (2007). “Higher education and international migration in Asia: brain circulation”, in ABCDE World Bank Conference, ed. Francois Bourguignon. New York: Oxford University Press.
Roy, A. D. (1951). “Some Thoughts on the Distribution of Earnings”, Oxford
Economic Papers, 3:135-146.
Stock, James and Motohiro Yogo (2005). “Testing for Weak Instruments in Linear IV Regression”, in Identification and Inference for Econometric Models: Essays in
Honor of Thomas Rothenberg, ed. D. Andrews and J. Stock, 80-108. Cambridge
University Press.
UNCTAD (2010): “Information Economy Report 2009: Trends and Outlook in Turbulent Times,” Tech. rep., UNCTAD.
Wahba, Jackie, and Yves Zenou (2012). “Out of Sight, Out of Mind: Migration, Entrepreneurship and Social Capital”, Regional Science and Urban Economics, 42(5): 890–903.
World Development Indicators (2009). Washington, DC: The World Bank.
Yang, Dean (2008). “International Migration, Remittances, and Household Investment: Evidence from Philippine Migrants' Exchange Rate Shocks”, The
Tables and Figures
Table 1: Household Characteristics. All Households. Percentages.
Migratory Experience
Households with at least one migrant 32.73
Households with at least one current
migrant 15.77
Households with at least one return
migrant 23.03
Business Ownership
Households with at least one business 28.42
Households with at least one
business-owning return migrant 3.97
Source: Own survey.
Table 2: Destination Countries of Return Migrants. Most Recent Migration Journey. Percentages.
South Africa 72.38
Tanzania 8.78
Malawi 6.64
Swaziland 2.57
Zimbabwe 2.36
Other African 1.07
Germany 1.93
Portugal 1.28
Other European 1.07
Cuba 1.07
Other 0.86
Number of
Observations 467
Table 3: Summary Statistics. All Households.
Variables Obs. Mean Std. Dev. Min. Max.
Business ownership, % 1,763 28.42 45.11 0 100
HH Head Age 1,747 37.62 13.58 15 88
HH Maximum Years of Schooling 1,760 6.62 4.08 0 19
HH Size, Total Number of Persons 1,762 5.87 2.85 0 29 HH Expenditure, MZN per day 1,674 128.83 164.03 0 2,381 Asset Ownership, % 1,762 7.78 26.79 0 100 Remittance Receipts, % 1,763 15.48 36.19 0 100 Province, Cabo Delgado, % 1,763 25.41 43.55 0 100
Province, Zambezia, % 1,763 24.96 43.29 0 100 Province, Maputo, % 1,763 24.9 43.26 0 100 Province, Gaza, % 1,763 24.73 43.16 0 100 Proximity to urban area ≤ 5Km, % 1,763 28.59 45.2 0 100
Table 4: Probability of owning a business. All households. OLS estimates.
(1) (2) (3) (4) (5) (6) (7) (8)
Full Sample Full Sample War Migrants War Migrants
War Migrants + Forced Return
War Migrants +
Forced Return Forced Return Forced Return Return migrant in household, dummy 0.125*** 0.125*** 0.138** 0.141** 0.240** 0.243** 0.118 0.119 (0.047) (0.048) (0.063) (0.063) (0.099) (0.100) (0.102) (0.102) Age of household head, years -0.003*** -0.003*** -0.003*** -0.003*** -0.003*** -0.003*** -0.003*** -0.003***
(0.001) (0.001) (0.001) (0.001) (0.001) (0.001) (0.001) (0.001) Gender of household head, female -0.048** -0.046** -0.045* -0.046** -0.056** -0.058*** -0.050** -0.050**
(0.022) (0.022) (0.023) (0.022) (0.022) (0.022) (0.022) (0.022) Max education in household, years -0.008** -0.008** -0.009** -0.009** -0.008** -0.009** -0.008* -0.008* (0.004) (0.004) (0.004) (0.004) (0.004) (0.004) (0.004) (0.004) Household size, persons 0.007* 0.007* 0.006 0.005 0.006 0.005 0.007 0.007
(0.004) (0.004) (0.004) (0.005) (0.005) (0.005) (0.004) (0.005) Expenditure, MZN/day 0.000 0.000 0.000 0.000 0.000 0.000 0.000 0.000
(0.000) (0.000) (0.000) (0.000) (0.000) (0.000) (0.000) (0.000) Asset ownership, dummy 0.159*** 0.161*** 0.191*** 0.194*** 0.182*** 0.184*** 0.170*** 0.171***
(0.049) (0.049) (0.053) (0.053) (0.063) (0.063) (0.063) (0.063) Migrant destination: South Africa, dummy -0.145** -0.139** -0.151* -0.155* -0.067 -0.056 -0.009 -0.001 (0.062) (0.062) (0.089) (0.090) (0.204) (0.210) (0.143) (0.144)
Migrant destination: Other African, dummy -0.422*** -0.426*** -0.437*** -0.440*** -0.495*** -0.501*** -0.368*** -0.373*** (0.071) (0.072) (0.094) (0.094) (0.107) (0.107) (0.107) (0.107)
Current migrant in household, dummy 0.017 0.041 0.068 0.055
(0.035) (0.039) (0.044) (0.044)
Remittances received, dummy -0.056* -0.044 -0.089* -0.097**
(0.033) (0.045) (0.050) (0.049)
Urban, Province Fixed Effects Included Included Included Included Included Included Included Included
Observations 1,658 1,658 1,416 1,416 1,305 1,305 1,328 1,328
Table 5: Probability of owning a business. NMM estimates.
(1) (2) (3) (4)
Full Sample War Migrants War Migrants + Forced Return
Forced Return Return migrant - ATE 0.11** 0.19** 0.27* 0.02
(0.06) (0.09) (0.15) (0.14)
Observations 1149 1083 505 1034
Note: All regressions use a matching estimator proposed by Abadie and Imbens (2006) and
Table 6: Probability of owning a business. 2SLS estimates.
(1) (2) (3) (4) (5) (6)
Full Sample Full Sample Full Sample War Migrants War Migrants War Migrants Return migrant in household, dummy 0.177** 0.464 0.213** 0.217** 0.635 0.287** (0.083) (0.309) (0.095) (0.108) (0.619) (0.122) Age of household head, years -0.003*** -0.003** -0.003** -0.003*** -0.003** -0.003**
(0.001) (0.001) (0.001) (0.001) (0.001) (0.001) Gender of household head, female -0.045** -0.047* -0.052** -0.042* -0.038 -0.043* (0.022) (0.025) (0.023) (0.022) (0.027) (0.024) Max education in household, years -0.008** -0.011** -0.009** -0.009** -0.012** -0.010**
(0.004) (0.005) (0.004) (0.004) (0.005) (0.004) Household size, persons 0.007* 0.001 0.002 0.005 0.001 0.003
(0.004) (0.005) (0.005) (0.004) (0.006) (0.005) Expenditure, MZN/day 0.000 0.000 0.000 0.000 0.000 0.000
(0.000) (0.000) (0.000) (0.000) (0.000) (0.000) Asset ownership, dummy 0.160*** 0.146*** 0.145*** 0.192*** 0.150*** 0.149***
(0.048) (0.052) (0.050) (0.053) (0.057) (0.054) Migrant destination: South Africa, dummy -0.194** -0.500* -0.262** -0.226* -0.665 -0.335**
(0.084) (0.291) (0.105) (0.120) (0.570) (0.132) Migrant destination: Other African, dummy -0.467*** -0.862*** -0.634*** -0.512*** -1.036* -0.715***
(0.089) (0.285) (0.096) (0.123) (0.579) (0.124) Urban, Province Fixed Effects Included Included Included Included Included Included
IV Set A B A+B A B A+B
Kleibergen-Paap F-Statistic 13.7 12.52 11.25 10.51 6.51 9.17
Hansen J-Test (p-value) - - 0.58 - - 0.68
Observations 1,658 1,304 1,304 1,416 1,234 1,234 IV Set A: Distance between residence in Mozambique and migrant destination.
IV Set B: Ratio between GDP per capita in Mozambique and in migrant destinations. See text for detailed explanation on IV construction.