A Work Project, presented as part of the requirements for the Award of a Masters Degree in Management from the Faculdade de Economia da Universidade Nova de Lisboa.
MERGERS AND ACQUISITIONS IN THE BANKING SECTOR
An Empirical Review of the Impact of Merger Announcement
on Abnormal Returns
Kolehmainen, Martti Eerik Juhani - 404
A Project carried out with the supervision of: Qinglei Dai
2
ABSTRACT
This dissertation reviews and summarizes previous findings of merger announcement related abnormal returns. A sample of 183 event windows is collected and analyzed to observe cross-country differences. The results are discussed under five specific topics: location, payment method, strategic focus, size and corporate governance. The findings of this review indicate that target banks enjoy high abnormal returns both in the U.S. and in Europe. Bidding banks seem to incur negative returns on average while small value creation was observed for the merged entity. Target banks are generating higher returns in USA while bidding banks show better performance in Europe. A minor indication of decreasing U.S. bank returns is observed as the measurement period increases. Geographical and activity focus as well as use of cash as a payment method are seen to contribute to the higher abnormal returns.
Mergers and Acquisitions in the Banking Sector: An Empirical Review of the Impact of Merger Announcement on Abnormal Returns
3
1. Introduction
The objective of this work project (WP) is to conduct an extensive empirical review by
answering the following research question: “What conclusions and suggestions for research
can be made by reviewing existing findings on abnormal returns related to bank merger announcements?“. The small amount of reviews and the scattered nature of previous findings make this an interesting subject to study.
The existing literature on bank merger effects can be divided into two approaches: 1.) the
examination of efficiency gains through financial ratios or cost and profit functions1
More detailed reviews on bank merger related abnormal returns are presented in
subsections of empirical and theoretical papers. Becher (2000) collects 6 observations
without distinguishing between event windows lengths. Hagendorff, Collins and Keasey
(2007b) collect 15 observations
and
2.) the study of stock market reactions to merger announcements. This review focuses on
the latter. Previous efforts to examine bank merger related abnormal returns are vast
especially for the American market but few studies holistically review and analyze these
results. Amel et al. (2004) and Pilloff and Santomero (1997) conduct a review of merger
related efficiency effects. They provide a brief overview of abnormal returns without
categorizing results from previous studies. Rhoades (1994) summarizes previous merger
performance studies in tables but does not directly refer to numerical results of these
works.
2
from previous studies and present six observations for the
(-1/+1) window allowing initial cross-country comparisons. Beitel and Schiereck (2001)
offer the most extensive review with a table of 31 observations3
1 See e.g. Vander Vennet (1996) and Altunbas and Marques (2008) for Europe and Berger, Hancock and Humphrey (1993) and Akhavein, Berger and
Humphrey (1997) for U.S.
2 12 American/3 European
3 27 American / 2 European / 1 Norwegian /1 German-American
but their cross-country
4 Most recently Yang and Liu (2008) review 29 observations4
Location incorporates three aspects identified in previous empirical works: 1. national
differences, 2. interstate vs. intrastate differences and 3. domestic versus cross-border
differences. These are important since cross-country variations in e.g. regulations, market
structure, market characteristics and culture can effect the generation of CARs. The level
of branch overlapping can further impact the resulting cost efficiencies
from previous studies.
Regarding existing studies the small amount of comparable observations as well as
organization of the data according to the publication year instead of the event window
length and the lack of consideration for specific transaction related characteristics hinder
the discovery of patterns and differences to the full extent. Thus, the existing evidence can
be considered incomplete.
This WP will provide a holistic examination of previous findings while addressing the
identified shortcomings. First, a brief and illustrative review of the methods for measuring
abnormal returns (ARs) and cumulative abnormal returns (CARs) is presented. This is
followed by a discussion of the five determining factors of CARs: 1. location, 2. method
of payment, 3. strategy focus, 4. size and 5. corporate governance. The division of results
is important as previous empirical works address these factors and their examination
might provide valuable findings for investors and bank managers indicating what type of
mergers produce the highest returns.
5
. In this WP a
review of 183 different event windows6 is conducted. Collection of a large sample of
mergers and acquisitions is important for comparing abnormal returns across time.
However, this review does not distinguish the results between mergers and acquisitions.
Due to previous findings7
4 26 American/ 2 European / 1 Norwegian 5 See Becher and Campbell, 2005 6 Presented in Table 9 in the Appendices 7 See Krasker, 1996
5 distinguishing the results between different payment methods is important. The general
view regards to strategy tends to support mergers with activity focus and concentration on
core competences. However, in banking diversification into related industries such as
insurance can allow benefits from cross-selling and diversification of risk exposure. The
issue of size plays important role in revenue generation as consolidation and centralization
of functions can help smaller banks to obtain scale economies. Mergers between larger
banks can lead to increased market power and benefits from being too-big-to-fail (TBTF),
although diseconomies of scale have also been reported8
8 See Hensel, 2006
. Consideration of corporate
governance related issues accounts for managerial motivations and compensation, which
can effect decisions to engage in non-value maximizing mergers and thus potentially
destroy shareholder value.
This WP contributes to the existing literature by organizing and categorizing previous
findings in a coherent way. Collection and analysis of a large sample allows discovery of
cross-country differences. The large amount of observations also enables the study of
CARs across time. The findings of this review validate the previous empirical results in
the literature and provide a minor indication that U.S. banks returns might decrease as the
event window is stretched.
The remainder of this WP is organized according to the following structure: Section 2.
covers how to measure abnormal returns and cumulative abnormal returns. Section 3.
reviews and discusses previous empirical results under five subsections: 3.1. location, 3.2.
method of payment, 3.3. strategy focus, 3.4. size and 3.5. corporate governance. Section 4.
concludes the findings of this review and provides suggestions for future research. The
terms of return and abnormal return are used interchangeably in the following sections.
6
2. Measuring Abnormal Returns
This section reviews the basic methodological approaches used for measuring abnormal
returns. The focus is on empirical studies based on the event study methodology. In this
methodology researchers consider a sample of selected merger events and then measure
the return resulting from the mergers against a pre-determined benchmark to determine the
abnormal returns. This benchmark is usually based on a national bank industry index or a
general market index such as the S&P 500, NYSE, AMEX or NASDAQ, or a weighted
combination of these. A common approach is to apply multivariate regression approaches
in order to control for exogenous effects that might distort the benchmark.
2.1. Event Window
Apart from few exceptions, returns are measured on a daily level by using a time interval
called an event window. Event windows incorporate a specific number of days around the
date of the merger announcement. The date of the merger announcement is often referred
as the event date. It is usually the date when the merger is announced in Financial Times
or reported to a national regulatory entity.
2.1.1 Length of the Event Window
Caruso and Palmucci (2008) criticize the use of announcement date when studying
abnormal returns. They note that in less efficient markets leakages of information can
significantly distort the results. Houston and Ryngaert (2007) address this by setting the
announcement date as the information leakage date. Caruso and Palmucci (2008) find that
by using the rumor date instead of the announcement date the overall market value
creation can actually alter from negative to positive. Other studies have tried to address
this problem by incorporating pre-announcement event days in the event windows. The
use of pre-announcement event days is beneficial as it can reveal leakages of information,
7 Shorter windows might fail to capture efficiency gains related to the merger as
rationalization of branches, integration of data systems, refocusing of lending policies and
providing new product training for the target bank can take time to generate the aspired
improvements (Amel et al, 2004). On the other hand narrower windows reduce the
probability that external events can distort the returns (Whalen, 1997). This review finds a
minor indication that the negative returns of U.S. banks might augment as the length of the
length of the event window increases9
In this formula the Nt denotes the number of shares that have a return on day t.
.
2.2. Testing for Abnormal Returns
The most common approach for testing abnormal returns is a method that was originally
presented by Brown and Warner (1985). The calculation of abnormal returns incorporates
a model where the return of the market (Rmt) and a bank stock (Rit) are linearly linked to
each other. In this model the abnormal returns (ARit) are determined by subtracting the
predicted returns (αi + βi Rmt) from the actual realized returns (Rit). The αi and βi
coefficients found within the predicted return formula represent ordinary least square –
estimates for the market model parameters of the firm. [I]
I 𝐴𝐴𝐴𝐴𝑖𝑖𝑖𝑖 = 𝐴𝐴𝑖𝑖𝑖𝑖 − (𝛼𝛼�+ 𝛽𝛽�𝐴𝐴𝑖𝑖 𝑚𝑚𝑖𝑖)
As the samples tend to include more than one bank, it is necessary to calculate the average
abnormal returns on a specific day. Baradwaj, Fraser and Furtado (1990) have conducted
this using the following formula, which is just a simple average of all of the abnormal
returns at a specific time (e.g. merger announcement date t -1).
[II]
𝐴𝐴𝐴𝐴 ����=�1
𝑁𝑁𝑖𝑖�(� 𝐴𝐴𝐴𝐴𝑖𝑖𝑖𝑖) 𝑁𝑁𝑖𝑖
𝑖𝑖=1
8
2.3 Calculation of CARs
As the common approach in the literature is to examine event windows, it is necessary to
adjust the daily abnormal returns (AR) according to the chosen window length. This is
done by calculating cumulative abnormal returns (CARs) for the time interval that has
been decided. The CARs are calculated by summing up the average daily abnormal
returns according to the length of the event window. The following formula gives the
CARs for one of the most popular event windows -1/+1, where t denotes the date of the
merger announcement. [III]
𝐶𝐶𝐴𝐴𝐴𝐴𝑖𝑖−1,𝑖𝑖+1
��������������= � 𝐴𝐴𝐴𝐴����𝑖𝑖𝑖𝑖 𝑖𝑖+1
𝑖𝑖−1
The procedure explained above is able to provide the CARs for the bidder and the target
bank. However, in order to calculate the returns for the merged entity further steps have to
be taken. The combined return for the target and the bidder is achieved by calculating a
weighted average of the CARs that have been generated due to the merger. This is
illustrated in the following formula by Houston and Ryngaert (1994). [IV]
𝐶𝐶𝐴𝐴𝐴𝐴
������= (𝑉𝑉𝑖𝑖 (𝑏𝑏𝑖𝑖𝑏𝑏𝑏𝑏𝑏𝑏𝑏𝑏)∗ 𝐶𝐶𝐴𝐴𝐴𝐴𝑖𝑖 (𝑏𝑏𝑖𝑖𝑏𝑏𝑏𝑏𝑏𝑏𝑏𝑏)) + (𝑉𝑉𝑖𝑖 (𝑖𝑖𝑡𝑡𝑏𝑏𝑡𝑡𝑏𝑏𝑖𝑖)∗ 𝐶𝐶𝐴𝐴𝐴𝐴𝑖𝑖 (𝑖𝑖𝑡𝑡𝑏𝑏𝑡𝑡𝑏𝑏𝑖𝑖)) (𝑉𝑉𝑖𝑖 (𝑏𝑏𝑖𝑖𝑏𝑏𝑏𝑏𝑏𝑏𝑏𝑏)+ 𝑉𝑉𝐼𝐼 (𝑖𝑖𝑡𝑡𝑏𝑏𝑡𝑡𝑏𝑏𝑖𝑖))
The common approach seems to be using market value as the weight in this formula.
However, some studies have included results with different weighting factors like total
assets or total equity as reported in the balance sheet (see e.g. Cybo-Ottone and Murgia,
2000). In case of using market value, the weights are calculated for a date before the actual
merger announcement e.g. t – 10. This approach is criticized by Delong (2001) as the
resulting value gains might not realize symmetrically between the two parties and thus this
9 having previously used a simple method of weighting the CARs, later (Becher and
Campbell, 2005) addressed Delong’s concerns by using her model that accounts for the
daily changes in the sum of the acquirer and target bank during the event window, as
presented below, with MV denoting market value. [V]
𝐶𝐶𝐴𝐴𝐴𝐴
������= � 𝑙𝑙𝑙𝑙𝑡𝑡 𝑤𝑤𝑖𝑖𝑤𝑤𝑏𝑏𝑙𝑙𝑤𝑤 𝑙𝑙𝑏𝑏𝑤𝑤𝑡𝑡𝑖𝑖 ℎ−1
𝑤𝑤=1
( 𝑀𝑀𝑉𝑉𝑖𝑖𝑖𝑖 (𝑖𝑖𝑡𝑡𝑏𝑏𝑡𝑡𝑏𝑏𝑖𝑖)+ 𝑀𝑀𝑉𝑉𝑖𝑖𝑖𝑖 (𝑏𝑏𝑖𝑖𝑏𝑏𝑏𝑏𝑏𝑏𝑏𝑏) 𝑀𝑀𝑉𝑉𝑖𝑖𝑖𝑖−1 (𝑖𝑖𝑡𝑡𝑏𝑏𝑡𝑡𝑏𝑏𝑖𝑖)+ 𝑀𝑀𝑉𝑉𝑖𝑖𝑖𝑖−1 (𝑏𝑏𝑖𝑖𝑏𝑏𝑏𝑏𝑏𝑏𝑏𝑏)
)
3. Determinants of CARs
This section discusses CARs under five determining factors10
3.1. Location
In this first subsection CARs are discussed in relation to location under three topics
identified in previous empirical works. Consideration of these location related aspects is
important as cross-country variations e.g. in regulations, market structure, market
characteristics and culture can influence the CARs.
. These factors have often
been addressed in the empirical literature and a wider examination of them might reveal
valuable findings for investors and bank managers indicating what type of mergers
produce the highest returns.
3.1.1 Сross-Country Comparison11
The smaller amount of European observations has limited identification of cross-country
patterns and only few studies have compared results between U.S. and non-US
sub-samples12
10 1. location, 2. method of payment, 3. strategy focus, 4. size and 5. corporate governance. 11 For summarized results from previous studies see Table 10 in the Appendices
12 See Amihud, Delong and Saunders (2002), Delong (2003b), Hagendorff, Collins and Keasey (2007), Valkonov and Kleimeier (2007)
. Since European results did not start to emerge until the late 1990’s there is a
real need for cross-country comparisons. Discovery of similarities is important as they
might justify the extension of certain U.S. findings to Europe while discovery of
10
3.1.1.1. Return on Target Banks
Previous U.S. studies find higher CARs for the target banks than for the bidders. Similar
findings are presented also in European studies13
When examining CARs from under 10 day event windows [Graph I] American banks
generate most of the CARs that exceed 15% while European banks generate most of the
CARs below 5%. The calculated average CAR (13,1%) for the U.S. banks is higher than
the European average (9,7%)
. Valkanov and Kleimeier (2007) explain
this result by a zero-sum game, where the targets are beneficiaries at the expense of the
bidders.
14
. Similar finding can be observed with the daily AAR15 (U.S.
1,6%/ Europe 0,8%)16 as well as with samples of specific event windows17. While European
CARs from over 20 day event windows are scattered there seems to be a slight indication
of reducing CARs for the U.S. banks as the measurement period increases [Graph I]. The
returns of the Italian target banks are more similar to the other European observations
while Canadian observations seem to more coincide with their U.S. counterparts. By
reviewing the empirical findings it can be concluded that American target banks do
generate higher CARs, which has already been found in previous studies18. In addition,
European and US target banks are seen to have more deviating CARs than the bidders and
the merged entity19
Ismail and Davidson (2005) suggest that the lower European returns originate from
differences in regulatory frameworks and market structure as well as from increased
competition following the EU integration. Rad and Van Beek (1999) blame the inflexible
European employment markets, which might hinder realization of cost reductions from .
13 See e.g. Valkonov and Kleimeier (2007), Beitel and Schiereck (2001) and Cybo-Ottone and Murgia (2000 14 For more details see Table 2 in the Appendices
15 Calculated by dividing the sample average CAR with average length of event windows in the sample 16 For more details see Table 2in the Appendices
17 For more details see Table 1in the Appendices
11 branch office closures and staff reductions. This WP confirms the suggestions of previous
reviews and empirical studies regarding the higher CARs of U.S. targets and gives a slight
indication that U.S. target bank returns might reduce as the measurement period increases.
3.1.1.2. Return on Bidding Banks
Existing empirical works have established that returns of the bidding banks are
significantly lower than of the target banks. The general logic for this is that the market
does not believe in the abilities of the bidding banks to achieve the foreseen synergy and
efficiency benefits to an extent that would justify the size of the bid premium.
Comparison of CARs from under 15 day event windows [Graph II]shows higher amount
of European banks with positive returns and higher amount of U.S. banks with negative
CARs. Some of these negative U.S. CARs even exceed -2%. The calculated average CAR
supports the better performance of the European banks (0,3%) against the American banks
(-1,7%)20. This difference diminishes with daily AARs but is still observable (Europe 0,02%
/ U.S. -0,2%)21. European banks are also seen to generate higher returns across common
event windows: 0/0, -1/+1 and -5/+522. The minimum U.S. CARs [Graph II] seem to
decline when the event window is extended to 20 days and over. This can be also observed
when moving from the 0/0 and -1/+1 event windows to the -5/+5 event window23
Previous European studies observe positive CARs or no returns when using short event
windows (Beitel and Schiereck, 2001 and Cybo-Ottone and Murgia, 2000). Valkanov and . Madura
and Wiant (1994) provide further evidence for the declining CARs by measuring
abnormal returns over a 36 month window and observing a highly negative return of
-27,1%. From reviewing all this evidence it can be concluded that European bidding banks
do outperform their American counterparts.
12 Kleimeier (2007) make a similar European finding but later discover that when extending
the event window the returns turn negative. They suggest that this is due to the market’s
reconsideration of the bank value when signs of potential integration challenges start to
arise. This might also be a partial explanation for the declining U.S. CARs. Amel et al.
(2004) suggest that the poor performance of bidders could be due to using short event
windows that cannot capture the efficiency gains, which might require longer time to
realize. This might either indicate that investors do not believe in the bidding bank’s
ability to achieve the gains or that the time of achieving the gains exceeds the investors’
time horizon, suggesting potential inefficiency of the market. This WP confirms previous
findings24
The U.S. returns are high in under 5 day event windows, reaching almost 4% [Graph III].
The maximum U.S. CARs reduce when extending the window to 10 days and continue to
decrease towards the 20 and 30 day windows. None of the European observations in
Graph III show a negative return while there are 7 observations of negative American
returns. In addition to having higher deviation, the U.S. average return (1,10%) is also of higher returns by European bidding banks and finds a minor indication that
as the measurement period increases the minimum CAR observations of U.S. bidding
banks turn more negative.
3.1.1.3. Return on Merged Entity
The general view regarding returns on the merged entity suggests that there is no overall
value creation. It is argued that this is due to the losses of the bidding bank offsetting the
gains of the target (Amel et al, 2004 and Valkanov and Kleimeier, 2007). Moreover, U.S.
banks have been observed to generate higher CARs in the early 90’s when bidding banks
did not incur negative CARs (Valkanov and Kleimeier, 2007).
13 lower from the European average (1,76%) 25. However, the higher deviation and shorter
window length of U.S. observations can distort the results and no significant difference
can be observed between the U.S. (1,1%) and European (1,14%) daily AARs26. From
examination of all these findings it can be concluded that although the daily AARs do not
present clear differences, the 7 negative U.S. CARs and the reducing maximum U.S.
CARs could indicate lower performance for American mergers. Previous studies also
observe smaller CARs for American mergers (Delong, 2003b and Cybo-Ottone and
Murgia, 2000). While the target CARs are very high often above 10% and even exceeding
20%, the CARs for the merged entities do not generally exceed 4%. The two observations
exceeding the 4% limit are likely due to geographical coverage27
3.1.2. Intrastate vs. Interstate Mergers
and the American
observation by Zhang (1995) might be explained by methodological differences. This WP
provides further evidence for the better performance of merged European banks and finds
that maximum returns of U.S. banks decrease as the measurement period increases. The
better performance of European merged banks likely originates from better performance
of the bidders that due to their larger size have more weight in the calculation of combined
returns.
28
Comparison of CARs between interstate and intrastate mergers can be seen interesting as
geographical diversification tends entail more limited possibilities for cost reduction. On
the other hand the market might react positively to cross-state expansions presenting high
growth potential. In the existing literature there seems to be different views on the
definition of intrastate mergers and thus some researchers have decided to use two
different approaches. Becher (2000) offers the following general definition:
25 Average CAR (US) 1,10% vs. 1,76% (Europe) 26 See Table 1in the Appendices for more details
27 Djankov, Jindra and Klapper (2005) when studying East-Asian bank insolvencies and Caruso and Palmucci (2008) when studying inefficient Italian
market
14
“Intrastate mergers are defined as those mergers that take place between targets and bidders within the same state. Interstate mergers are defined as those mergers that take place among bidder firms that are not in the same state as the target firm they are acquiring.”
Houston and Ryngaert (1994) have criticized these types of definitions as they don’t
consider the possibility of the bidding bank having operations in the state of the target.
Thus they propose that calculation of overlapping branch offices in a specific city can be
seen more appropriate, as shown in the formula below29
Several empirical studies have found intrastate mergers performing better than interstate
mergers by producing higher CARs for the target banks
: [VI]
𝑂𝑂𝑉𝑉𝑂𝑂𝐴𝐴𝑂𝑂𝐴𝐴𝑂𝑂 = ∑ (𝑇𝑇𝑖𝑖, 𝑤𝑤
𝑖𝑖=1 𝐵𝐵𝑖𝑖)
∑𝑤𝑤𝑖𝑖=1(𝑇𝑇𝑖𝑖+ 𝐵𝐵𝑖𝑖)
30
, the bidding banks31 and the
merged entity32
29 In the formula n denotes the total number of cities where the target or the bidder have offices, Ti denotes the total number of offices the target has in city
I and Bi denotes the corresponding figure for the bidder.
30 See Cornett and Tehranian (1992), Siems (1996), Houston, James and Ryngaert (2001),Delong (2001) and Becher and Campbell (2005). 31 See Baradwaj, Dubofsky and Fraser (1991), Siems (1996), Houston, James and Ryangaert (2001), Cornett et al. (2003)
32 See Becher and Campbell (2005)
. The intrastate merger CARs for the targets are quite significant ranging
from 11,00% (-1/0) to 24,6% (-4/+1). The extent to which intrastate mergers can create
higher returns varies between studies. While Becher and Campbell (2005) observe smaller
difference (intra16,69% / inter13,98%) Houston, James and Ryngaert (2001) find stronger
evidence (intra24,62 / inter16,17%). The bidding banks generate negative CARs across the
line but these losses are smaller in case of the intrastate mergers. Siems (1996) actually
finds that the top 5 “branch overlap mergers” produce positive bidder CARs of 2,80%
against the negative CARs of -1,58% from the bottom 5 “branch overlap mergers”. Becher
and Campbell (2005) find intrastate mergers producing more negative CARs but they
observe that the difference (intra-1,59% /inter -1,29%) is not statistically significant.
Regarding the merged entity, Whalen (1997) finds that intrastate mergers outperform the
overall sample within the -2/0 window (intra1,49% / 1,22%) and underperforms it with the
15 that intrastate mergers generate higher CARs for the merged banks (intra0,87% / inter0,79%).
Moreover, with few exceptions, Delong (2001, 2003a) finds that the target CARs increase
across the line when the companies follow a strategy of activity focus or intrastate focus.
From reviewing all this empirical evidence it can be concluded that the existing results
clearly support intrastate mergers. This is in line with the conclusion of Houston, James
and Ryngaert (2001) who observe that differences between intrastate and interstate are
significant and argue that most bank merger value gains arise from elimination of
overlapping operations, consolidation of backroom operations and other opportunities to
cut costs. They further note that potential for revenue enhancement is not valued as highly
in the market.
3.1.3 Domestic vs. Cross-Country Mergers33
Comparison of domestic and cross-country mergers can be seen interesting as cross-border
transactions are exposed to a variety of challenges ranging from different language and
culture to regulatory and market inconsistencies. Moreover, limited branch overlaps and
cost cutting opportunities can also impact the CARs.
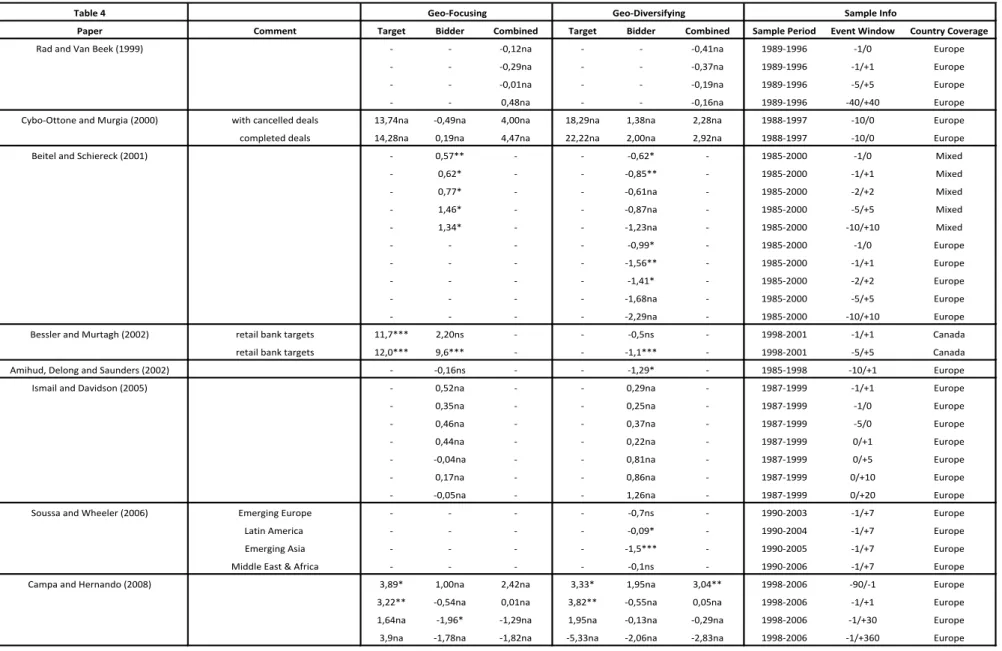
Campa and Hernando (2008) study the differences between these two types of mergers
and find that target banks generate lower CARs with domestic mergers when using the
-1/+1 event window (dom3,22% / cross3,82%). Similar finding with targets is made by
Cybo-Ottone and Murgia (2000) when using a longer -10/0 event window but the returns are not
considered statistically significant. The higher target returns in cross-country mergers
might be due to larger bid premiums paid by foreign banks. The results regarding bidding
banks in cross-border deals are conflicting. Cybo-Ottone and Murgia (2000) report higher
and statistically significant bidder CARs for cross-border deals (cross1,38% / dom.-0,49%)
while Beitel and Schiereck (2001) and Bessler and Murtagh (2002) present contradictory
16 results. Amihud, Delong and Saunders (2002) discover higher negative bidder CARs when
European banks merge with Non-European banks (cross-1,29% / dom-0,16%). Ismail and
Davidson (2005) also suggest that the market might consider more favorably mergers
taking place within Europe. Soussa and Wheeler (2006) find that this does not apply to the
expansion of U.K. banks to the East European markets. Comparable results by Campa and
Hernando (2008) are inconclusive even when median CARs and the percentage of positive
returns are examined. However, Ismail and Davidson (2005) find that purely domestic
mergers generate higher returns with shorter event windows but with longer windows the
findings turn to opposite. They also note that insignificance of the results within several of
their event windows can be a sign of investors still having too many difficulties in
assessing the benefits of cross-border diversification.
Regarding the merged entity, a study by Rad and Van Beek (1999) gives an indication that
mergers with domestic focus lead to less negative CARs within the -1/+1 window (dom
-0,12% / cross-0,41%). Cybo-Ottone and Murgia (2000) find similar evidence when
observing a sample with high yearly overlap, although they establish significance only for
the cross-border CARs. They explain the lower return from cross-border deals by the
smaller deal size and the smaller size of the target banks. Campa and Hernando (2008)
find higher average but lower median CARs for the merged banks in cross-border deals.
This can indicate existence of extreme returns that augment the mean CARs for the
combined entity. Moreover, the domestic deals are observed to have higher percentage of
positive returns. Campa and Hernando (2008) rationalize this result with higher potential
synergy effects and competition impact of domestic deals.
Review of all of these findings suggests that purely domestic mergers tend to generate
higher returns for the bidder and the merged entity, although several inconsistencies are
17 might be due to potentially higher bid premiums paid by foreign banks. The findings
regarding the bidder and merged bank coincide with the results of Lepetit, Patry and Rous
(2004) who by using a bivariate GARCH-model find that market reacts positively to
mergers with geographical specialization. This reaction is suggested to result from
expected scale economies and increased market power.
3.2. Method of Payment34
When studying bidding banks Sushka and Bendeck (1988) find that equity transactions
generate higher negative CARs (-1,94%) than pure cash transactions (-0,80%). Although
the cash observation is not statistically significant this finding implies that the market
might view cash transactions more favorably. Later results by Cornett and De (1991b),
Grullon, Michaely and Swary (1997) and Cornett et al. (2003) also show higher returns for
pure cash deals. By using a cross-sectional regression Grullon, Michaely and Swary
(1997) further discover that the share price reaction for the acquirer is more positive with
The chosen payment method can impact the way how the market reacts to the merger
announcement. Myers and Majluf (1984) argue that it is more favorable for companies to
issue equity when their shares are overvalued. Krasker (1996) further states that investors
should interpret new issues unfavorably and larger issues even more unfavorably than
smaller ones.
Regarding target banks Cornett and De (1991b) observe cash deals (12,55%) generating
higher CARs than stock (9,46%) or mixed payment deals (6,28%). Grullon, Michaely and
Swary (1997) similarly observe the highest returns for cash deals (10,95%) with the
exception of mixed payments (9,82%) performing slightly better than pure stock deals
(9,74%). This is in line with Becher’s (2000) results, which indicate that mix-payment
transactions rate significantly better compared to pure stock deals.
18 all-cash transactions that incorporate low premiums and a target company that is located in
the same state.
When studying the overall value creation for the merged entity Cornett and De (1991a)
observe that mixed payments generate the highest returns (0,89%) against stock (0,71%)
and cash payments (0,34%) but the differences between these are not statistically
significant. Grullon, Michaely and Swary (1997) discover a contrary result where cash
deals (5,01%) rate better when compared to stock (3,59%) or mixed transactions (3,83%).
Ismail and Davidson (2005) similarly observe that cash deals generate the highest returns.
However, this result only applies to the longer event windows and with shorter windows
mixed payment deals actually produce the highest returns.
Although statistical significance for CAR differences is not established in all of studies
works, the overall review suggests that pure cash and mixed-payments tend to generate
higher CARs than pure stock deals. This conclusion follows the logic of Ismail and
Davidson (2005) who argue that merger deals financed with equity tend to earn lower
returns due to the overvaluation of the bidder’s shares. Amel et al. (2004) further note that
mergers in the 90’s performed better due to the higher use of cash.
3.3. Strategy Focus35
Previous empirical results regarding target banks seem to vary. Cybo-Ottone and Murgia
(2000) find that in Europe activity diversification (15,02%) generates higher CARs than The current view seems to support companies that focus on their core competencies.
These types of companies are easier for investors to analyze and allow investors to
diversify their own portfolios. However, in banking expansion into related industries like
insurance can reap benefits from cross-selling and diversification of risk exposure. Thus,
strategic focus should be included in the examination of merger CARs.
19 activity focus (14,72%). Beitel and Schiereck (2001) discover a similar European result
with even more extensive differences between diversification (25,39%) and focus
(9,90%). Delong (2001) finds contrary evidence from the American market observing
higher CARs with activity focus (diver15,32% / focus18,30%).
This cross-country division of results is not as clear with the bidding banks. Delong (2001)
finds smaller negative bidder CARs for activity focus (diver-1,85% / focus-1,46%). Cornett et
al. (2003) make a similar discovery with the U.S. bidders although CARs with activity
focus are not significant. Cybo-Ottone and Murgia (2000) provide evidence from the
European market stating positive CARs with diversification (1,02%) and negative returns
with focus (-0,47%). Ismail and Davidson (2005) observe positive returns for European
bidding banks but make a contradictory finding showing slightly lower CARs for
diversifying mergers. Bessler and Murtagh (2002) observe Canadian banks having higher
CARs when acquiring domestic retail banks (9,6%) instead of domestic wealth
management companies (-2,5%). The results regarding the merged entities are also
divided. Three U.S. studies find evidence for focusing mergers36
36 Delong (2001), Delong (2003a) with geo-focusing and Cornett, McNutt and Tehranian (2006)
, while Cybo-Ottone and
Murgia (2000) find contrary evidence in the European market. Cybo-Ottone and Murgia
assume that the high CARs originate from ability to cross-selling banking and insurance
products, which leads to improved economies of scope and revenue efficiencies
The contradictory results by Ismail and Davidson (2005) make it harder to establish a
coherent view of the impact of activity/product focus. However, overall examination of
the results shows that on average product diversification tends to lead to higher CARs in
Europe while contrary evidence is observed in the USA. The Canadian banks are seen to
20
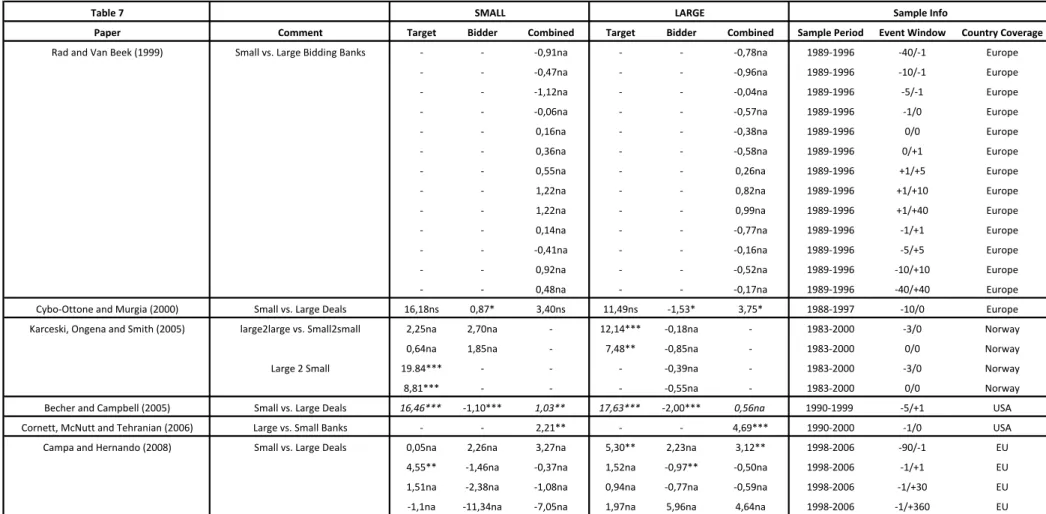
3.4. Size37
The bank efficiency literature often speaks for creation of larger banks as this can result to
synergy benefits from reducing overlapping functions and centralizing certain operations
like back office. However, according to some arguments improvements in efficiency can
be achieved only up to a certain degree and after this problems related the larger size start
to generate adverse efficiency effects and diseconomies of scale38
Rad and Van Beek (1999) argue that if economies of scale and scope have significance,
small European bidding banks should outperform their larger counterparts. Their results
reveal that small bidding banks do actually generate higher CARs
. Thus, the issue of size
and its relation to abnormal returns should be addressed in this review.
39
37 For summarized results from previous studies see Table 7 in the Appendices 38 See Hensel (2006)
39 In the -1/+1 window the smaller bidders generate 0,14% against. the – 0,77% of the large bidders.
in most the event
windows but the differences are not statistically significant. In a more recent study Cornett
McNutt and Tehranian (2006) find that mergers involving large banks (4,69%) are able to
generate higher returns than smaller banks (2,21%) and the differences are statistically
significant. By using a different methodology Kane and Pennachi (2000) discover that
banks generate higher returns when the target institution is large. They rationalize this
result by the Too-Big-To-Fail – factor that they refer to as
Too-Big-To-Be-Disciplined-Adequately. This benefits the bank in the form of lower financing costs, subsidies in the
face of insolvency and passing of the uninsured credit risk to the taxpayers. A similar
finding is made on the Norwegian market by Karceksi, Ongena and Smith (2005). They
reveal that the target banks earn higher CARs when the bidding bank is large or when both
the bidding bank and the target bank are large. Although the scale of CAR differences in
their study is high, the small amount of mergers between small banks does not allow
21 The size of the merger deal has also been addressed by some scholars. Becher and
Campbell (2005) define large mergers to be any transactions that are greater or equal to
$400 millions and small mergers are considered those below this limit. Although they find
some variations between small and large deals, these differences are not statistically
significant. Campa and Hernando (2008) define large deals as those positioned in the
upper quartile when measuring the joint market capitalization of the merging banks. They
establish that large deals produce significantly higher returns for the bidder. In case of
smaller deals targets experience higher CARs around the event date but examination of
long term effects -1/+360 supports large deals. Cybo-Ottone and Murgia (2000) note that
European merger deals in their sample are significantly larger when compared to
American deals, which is mostly due to the higher average size of European banks. They
discover that small deals generate higher returns, although the results are significant only
for the bidding banks.
It is not easy to make clear conclusions from this review. However, regarding the bank
size it can be argued that existing results seem to imply that mergers including larger
banks can lead to higher CARs, although statistical insignificance hinders certainty. The
contradictory results by Rad and Van Beek (2005) might be due to the pure concentration
on the bidding banks. The findings regarding deal size are inconclusive and interestingly
do not clearly support the argument for large size, although one would expect this from
the relationship between the bank size and the deal size.
3.5. Corporate Governance40
Bank efficiency literature has previously discussed adverse effects related to agency
problems and management hubris. Thus, managerial motivations, compensation and other
22 issues are addressed in this review as they can effect decisions to engage in non-value
maximizing mergers and thus potentially destroy shareholder value.
Gupta and Misra (2007) assume that the market can distinguish between managerial
motivations and that value enhancing mergers are primarily driven by expected synergy
benefits. By analyzing a sample of 503 bids between U.S. banks they find that value
enhancing mergers tend to generate higher CARs for the target and the merged bank.
Datta, Iskandar-Datta and Raman (2001) observe that companies with high equity based
compensation schemes for managers generate higher CARs and thus benefit the
shareholders. In addition they observe that merger premiums paid in high equity based
compensation firms are lower than in firms that do not offer significant stock options.
Hagendorff, Collins and Keasey (2008) study the relation of investor protection to CARs
by using a sample of 204 US and European bank acquirers. The findings of their study
indicate that bidding banks generated higher CARs when they acquire targets from
countries that have low level of investor protection regulations, such as many European
countries. They suggest that this relates to investors demanding additional compensation
for low governance standards and from higher risk of insider expropriation. Baradwaj,
Fraser and Furtado (1990) study how hostility in bank takeovers can impact the CARs.
From a sample of 23 bidding banks they find that target banks receive significantly higher
returns when they are subject to a hostile takeover. Differences are also observed within
the negative CAR of the Bidders, although they are not significant. Baradwaj, Dubofsky
and Fraser (1991) examine the way how regulatory changes impact CARs. By comparing
CARs from a subsample of 18 banks that engaged in defensive mergers to strengthen their
position in anticipation of interstate merger deregulation, they reveal higher negative
returns for the defensive bidders compared to the overall sample. This seems logical as a
23 profit efficiencies. Sushka and Bendeck (1988) find bidders taking on emergency mergers
with the will of bank regulators generating higher but insignificant returns. These higher
returns are suggested to arise from potential strengthening of the market position,
elimination of competitors as well as potential funding and validation received from the
financial regulator. Moreover, successful restructuring of the target through staff reduction
and branch closures might help to sort out the distressed banks as has been previously
observed in the 1990’s financial crisis (Honkapohja, 2009). The findings from this review
suggest that governance practices have positive impact on abnormal returns as lack of
managerial entrenchment and high investor protection reap better results. Moreover, the
benefits of aligning the interests of managers and shareholders can also be observed.
4. Conclusion
This empirical review of merger announcement related CARs suggests differences
between the CAR determinants. It is found that target banks enjoy significant merger
related wealth effects both in the U.S. and in Europe. Bidding banks seem to generate
negative and merged banks slightly positive CARs on average. U.S. targets outperform
their European counterparts, while European bidding banks and merged banks beat
American counterparts by generating slightly positive CARs. A minor indication of
declining U.S. bank returns is found when the event window is extended. Review of the
findings further suggests that market seems to value more mergers that lead to activity
focus and geographical focus. The use of cash and a mix of cash/shares are observed to
dominate pure stock as the optimal payment method. Small evidence is found to support
bank size but results regarding deal size are inconclusive. Moreover, correct motivations
for engaging in mergers and high equity compensation are seen to increase CARs.
This review has evoked several interesting questions that could be pursued in future
24 markets, especially to the BRIC-economies. The saturation of the banking market in the
developed economies leads to banks seeking new growth opportunities. In this regard
understanding the shareholder value effects that relate to global mergers would be
interesting and might potentially allow extension of previous findings to a global scale.
Future works should use standardized even window lengths as this would facilitate
comparison. Moreover, there is clear need for studying merger effects using longer
measurement periods. Only few studies measure CARs with over 20 day event windows
and thus some impacts might remain hidden. In addition, longer event windows might
provide validation for the suggestion of declining CARs of U.S. banks. Regards to the
financial crisis event studies examining distressed banks would be welcomed. These might
confirm the suggestions of Sushka and Bendeck (1988) of the potential benefits of taking
over distressed targets. Studies on activity diversification mergers should focus more on
cross-selling benefits with insurance companies as these could explain some of the
inconsistent results found in Cybo-Ottone and Murgia (2000). Previous research has
already established relationship between specific antitakeover provisions and firm value.
Kadyrzhanova (2006) observes antitakeover provisions leading to higher shareholder
value in concentrated industries and lower value in unconcentrated industries. Bebchuk,
Cohen and Ferrel (2009) find several (IRRC) provisions leading to large negative
abnormal returns. Brown and Caylor (2006) further discover that poison pills and
staggered boards have negative impact on firm valuation. It would be interesting to
expand these studies to market reactions to merger announcements. Previous studies
(Ramaswamy, 1997) have also established that strategic similarities between bidder and
target lead to better performance and it would be interesting to see if similar finding can
25
Graph I. Target CARs - Country Comparison
Graph II. Bidder CARs - Country Comparison
Graph III. Merged Entity CARs - Country Comparison -5,00 0,00 5,00 10,00 15,00 20,00 25,00
0 10 20 30 40 50
C A Rs ( % )
Event Window Length (days)
CARs - Targets
USA Europe Italy Norway Canada -12 -10 -8 -6 -4 -2 0 2 4
0 10 20 30 40 50
C A Rs ( % )
Event Window Lenght (days)
CARs - Bidders
USA Europe Italy UK Canda -2 0 2 4 6 8 10
0 10 20 30 40 50
C A Rs ( % )
Event Window Length (days)
CARs - Merged Entity
USA
Europe
Italy
REFERENCES
[1] Akhavein, Jalal; Berger, Allen; Humphrey, David. 1997. "The Effects of Megamergers on Efficiency and Prices:
Evidence from a Bank Profit Function." Review of Industrial Organization, 12:95-135.
[2] Alien, Linda; Cebenoyan, Sinan. 1991. “Bank Acquisition and Ownership Structure: Theory and Evidence.” Journal
of Banking and Finance, August:425-448. As results cited in: Beitel, Patrick; Schiereck, Dirk. 2001. “Value creation at
the ongoing consolidation of the European banking market” Institute for Mergers and Acquisition, Working Paper No.
05/01.
[3] Altunbas, Yener; Marques, David. 2008. “Mergers and acquisition and bank performance in Europe: The role of
strategic similarities.” Journal of Economics and Business, 60:204-222.
[4] Amel, Dean; Barnes, Colleen; Panetta, Fabio; Salleo, Carmelo. 2004. “Consolidation and efficiency in the financial
sector: A review of the international evidence.” Journal of Banking and Finance, 28:2493-2519.
[5] Amihud, Yakov; DeLong, Gayle; Saunders, Anthony. 2002. “The Effects of Cross-Border Mergers on Bank
Risk and Value. “ Journal of International Money and Finance, 21:857–877.
[6] Anderson, Christopher; Becher, David; Campbell, Terry. 2004. “Bank mergers, the market for bank CEOs, and
managerial incentives.” Journal of Financial Intermediation, 13:6-27.
[7] Banerjee, Ajeyo; Cooperman, Elizabeth. 2000. “Returns to targets and acquirers: Evidence for bank mergers in the
90's.” University of Colorado, Working Paper, As results cited in: Beitel, Patrick; Schiereck, Dirk. 2001. “Value
creation at the ongoing consolidation of the European banking market” Institute for Mergers and Acquisition, Working
Paper No. 05/01.
[8] Baradwaj, Babu; Dubofsky, David; Fraser, David. 1991. “Bidder Returns in Interstate and Intrastate Bank
Acquisitions.” Journal of Financial Services Research, 5:261-272.
[9] Baradwaj, Babu; Fraser, Donal; Furtado, Eugene. 1990. “Hostile Bank Takeover Offers.” Journal of Banking and
Finance, 14:1229-1242.
[10] Bebchuk, Lucian; Cohen, Alma; Ferrel, Allen. 2006. “What Matters in Corporate Governance?.” Review of
Financial Studies, 22 (2):783-827.
[11] Becher, David. 2000. “The Valuation Effects of Bank Mergers” Journal of Corporate Finance, 6:189-214.
[12] Beitel, Patrick; Schiereck, Dirk. 2001. “Value creation at the ongoing consolidation of the European banking
market” Institute for Mergers and Acquisition, Working Paper No. 05/01.
[13] Berger, Allen; Hancock, Diana; Humphrey, David. 1993. “Bank efficiency derived from the profit function”
Journal of Banking and Finance, 17:317-347.
[14] Bessler, Wolfgang; Murtagh, James. (2002) “The stock market reaction to cross-border acquisitions of financial
services firms: an analysis of Canadian banks” Journal of International Financial Markets, Institutions and Money,
12:419-440.
[15] Black, Harold; Bostic, Raphael; Robinson, Breck; Schweitzer, Robert. 2005. “Do CRA-Related Events Affect
Shareholder Wealth? The Case of Bank Mergers.” The Financial Review, 40:575-586.
[16] Bliss, Richard; Rosen, Richard. 2001. “CEO Compensation and Bank Mergers.” Journal of Financial Economics,
61:107–138, As results cited in: Hagendorff, Jens; Collins, Michael; Keasey, Keasey. 2007. “Bank Governance and
[17] Brewer, Elijah; Jackson, William; Jagtiani, Julapa; Nguyen, Thong. 2000. “The price of bank mergers in the
1990s.” Economic Perspectives - Federal Reserve Bank of Chicago, First Quarter 2000:2-23. As results cited in: Beitel,
Patrick; Schiereck, Dirk. 2001. “Value creation at the ongoing consolidation of the European banking market” Institute
for Mergers and Acquisition, Working Paper No. 05/01.
[18] Brown, Lawrence; Caylor, Marcus. 2006. “Corporate Governance and Firm Valuation.” Journal of Accounting and
Public Policy, 25:409-434.
[19] Brown, Stephen; Warner, Jerold. 1985. “Using daily stock returns, the case of event studies.” Journal of Financial
Economics, 8:205-258.
[20] Campa, Jose; Hernando, Ignacio. 2006. “M&As Performance in the European Financial Industry.” Journal of
Banking & Finance, 30(12) pp. 3367–3392, As results cited in: Hagendorff, Jens; Collins, Michael; Keasey, Keasey.
2007. “Bank Governance and Acquisition Performance.” Corporate Governance, 15(5):957-968.
[21] Campa, Jose; Hernando, Ignacio. 2008. “The Reaction by Industry Insiders to M&As in the European Financial
Industry.” Journal of Financial Services Research, 33:127-146
[22] Caruso, Annalisa; Palmucci, Fabrizio. 2008. “Measuring value creation in bank mergers and acquisitions”
University of Bologona, Working Paper.
[23] Cornett, Marcia; De, Sankar. 1991a. “Common stock returns in corporate takeover bids: Evidence from interstate bank mergers” Journal of Banking & Finance, 15:273-295.
[24] Cornett, Marcia; De, Sankar. 1991b. “Medium of Payment in Corporate Acquisitions: Evidence from Interstate
Bank Mergers.” Journal of Money, Credit, and Banking, 23(4):767-776.
[25] Cornett, Marcia; Hovakimian, Gayane; Palia, Darius; Tehranian, Hassan. 2003. “The impact of the
manager-shareholder conflict on acquiring bank returns.” Journal of Banking and Finance, 27:103-131.
[26] Cornett, Marcia; Tehranian, Hassan. 1992. “Changes in corporate performance associated with bank acquisitions.”
Journal of Financial Economics, 31:211-234.
[27] Cornett, Marcia; McNutt, Jamie; Tehranian, Hassan. 2006. “Performance Changes Around Bank Mergers:
Revenue Enhancement versus Cost Reductions.” Journal of Money, Credit and Banking, 38(4):1013-1049.
[28] Cybo-Ottone, Alberto; Murgia, Maurizio. 2000. “Mergers and shareholder wealth in European banking.” Journal
of Banking & Finance, 24:831-859.
[29] Cyree, Ken; DeGennaro, Ramon. 1999. “A generalized method for detecting abnormal returns and changes in
systematic risk.” University of Tennessee, As results cited in: Beitel, Patrick; Schiereck, Dirk. 2001. “Value creation at
the ongoing consolidation of the European banking market” Institute for Mergers and Acquisition, Working Paper No.
05/01.
[30] Datta, Sudip; Iskandar-Datta, Mail; Raman, Kartik. 2001. “Executive Compensation and Corporate Acquisition
Decisions.” The Journal of Finance, 56(6): 2299-2336.
[31] Delong, Gayle. 2001. “Stockholder gains from focusing versus diversifying bank mergers.” Journal of Financial
Economics, 59:221-252.
[32] Delong, Gayle. 2003a. “Does Long-Term Performance of Mergers Match Market Expectations? Evidence from the
US Banking Industry.” Financial Management, 32(2):5-25.
[33] Delong, Gayle. 2003b. “The Announcement Effects of US versus non-US Bank Mergers: Do They Differ?.”
[34] Djankov, Simeon; Jindra, Jan; Klapper, Leora. 2005. “Corporate valuation and the resolution of bank insolvency in
East Asia.” Journal of Banking & Finance, 29:2095-2118.
[35] Grullong, Gustavo; Michaely, Roni; Swary, Itzhak. 1997. “Capital Adequacy, Bank Mergers, and the Medium of
Payment.” Journal of Business Finance & Accounting, 24(1):97-122.
[36] Gupta, Atup; Misra, Lalatendu. 2007. “Deal Size, Bid Premium, and Gains in Bank Mergers: The Impact of
Managerial Motivations.” The Financial Review, 42:373-400.
[37] Hagendorff, Jens; Collins, Michael; Keasey, Keasey. 2007. “Bank Governance and Acquisition Performance.”
Corporate Governance, 15(5):957-968.
[38] Hagendorff, Jens; Collins, Michael; Keasey, Kevin. 2008. “Investor Protection and the value effects of bank
mergers announcements in Europe and the US.” Journal of Banking & Finance, 32:1333-1348.
[39] Hannan, Timothy; Wolken, John. 1989. “Returns to Bidder and Targets in the Acquisition Process: Evidence from
the Banking Industry.” Journal of Financial Services Research, 3:5-16.
[40] Hensel, Nyantara. 2006. “Cost-Efficiencies, Profitability and Strategic Behavior: Evidence from Japanese
Commercial Banks.” International Journal of Managerial Finance, 2(1):49-76.
[41] Hawawini, Gabriel; Swary, Itzhak. 1990. “Mergers and Acquisition in the US banking industry: Evidence from capital market.” North-Holland. As results cited in: Beitel, Patrick; Schiereck, Dirk. 2001. “Value creation at the
ongoing consolidation of the European banking market” Institute for Mergers and Acquisition, Working Paper No.
05/01.
[42] Hayward, Mathew; Hambrick, Donald. 1997. “Explaining the Premium Paid for Large Acquisitions: Evidence of
CEO Hubris.” Administrative Science Quarterly, 42:103–127. As results cited in: Hagendorff, Jens; Collins, Michael;
Keasey, Keasey. 2007. “Bank Governance and Acquisition Performance.” Corporate Governance, 15(5):957-968.
[43] Honkapohja, Seppo. 2009. “The Financial Crises in Nordic Countries.” Bank of Finland Research, Discussion
Paper 5/2009.
[44] Houston, Joel; James, Christopher; Ryngaert, Michael. 2001. “Where do merger gains come from? Bank mergers
from the perspective of insiders and outsiders,” Journal of Financial Economics, 60:285-331.
[45] Houston, Joel; Ryngaert, Michael. 1994. “The overall gains from large bank mergers.” Journal of Banking &
Finance, 18:1155-1176.
[46] Hughes, Joseph; Lang, William; Mester, Loretta. 1996. “Efficient Banking under Interstate Branching.” Journal of
Financial Services Research, 10:163-180. As results cited in: Beitel, Patrick; Schiereck, Dirk. 2001. “Value creation at
the ongoing consolidation of the European banking market” Institute for Mergers and Acquisition, Working Paper No.
05/01.
[47] Ismail, Ahmad; Davidson, Ian. 2005. “Further Analysis of Mergers and Shareholder Wealth Effects in European
Banking.” Applied Financial Economics, 15:13-30.
[48] James, Christopher; Wier, Peggy. 1988. “Returns to Acquirers and Competition in the Acquisition Market: The Case of Banking.” The Journal of Political Economy, 95(2):355-370.
[49] Kadyrzhanova, Dalida. 2005. “Does Governance Pay, or Is Entrenchment the Way? Merger Gains and Antitakeover Provisions, Columbia University, Job Market Paper November 2005.
[50] Kane, Edward; Pennacchi, George. 2000. “Incentives for Banking Megamergers: What Motives Might Regulators
[51] Karceski, Jason; Ongena, Steven; Smith, David. 2005. “The Impact of Bank Consolidation on Commercial
Borrower Welfare.” Journal of Finance, 60(4):2043-2082.
[52] Krasker, William. 1986. “Price Movements in Response to Stock Issues under Asymmetric Information.” Journal
of Finance, 41(1):93-105.
[53] Krivin, Dmitry; Patton, Robert; Rose, Erica; Tabak, David. 2003. “Determination of the Appropriate Event
Window Length in Individual Stock Event Studies” NERA, Discussion Paper.
[54] Kwan, Simon; Wilcox, James. 1999. “Hidden cost reductions in bank mergers: Accounting for more productive
banks” Working Papers in Applied Economic Theory, Federal Reserve of San Francisco. As results cited in: Beitel,
Patrick; Schiereck, Dirk. 2001. “Value creation at the ongoing consolidation of the European banking market” Institute
for Mergers and Acquisition, Working Paper No. 05/01.
[55] LePetitt, Laetitia; Patry, Stephanie; Rous, Philippe. 2004. “Diversification versus specialization: an event study of
M&As in the European banking industry.” Applied Financial Economics, 14:663-669.
[56] Madura, Jeff; Wiant, Kenneth. 1994. “Long-term valuation effects of bank acquisitions.” Journal of Banking &
Finance, 18:1135-1154.
[57] Myers, Stewart; Majluf, Nicholas. 1984. “Corporate Financing and Investment Decisions When Firms Have
Information that Investors Do not Have.” Journal of Financial Economics, 13(2):187-221.
[58] Palia, Darius. 1994. “Recent evidence on bank mergers.” Financial Markets, Institutions, & Instruments, 3:36-59.
As results cited in: Beitel, Patrick; Schiereck, Dirk. 2001. “Value creation at the ongoing consolidation of the European
banking market” Institute for Mergers and Acquisition, Working Paper No. 05/01.
[59] Pilloff, Steven; Santomero, Anthony. 1997. “The Value Effects of Bank Mergers and Acquisitions.” The Wharton
School, University of Pensylvania, Working Paper.
[60] Pilloff, Steven. 1996. “Performance Changes and Shareholder Wealth Creation Associated with Mergers of
Publicly Traded Banking Institutions.” Journal of Money, Credit and Banking, 28(3):294-310.
[61] Rad, Alieaza; Van Beek, Luuk. 1999. “Market Valuation of European Bank Mergers.” European Management
Journal, 17(5):532-540.
[62] Ramaswamy, Kannan. 1997. “The Performance Impact of Strategic Similarity in Horizontal Mergers: Evidence
from the U.S. Banking Industry.” Academy of Management Journal, 40(3):697-715.
[63] Rhoades, Stephen. 1994. “A Summary of Merger Performance Studies in Banking, 1980-93 and an Assessment of
the "Operating Performance" and "Event Study" Methodologies.”The Federal Reserve, Research Paper July 1994.
[64] Schiereck, Dirk; Strauss, Marc. 2000. “Zum Ankündigungseffect grosser Bankfusionen.” M&A Revew,
11/2000:421-425, As Results cited in: Beitel, Patrick; Schiereck, Dirk. 2001. “Value creation at the ongoing
consolidation of the European banking market” Institute for Mergers and Acquisition, Working Paper No. 05/01.
[65] Seidel, G. 1995. “Kritische Erfolgsfactoren bei Unternehmensübernahmen: Eine Analyse der US-Bankenbranche.”
Wiesbaden, Gabler. As results cited in: Beitel, Patrick; Schiereck, Dirk. 2001. “Value creation at the ongoing
consolidation of the European banking market” Institute for Mergers and Acquisition, Working Paper No. 05/01.
[66] Siems, Thomas. 1996. “Bank Mergers and Shareholder Wealth: Evidence from 1995's Megamerger Deals.”
Financial Industry Studies, August:1-12.
[67] Soussa, Farouk; Wheeler, Tracy. 2006. “Do annoucements of bank acquisitions in emerging market create value.”
[68] Subrahmanyam, Vijaya; Rangan, Nanda; Rosenstein, Stuart. 1997. “The role of outside directors in bank
acquisitions.” Financial Management, 26(3):23-26. As results cited in: Beitel, Patrick; Schiereck, Dirk. 2001. “Value
creation at the ongoing consolidation of the European banking market” Institute for Mergers and Acquisition, Working
Paper No. 05/01.
[69] Sushka, Marie; Bendeck, Yvette. 1988. “Bank Acquisitions and Stockholders' Wealth.” Journal of Banking &
Finance, 12:551-562.
[70] Toyne, Michael; Tripp, James. 1998. “Interstate Bank Mergers and Their Impact on Shareholder Returns: Evidence
from the 1990s.” Quarterly Journal of Business and Economics, 37(4):48- 58.
[71] Valkanov, Emil; Kleimeier, Stefanie. 2007. “The role of regulatory capital in international bank mergers and
acquisitions.” Research in International Business and Finance, 21:50-68.
[72] Walter, Ingo. 1997. “Universal Banking: A Shareholder Value Perspective.” European Management Journal,
15(4):344-360.
[73] Vander Vennet, Rudi. 1996. “The effect of mergers and acquisition on the efficiency and profitability of EC credit
institutions.” Journal of Banking & Finance, 20:1531-1558.
[74] Whalen, Gary. 1997. “Wealth Effect of Intraholding Company Bank Mergers: Evidence from Shareholder
Returns.” Managerial Finance, 23(1):91-107.
[75] Yang, Xiokai; Liu, Wai-Man. 2008. “Bank M&As Motives and Evidence.” In Increasing Returns and
Inframarginal Economics, ed. James Buchanan, Ng Yew-Kwang and Guang-Zhen Sun, 1-52, World Scientific
Publishing.
[76] Zhang, Hao. (1995) “Wealth Effects of US bank takeovers.” Applied Financial Economics, 55(5):329-336. As
results cited in: Beitel, Patrick; Schiereck, Dirk. 2001. “Value creation at the ongoing consolidation of the European
banking market” Institute for Mergers and Acquisition, Working Paper No. 05/01.
[77] Zollo, Maurizio; Leschinkskii, Dima. 2000. “Can Firms Learn to Acquire?, Do Markets Notice?.” The Wharton
APPENDICES
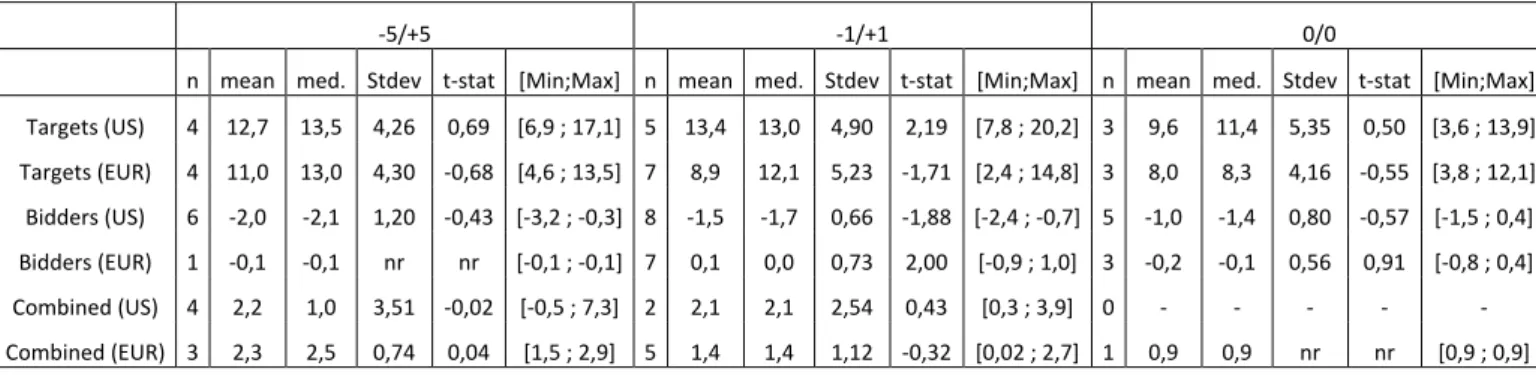
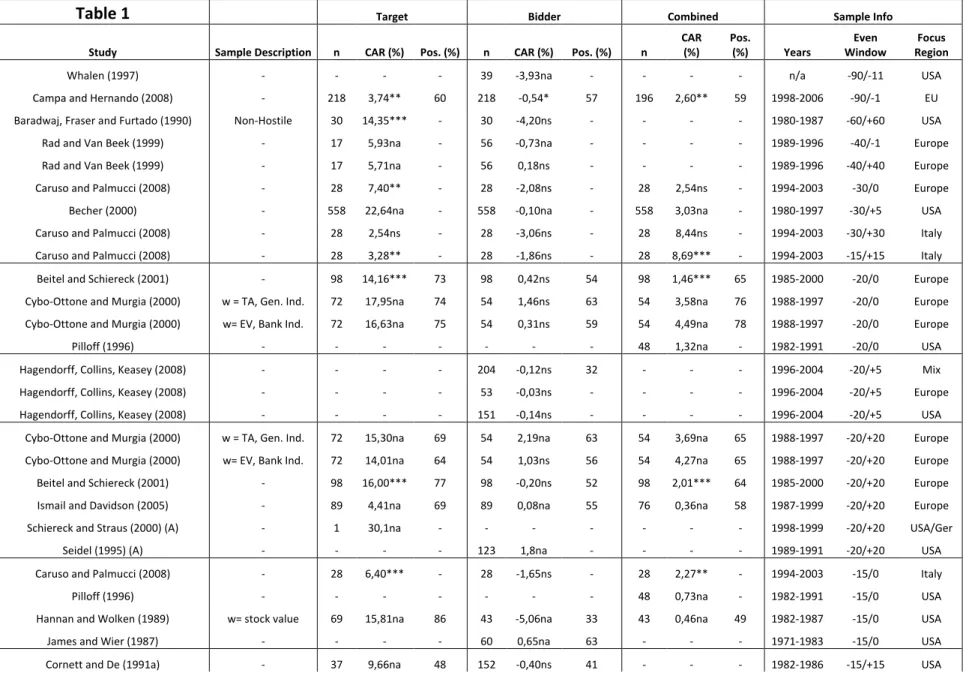
Table 1. Average and Median CARs for 3 Event Windows1
-5/+5 -1/+1 0/0
n mean med. Stdev t-stat [Min;Max] n mean med. Stdev t-stat [Min;Max] n mean med. Stdev t-stat [Min;Max] Targets (US) 4 12,7 13,5 4,26 0,69 [6,9 ; 17,1] 5 13,4 13,0 4,90 2,19 [7,8 ; 20,2] 3 9,6 11,4 5,35 0,50 [3,6 ; 13,9] Targets (EUR) 4 11,0 13,0 4,30 -0,68 [4,6 ; 13,5] 7 8,9 12,1 5,23 -1,71 [2,4 ; 14,8] 3 8,0 8,3 4,16 -0,55 [3,8 ; 12,1] Bidders (US) 6 -2,0 -2,1 1,20 -0,43 [-3,2 ; -0,3] 8 -1,5 -1,7 0,66 -1,88 [-2,4 ; -0,7] 5 -1,0 -1,4 0,80 -0,57 [-1,5 ; 0,4] Bidders (EUR) 1 -0,1 -0,1 nr nr [-0,1 ; -0,1] 7 0,1 0,0 0,73 2,00 [-0,9 ; 1,0] 3 -0,2 -0,1 0,56 0,91 [-0,8 ; 0,4] Combined (US) 4 2,2 1,0 3,51 -0,02 [-0,5 ; 7,3] 2 2,1 2,1 2,54 0,43 [0,3 ; 3,9] 0 - - - - - Combined (EUR) 3 2,3 2,5 0,74 0,04 [1,5 ; 2,9] 5 1,4 1,4 1,12 -0,32 [0,02 ; 2,7] 1 0,9 0,9 nr nr [0,9 ; 0,9]
Table 2. Summary Statistics for Graphs 1,2 and 32
Item n Mean Median Stdev AVG Window
AAR
(1 day) T-Stat
Targets (US) 39 13,11 13,53 3,99 8,28 1,58 8,79
Targets (EUR) 35 9,68 12,35 5,66 11,51 0,84 -0,29
Bidders (US) 52 -1,66 -1,50 2,14 10,35 -0,16 -2,11
Bidders (EUR) 20 0,26 0,09 0,74 11,50 0,02 5,66
Combined (US) 28 1,10 0,67 1,74 9,93 0,11 -1,09
Combined (EUR) 26 1,76 1,46 1,01 12,81 0,14 1,38
1
This table presents median CARs and Average CARs calculated for 3 event windows, the t-stat is refers to difference between the specific subsample and the overall sample (US + Europe sample) and is calculated with the general formula for unequal sample sizes with unequal variance. nr denotes that the observation is not representative.
2 This table presents median CARs and Average CARs for the observations in Graphs I,II and III. Similar to the Graphs this table only considers statistically significant previous findings. The 1 day AAR is calculated by
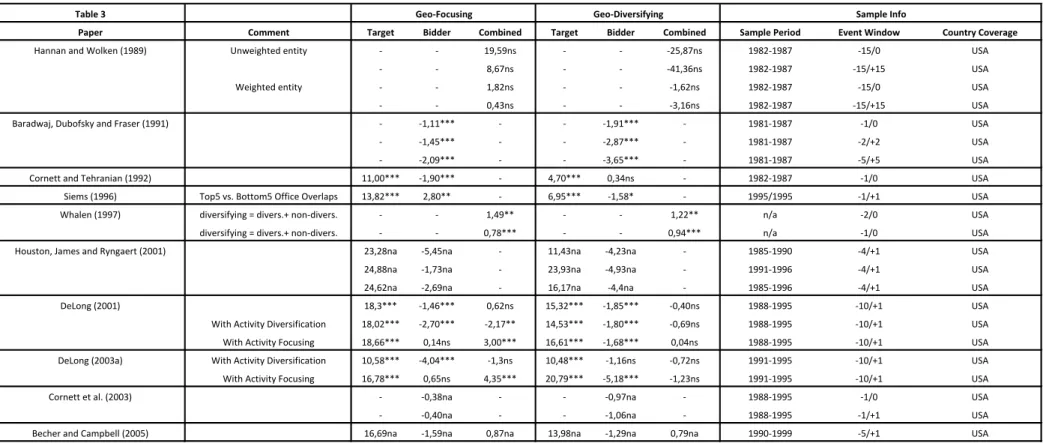
Table 3. CARs – Intrastate and Interstate Mergers
Table 3
Paper Comment Target Bidder Combined Target Bidder Combined Sample Period Event Window Country Coverage
Hannan and Wolken (1989) Unweighted entity - - 19,59ns - - -25,87ns 1982-1987 -15/0 USA
- - 8,67ns - - -41,36ns 1982-1987 -15/+15 USA
Weighted entity - - 1,82ns - - -1,62ns 1982-1987 -15/0 USA
- - 0,43ns - - -3,16ns 1982-1987 -15/+15 USA
Baradwaj, Dubofsky and Fraser (1991) - -1,11*** - - -1,91*** - 1981-1987 -1/0 USA
- -1,45*** - - -2,87*** - 1981-1987 -2/+2 USA
- -2,09*** - - -3,65*** - 1981-1987 -5/+5 USA
Cornett and Tehranian (1992) 11,00*** -1,90*** - 4,70*** 0,34ns - 1982-1987 -1/0 USA
Siems (1996) Top5 vs. Bottom5 Office Overlaps 13,82*** 2,80** - 6,95*** -1,58* - 1995/1995 -1/+1 USA
Whalen (1997) diversifying = divers.+ non-divers. - - 1,49** - - 1,22** n/a -2/0 USA
diversifying = divers.+ non-divers. - - 0,78*** - - 0,94*** n/a -1/0 USA
Houston, James and Ryngaert (2001) 23,28na -5,45na - 11,43na -4,23na - 1985-1990 -4/+1 USA
24,88na -1,73na - 23,93na -4,93na - 1991-1996 -4/+1 USA
24,62na -2,69na - 16,17na -4,4na - 1985-1996 -4/+1 USA
DeLong (2001) 18,3*** -1,46*** 0,62ns 15,32*** -1,85*** -0,40ns 1988-1995 -10/+1 USA
With Activity Diversification 18,02*** -2,70*** -2,17** 14,53*** -1,80*** -0,69ns 1988-1995 -10/+1 USA
With Activity Focusing 18,66*** 0,14ns 3,00*** 16,61*** -1,68*** 0,04ns 1988-1995 -10/+1 USA
DeLong (2003a) With Activity Diversification 10,58*** -4,04*** -1,3ns 10,48*** -1,16ns -0,72ns 1991-1995 -10/+1 USA
With Activity Focusing 16,78*** 0,65ns 4,35*** 20,79*** -5,18*** -1,23ns 1991-1995 -10/+1 USA
Cornett et al. (2003) - -0,38na - - -0,97na - 1988-1995 -1/0 USA
- -0,40na - - -1,06na - 1988-1995 -1/+1 USA
Becher and Campbell (2005) 16,69na -1,59na 0,87na 13,98na -1,29na 0,79na 1990-1999 -5/+1 USA
The information in this table refers to sub-samples or studies that focus on interstate and intrastate mergers and thus differs from the results presented in Graphs 1-3 and Table 9.
(*,**,***) denote statistical significance at 10%, 5% and 1% level. (ns) denotes insignificance and (na) denotes that observation for significance is missing.