How Do Alien Plants Fit in the
Space-Phylogeny Matrix?
Şerban Procheş1*, Félix Forest2, Sarah Jose2, Michela De Dominicis1, Syd Ramdhani3, Timothy Wiggill1
1Discipline of Geography, University of KwaZulu-Natal, Westville Campus, Private Bag X54001, Durban, South Africa,2Jodrell Laboratory, Royal Botanic Gardens, Kew, Richmond, Surrey, TW9 3DS, United Kingdom,3School of Life Sciences, University of KwaZulu-Natal, Westville Campus, Private Bag X54001, Durban, South Africa
Abstract
Recent advances in the field of plant community phylogenetics and invasion phylogenetics are mostly based on plot-level data, which do not take into consideration the spatial ar-rangement of individual plants within the plot. Here we use within-plot plant coordinates to investigate the link between the physical distance separating plants, and their phylogenetic relatedness. We look at two vegetation types (forest and grassland, similar in species rich-ness and in the proportion of alien invasive plants) in subtropical coastal KwaZulu-Natal, South Africa. The relationship between phylogenetic distance and physical distance is weak in grassland (characterised by higher plant densities and low phylogenetic diversity), and varies substantially in forest vegetation (variable plant density, higher phylogenetic di-versity). There is no significant relationship between the proportion of alien plants in the plots and the strength of the physical-phylogenetic distance relationship, suggesting that alien plants are well integrated in the local spatial-phylogenetic landscape.
Introduction
Recently, there has been a great deal of interest in plant community phylogenetics [1], and es-pecially in its main invasion biology projection, Darwin’s naturalization hypothesis. This hy-pothesis states that plants that have close indigenous relatives in a region are less likely to become naturalized, compared to those that do not [2,3,4,5,6]. The assumption behind this hy-pothesis is that common ancestry implies similar traits, potentially resulting in competitive ex-clusion, and this assumption has been recently both qualified and quantified with the
introduction and measurement of the concept of phylogenetic conservatism [7,8].
While phylogenetics adds to Darwin’s original idea by converting relatedness from a cate-gorical variable (alien plant belongs to the same genus, or not, as their closest indigenous rela-tive) into a continuous one (the phylogenetic distance between the two), to our knowledge, no attempt has been made to convert co-occurrence into a continuous variable, although the phys-ical (spatial) distance between plants seems to be an obvious choice. While much work in this
OPEN ACCESS
Citation:Procheş Ş, Forest F, Jose S, De Dominicis M, Ramdhani S, Wiggill T (2015) How Do Alien Plants Fit in the Space-Phylogeny Matrix?. PLoS ONE 10(4): e0123238. doi:10.1371/journal. pone.0123238
Academic Editor:Christian Rixen, WSL Institute for Snow and Avalanche Research SLF, SWITZERLAND
Received:October 23, 2014
Accepted:February 28, 2015
Published:April 20, 2015
Copyright:© 2015 Procheşet al. This is an open access article distributed under the terms of the Creative Commons Attribution License, which permits unrestricted use, distribution, and reproduction in any medium, provided the original author and source are credited.
Data Availability Statement:A plot-level data set, including plot coordinates, is provided asS1 Table. The phylogenetic tree used is included asS1 Fig.
Funding:This work was supported by the following sources of funding: National Research Foundation (http://www.nrf.ac.za/) Incentive Funding for Rated ResearchersŞP Postdoctoral Grant SR; Royal Botanic Gardens, Kew (http://www.kew.org/) Phylogenetic analysis FF SJ.
field was performed at large scales (tens to thousands of kilometers [9,10]), the scale which is relevant for Darwin’s naturalization hypothesis is likely to be fine (phytosociological plot size or finer). Some of the most convincing results in community phylogenetics are indeed consid-ering very small plots [11]. At large scale, alien species need to be somewhat similar to native species to share the same physical environment. Therefore, at this scale, it is likely that alien species are more related to native species than expected by random [1], thus the expectation would be a positive relationship between physical and phylogenetic distance. In the very close neighborhood, however, species interact by competing for resources. Here, to coexist, species need to be somewhat dissimilar, and it can be expected that alien species are less related to na-tive species. It can thus be expected that alien plants would show an increased phylogenetic dis-tance to plants in their neighborhoods, compared to native plants [3]. If so, this should result in a negative relationship between physical and phylogenetic distance.
In several previous studies, plant stems have been fully mapped for vegetation plots
[12,13,14], and in at least one such case [15] the relatedness between plants has been taken into consideration. Nevertheless, this article is a first attempt—a simple and static one—at under-standing how the relationship between phylogenetic distance and spatial distance is or is not af-fected by whether a plant is or not indigenous to the study region. Given the broad range of phylogenetic diversity values in plant communities [16], we considered it important to also in-clude some cross-vegetational variation. In grasslands, many species co-occur in the same stra-tum, while forests have several layers (e.g. understorey, canopy), which could impact on the nature and intensity of plant interactions [12,14]. Furthermore, there may be differences be-tween these two vegetation types in total plant abundance. Furthermore, since grass species (Poaceae, dominant in grassland) were the example used to illustrate Darwin’s naturalization hypothesis in the study that was most successful in this direction yet [6], we were also interest-ed in determining whether community phylogenetic patterns are particularly strong in vegeta-tion dominated by grasses.
Methods
Study area
The study was conducted in the Palmiet Nature Reserve (managed by the eThekwini/Durban Municipality) and on the neighboring Westville Campus of the University of KwaZulu-Natal in Durban, South Africa—an area naturally covered by a mosaic of grassy and woody vegeta-tion, but having been largely engulfed by urban development during the twentieth century. The patchy nature of the remaining natural vegetation is in itself not fundamentally distinct from the natural patchiness of the two vegetation types, but both have recently become invaded by alien shrubs, vines, and small trees [17]. The borderline between forest and grassland in the region was naturally kept sharp by fire (mostly managed by campus and conservation authori-ties), but is now locally blurred by invasive plants [18]. Ten alien plant species are targeted by control operations in the area, given their current or potential negative impact on indigenous plant assemblages and/or human activities in the area (Cardiospermum grandiflorum, Chromo-laena odorata,Ipomoea purpurea,Lantana camara,Litsea glutinosa,Melia azedarach, Pennise-tum purpureum,Ricinus communis,Solanum mauritianum,Tithonia diversifolia) [17].
Sampling
relevant vegetation patches (slope of less than 30°; see plot coordinates inS1 Table). While we noticed alien plant control teams working in neighboring areas on various occasions, we could detect no evidence of these measures having been applied in any of our plots. All plants with living above-ground parts were manually mapped in the plots by laying down a grid of string across the plot and assigning x and y values for each individual plant. This approach could re-sult in potential errors of 5 cm or less. All data collection and mapping were performed from April to July 2008. All data points were digitized using the ArcGIS software [19], thus recording the x-y coordinates for each plant. Hawth’s tools (Geospatial Modelling Environment;www. spatialecology.com) were used to calculate the physical distance between every two plant indi-viduals. Plants were identified to species level (either in the field or based on photographs), and their regional status (indigenous, alien) was recorded using relevant references [20,21,22]. As no plant collections were performed at the study sites, no permits were required.
Phylogenetic diversity
Phylogenetic distances between taxa were calculated using thephydistoption in Phylocom (4.0.1b [23]). The phylogenetic tree was reconstructed using DNA sequences from the plastid
rbcLexon (coding for the ribulose-1,5-bisphosphate carboxylase/oxygenase large subunit) for one exemplar species for each genus found in the plots. We chose to use therbcLexon as it is a widely use marker in plant phylogenetics, with very good coverage at the genus level in publicly available sequence databases, and it also presents an appropriate level of variability for the re-construction of phylogenetic relationships across the angiosperms, as needed here [24]. DNA sequences we obtained from Genbank. The phylogenetic tree was reconstructed using the par-simony criteria as implemented in PAUP [25] (heuristic search, 1000 replicates of random ad-dition sequence, and tree bisection reconnection branch swapping). Branch lengths were made ultrametric using the penalized likelihood approach as implemented in the software r8s [26] (see resulting tree inS1 Fig). Phylogenetic diversity measures were obtained using the same ap-proach as described in [27], by adding branch lengths (as measured in millions of years). Using a randomization procedure (with 10,000 replicates; see [17] for details), each plot was evaluated to determine if its phylogenetic diversity is higher (overdispersed) or lower (clustered) than ex-pected from their taxon richness.
Statistical analyses
Results
The diversity and abundance of indigenous and alien plants
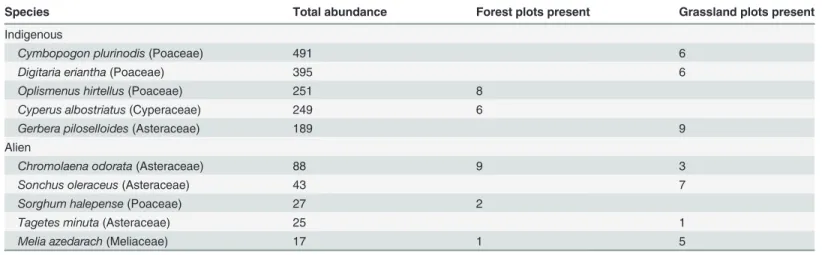
A total of 4,276 individual plants were recorded, of which 261 were aliens. These comprised 194 species assigned to 135 genera and 52 families. Alien individuals belonged to 18 species as-signed to 17 genera and nine families. Only one genus (Indigofera) contained both indigenous and alien species (not in the same plot). The majority of the most abundant indigenous plants, in both forest and grassland, were graminoids (Poaceae and Cyperaceae), although these be-longed to different species in the two vegetation types. The most abundant aliens (predomi-nantly Asteraceae), in contract, crossed vegetation boundaries (Table 1). The high turnover in indigenous trees meant that none of these were particularly abundant overall (seeS1 Table).
Forest-grassland comparisons
Phylogenetic diversity values range from 1341 Ma to 2321 Ma for forest plots and from 925 Ma to 1528 Ma for grassland plots. There was no difference between the two vegetation types in terms of species numbers per plot (F = 2.220, P>0.1), but phylogenetic diversity was higher in
forest (F = 18.969, P<0.0001); plant density was higher in grassland (F = 14.802, P = 0.001),
and there was no difference in the percentage of plants belonging to alien species (F = 2.424, P>0.1) (Fig 1). The randomization procedure identified eight of the ten grasslands plots as
clustered. None of the forest plots was clustered, but one of them had higher phylogenetic di-versity than expected by chance (over-dispersed). Removing alien species resulted in virtually the same results (one additional grassland plot became clustered), whereas removing grasses had a more substantial effect—in this case several of the otherwise clustered grassland plots were no longer clustered (but four such plots remained), and one forest plot became clustered.
Mantel tests
Mantel test r values were mostly positive (always positive and mostly significant in forest, mostly positive and seldom significant in grassland;Fig 2)—overall significantly lower in grass-land (F = 10.709; P = 0.004;Fig 1). When using generalised linear models to express Mantel test r values as a function of vegetation type and other variables, the only significant effect was that of vegetation type on the way in which species richness influenced the value of Mantel’s r (t = -2.155, P = 0.0467). The effect of the percentage of alien plants in the assemblage on
Table 1. Summary of the most abundant indigenous and alien species recorded.
Species Total abundance Forest plots present Grassland plots present
Indigenous
Cymbopogon plurinodis(Poaceae) 491 6
Digitaria eriantha(Poaceae) 395 6
Oplismenus hirtellus(Poaceae) 251 8
Cyperus albostriatus(Cyperaceae) 249 6
Gerbera piloselloides(Asteraceae) 189 9
Alien
Chromolaena odorata(Asteraceae) 88 9 3
Sonchus oleraceus(Asteraceae) 43 7
Sorghum halepense(Poaceae) 27 2
Tagetes minuta(Asteraceae) 25 1
Melia azedarach(Meliaceae) 17 1 5
Mantel’s r was not significant (t = -1.867, P = 0.0816; this was however the second lowest of the twelve P values across all the generalised linear models—including interactions). On the two-dimensional graphs visually exploring links between different plot-level variables and Mantel test r values (Fig 2), grassland sites formed separate clusters from the bulk of the forest sites, but in most cases there were a few forest plots overlapping the grassland cluster. These patterns were in no obvious way linked to those of phylogenetic clustering or over-dispersion described above. The only clear separation between grassland and forest plots was in the case of phyloge-netic diversity. Although grassland and forest values overlapped in both phylogephyloge-netic diversity and Mantel r values, grassland sites formed a fairly distinct cluster in the two-dimensional graph, with low values in both (Fig 2).
Discussion
Potential caveats
Although we used a genus-level phylogenetic tree, this is very unlikely to have affected our re-sults substantially, as congeneric species very seldom occurred in the same plot—and this was never the case with indigenous and alien congenerics. Far more important in taking our results
Fig 1. Forest-grassland comparisons.The two vegetation types are compared in terms of number of plant species, phylogenetic diversity, representation of alien species, and Mantel test r values (box-and-whisker plots).
further could be recording plant sizes, and even more so, following changes in plant size and survival in plots through time. Once time is taken into consideration, the importance of the in-digenous/alien status may emerge. Woody invaders often reduce the survival of other seedlings [32]. This is not necessarily linked to how closely related they are [33], but interactions between phylogenetic distance and plant status in the region are to be expected anyway [34]. Further-more, an assessment of the specific types of competitive interactions (“phenotypic matching”
versus“phenotypic differences”; [5]) will probably add further depth to studies of this kind once these are better understood.
Peculiarities of the system studied here, such as the remarkable patchiness of vegetation types (both natural and anthropogenic) and the high turnover of indigenous tree species in for-est, could mean that our results should not be directly extrapolated elsewhere. Nevertheless, several points are remarkable and probably not unique to the system we studied.
Birds of a feather flock together
In our study, only positive relationships between physical distance and phylogenetic distance were significant (plants that are closely related occur closer to each other), but this was less like-ly in plots with denser vegetation and where graminoid plants were dominant (Fig 2). The
Fig 2. Factors potentially influencing the results on Mantel tests in our plots.Graphs exploring links between different plot-level variables and Mantel test r values for grassland (circles) and forest (diamonds) plots. Points above the dashed line indicate significant Mantel tests.
absence of significant negative relationships is remarkable, considering that our method should allow picking up interactions across finer scales than elsewhere [34].
Grassland plots in general had fewer significant relationships than forest plots, but this may only indicate that, in this case, the tendency of related plants to track similar resources is com-pensated by competitive interactions. Darwin’s naturalisation hypothesis is supported when considering grasses alone [9], which is less likely to be shown in other plants [35]. Furthermore, grasses are among several families locally overrepresented on invasive species lists, which can result in a phylogenetic clustering effect for the vegetation as a whole [36]. The forest plots more similar to grassland in terms of Mantel r values either had lower levels of invasion (simi-lar to grassland) or actually contained high numbers of grass or sedge individuals. Grassy sys-tems as a whole have been shown to represent clustered subsets of the angiosperm assemblages present regionally [16], although within grasslands there is no clear link between niche and phylogenetics [37]. This can explain why grassland appears clustered when the random model is a grassland-forest species mix, as analysed here, but without significant Mantel test results.
The significant effect of vegetation type on the species richness-Mantel’s r relationship can be described as follows: the grassland plots, as well as those forest plots that are species rich, show low values for Matel’s r. Conversely, forest plots that are species poor (and have lower understorey cover) have high values for Mantel’s r. The high tree diversity in our study area (even in plots with overall low species diversity) means that our results are complementary to the finding of competition though spatial point-patterns analysis in species-poor Boreal forests [14]. The interactions in the herbaceous layer are complex, and the effects of competition and positive interactions [12] may cancel out and result in non-significant Mantel tests.
Aliens behave local
Most importantly for the central question of the study, we did not find a significant effect of the level of invasion (measured as the proportion of plants belonging to alien species) on the physical distance-phylogenetic distance relationship. This is surprising given the dynamic na-ture of the invasion in the studied system [38], but fits in with the lack of significant difference between indigenous and alien plants as regards a variety of morphological traits [39]. Neverthe-less, given the fact that the P value was in this case close to significance level, we cannot exclude the possibility that such effect will be detected in future studies, particularly if conducted in vegetation with different properties. In particular, a broader range of invasion level values, and species-poor tree-dominated assemblages could hold promise in detecting significant effects.
Conclusion
Our results indicate that alien plants are, at least in the systems studied here, by-and-large fit-ting well in the indigenous phylogenetic landscape—although this picture may change with the stages of invasion [40,41]. This could even be the case in our study area, given the rapid inva-sion dynamics documented at our sites [38].
Methodologically, we show that analyses measuring physical distances between plants can complement plot-level analyses that are currently widely used. In particular, these should be employed in longitudinal long-term studies with competition in mind—in which case they would provide a complex tool, especially relevant in invasion ecology.
Supporting Information
S1 Fig. The phylogenetic tree produced for the study.
S1 Table. The representation of alien and indigenous plant species across forest and grass-land plots as analysed in the study.
(XLS)
Acknowledgments
Marcel Rejmánek originally suggested the utility of a phylogenetic neighbourhood index in an invasion context; also thanked for discussion are Spencer Barrett, Nompumelelo Myende, Dave Richardson, Phil Rundel, and John Wilson. Ingolf Kühn and Desika Moodley helped with statistical analysis.
Author Contributions
Conceived and designed the experiments: SP. Performed the experiments: MdD TW. Analyzed the data: SP FF SJ SR. Contributed reagents/materials/analysis tools: SP FF SR. Wrote the paper: SP FF SR.
References
1. Cavender-Bares J, Ackerly DD, Baum DA, Bazzaz FA (2004) Phylogenetic overdispersion in Floridian oak communities. Amer Nat 163: 823–843.
2. Daehler CC (2001) Darwin’s naturalization hypothesis revisited. Amer Nat 158: 324–330.
3. Procheş Ş, Wilson JRU, Richardson DM, Rejmánek M (2008) Searching for phylogenetic pattern in bio-logical invasions. Global Ecol Biogeogr 17: 5–10.
4. Thuiller W, Gallien L, Boulangeat I, de Bello F, Münkemüller T, Roquet C, et al. (2011) Resolving Dar-win’s naturalization conundrum: a quest for evidence. Div Distrib 16: 471–475.
5. Jones EI, Nuismer SL, Gomulkiewicz R (2013) Revisiting Darwin’s conundrum reveals a twist on the re-lationship between phylogenetic distance and invasibility. Proc Nat Acad Sci USA 110: 20627–20632. doi:10.1073/pnas.1310247110PMID:24297938
6. VilàM, Rohr RP, Espinar JL, Hulme PE, Pergl J, Le Roux JL et al., (2015) Explaining the variation in
im-pacts of non-native plants on local-scale species richness: the role of phylogenetic relatedness. Glob Ecol Biogeogr 24: 139–146.
7. Prinzing A, Durka W, Klotz S, Brandl R (2001) The niche of higher plants: evidence for phylogenetic conservatism. Proc R Soc Lond B Biol Sc 268: 1–7.
8. Prinzing A, Reiffers R, Braakhekke WG, Hennekens SM, Tackenberg O, Ozinga WA, et al. (2008) Less lineages—more trait variation: phylogenetically clustered plant communities are functionally more di-verse. Ecol Lett 11: 809–819. doi:10.1111/j.1461-0248.2008.01189.xPMID:18445034
9. Strauss SY, Webb CO, Salamin N (2006) Exotic taxa less related to native species are more invasive. Proc Nat Acad Sci USA 103: 5841–5845. PMID:16581902
10. Escobedo VM, Aranda JE, Castro SA (2011) Darwin's naturalization hypothesis assessed in the alien flora of continental Chile. Rev Chil Hist Nat 84: 543–552.
11. Slingsby JA, Verboom GA (2006) Phylogenetic relatedness limits co-occurrence at fine spatial scales: Evidence from the schoenoid sedges (Cyperaceae: Schoeneae) of the Cape Floristic Region, South Af-rica. Amer Nat 168: 14–27.
12. Eccles N, Esler KJ, Cowling RM (1999) Spatial pattern analysis in Namaqualand desert plant communi-ties: evidence for general positive interactions. Plant Ecol 142: 71–85.
13. Dale MRT, Powell RD (2001) A new method for characterizing point patterns in plant ecology. J Veg Sci 12: 597–608.
14. Gray L, He F-L (2009) Spatial point-pattern analysis for detecting density-dependent competition in a boreal chronosequence of Alberta. Forest Ecol Manag 259: 98–106.
15. Shen G-C, Wiegand T, Mi X-C, He F-L (2013) Quantifying spatial phylogenetic structures of fully stem-mapped plant communities. Meth Ecol Evol 4: 1132–1141.
17. eThekwini Municipality (2010) Framework strategy for the control of invasive alien species in eThekwini Municipality, South Africa. Environmental Management Department, eThekwini Municipality, Durban, South Africa.
18. Zachariades C, Goodall JM (2000) Distribution, impact and management ofChromolaena odoratain southern Africa. In Zachariades C, Muniappen R, Strathie LW, editors. Proceedings of the Fifth Interna-tional Workshop on Biological Control and Management ofChromolaena odorata, Durban, South Af-rica, 23–25 October 2000. South Africa, ARC-Plant Protection Research Institute.
19. Environmental Systems Research Institute (2008) ArcGIS version 9.3, ESRI, Redlands.
20. Germishuizen G, Meyer NL (2003) Plants of southern Africa: an annotated checklist. National Botani-cal Institute, Pretoria.
21. Pooley E (2003) The complete field guide to trees of Natal Zululand & Transkei. Natal Flora Publica-tions Trust, Durban.
22. Pooley E (2005) A aield fuide to wild flowers KwaZulu-Natal and the eastern region. Natal Flora Publi-cations Trust, Durban.
23. Webb CO, Ackerly DD, Kembel SW (2008) Phylocom: software for the analysis of phylogenetic com-munity structure and trait evolution. Bioinformatics 24: 2098–2100. doi:10.1093/bioinformatics/btn358 PMID:18678590
24. Soltis DE, Soltis PS (1998) Choosing an approach and an appropriate gene for phylogenetic analysis. In Soltis DE, Soltis PS, Doyle JJ, editors. Molecular systematics of plants II: DNA sequencing. New York: Kluwer Academic Publishers. pp. 1–41.
25. Swofford DL (2002) PAUP*. Phylogenetic Analysis Using Parsimony (*and other methods) 4.0b 10 ed. Sinaur Associates, Sunderland, Massachusetts.
26. Sanderson MJ (2002) Estimating absolute rates of molecular evolution and divergence times: A penal-ized likelihood approach. Mol Biol Evol 19: 101–109. PMID:11752195
27. Forest F, Grenyer R, Rouget M, Davies TJ, Cowling RM, Faith DP, et al. (2007) Preserving the evolu-tionary potential of floras in biodiversity hotspots. Nature 445: 757–760. PMID:17301791
28. Legendre P, Fortin M-J (2010) Comparison of the Mantel test and alternative approaches for detecting complex multivariate relationships in the spatial analysis of genetic data. Mol Ecol Res 10: 831–844. doi:10.1111/j.1755-0998.2010.02866.xPMID:21565094
29. Diniz-Filho JAF, Soares TN, Lima JS, Dobrovolski R, Landeiro VL, de Campos Telles MP, et al. (2013) Mantel test in population genetics. Genet Mol Biol 36: 475–485. doi:
10.1590/S1415-47572013000400002PMID:24385847
30. R Development Core Team (2010) R: A language and environment for statistical computing, R Founda-tion for Statistical Computing, Vienna. Available:http://www.R-project.org. Accessed 1 April 2010.
31. Øksanen J, Kindt R, Legendre P, O’Hara B, Simpson GL, Solymos P, et al.(2009) Vegan: Community
Ecology Package (R package version 1.15–4). Available:http://cran.r-project.org/package = vegan. Ac-cessed 29 July 2011.
32. Greene BT, Blossey B (2012) Lost in the weeds:Ligustrum sinensereduces native plant growth and survival. Biol Invasions 14: 139–150.
33. Dostál P (2011) Plant competitive interactions and invasiveness: searching for the effects of phyloge-netic relatedness and origin on competition intensity. Amer Nat 177: 655–667. doi:10.1086/659060 PMID:21508611
34. Davies KF, Cavender-Bares J, Deacon N (2011) Native communities determine the identity of exotic in-vaders even at scales at which communities are unsaturated. Div Distrib 17: 35–42.
35. Duncan RP, Williams PA (2002) Darwin’s naturalization hypothesis challenged. Nature 417: 608–609. PMID:12050652
36. Carvallo GO, Teillier S, Castro SA, Figueroa JA (2014) The phylogenetic properties of native- and exot-ic-dominated plant communities. Austr Ecol 39: 304–312.
37. Silvertown J, McConway K, Gowing D, Dodd M, Fay MF, Joseph JA, et al. (2006) Absence of phyloge-netic signal in the niche structure of meadow plant communities. Proc R Soc B Biol Sc 273: 39–44.
38. Padayachi Y, Procheş Ş, Ramsay LF (2014) Beetle assemblages of indigenous and alien decomposing fruit in subtropical Durban, South Africa. Arthropod-Plant Inte 8: 135–142.
39. Pyšek P, Richardson DM (2007) Traits associated with invasiveness in alien plants: where do we stand? Biol Invasions 193: 97–125.
40. Dawson W, Burslem DFRP, Hulme PE (2009) Factors explaining alien plant invasion success in a tropi-cal ecosystem differ at each stage of invasion J Ecol 97: 657–665.