Mussels at Small Spatial Scales: The Interaction of
Facilitation and Competition
Johan Erlandsson1*, Christopher D. McQuaid2, Martin Sko¨ld3
1ARONIA Coastal Zone Research Team, A˚ bo Akademi University/Novia University of Applied Sciences, Ekena¨s, Finland,2Coastal Research Group, Department of Zoology and Entomology, Rhodes University, Grahamstown, South Africa,3Department of Mathematics, Stockholm University, Stockholm, Sweden
Abstract
Ecological theory predicts that two species with similar requirements will fail to show long-term co-existence in situations where shared resources are limiting, especially at spatial scales that are small relative to the size of the organisms. Two species of intertidal mussels, the indigenousPerna pernaand the invasiveMytilus galloprovincialis, form mixed beds on the south coast of South Africa in a situation that has been stable for several generations of these species, even though these populations are often limited by the availability of space. We examined the spatial structure of these species where they co-exist at small spatial scales in the absence of apparent environmental heterogeneity at two sites, testing: whether conspecific aggregation of mussels can occur (using spatial Monte-Carlo tests); the degree of patchiness (using Korcak B patchiness exponent), and whether there was a relationship between percent cover and patchiness. We found that under certain circumstances there is non-random conspecific aggregation, but that in other circumstances there may be random distribution (i.e. the two species are mixed), so that spatial patterns are context-dependent. The relative cover of the species differed between sites, and within each site, the species with higher cover showed low Korcak B values (indicating low patchiness, i.e. the existence of fewer, larger patches), while the less abundant species showed the reverse, i.e. high patchiness. This relationship did not hold for either species within sites. We conclude that co-existence between these mussels is possible, even at small spatial scales because each species is an ecological engineer and, while they have been shown to compete for space, this is preceded by initial facilitation. We suggest that a patchy pattern of co-existence is possible because of a balance between direct (competitive) and indirect (facilitative) interactions.
Citation:Erlandsson J, McQuaid CD, Sko¨ld M (2011) Patchiness and Co-Existence of Indigenous and Invasive Mussels at Small Spatial Scales: The Interaction of Facilitation and Competition. PLoS ONE 6(11): e26958. doi:10.1371/journal.pone.0026958
Editor:Simon Thrush, National Institute of Water & Atmospheric Research, New Zealand
ReceivedMay 4, 2011;AcceptedOctober 7, 2011;PublishedNovember 22, 2011
Copyright:ß2011 Erlandsson et al. This is an open-access article distributed under the terms of the Creative Commons Attribution License, which permits unrestricted use, distribution, and reproduction in any medium, provided the original author and source are credited.
Funding:This study was funded by the Hellmuth Hertz Foundation, The Royal Swedish Academy of Sciences (www.kva.se), Stint Foundation, Sweden, and Rhodes University (www.ru.ac.za), South Africa (to JE). This work is also based upon research supported by the South African Research Chairs Initiative of the Department of Science and Technology and the National Research Foundation (to CM). The funders had no role in study design, data collection and analysis, decision to publish, or preparation of the manuscript.
Competing Interests:The authors have declared that no competing interests exist.
* E-mail: jerlands@abo.fi
Introduction
General ecological theory predicts that stable coexistence of two or more similar species will be unusual and dependent on resource availability or predation [1,2,3]. Coexistence of competing species at larger local scales, that is scales beyond those at which species directly interact, is often explained by environmental heterogeneity, or by species interactions generating spatially segregated distribu-tions even in the absence of environmental heterogeneity [1,3,4,5,6,7]. Thus, at spatial scales that are small relative to body size, it is considered unlikely that two competing species can coexist, unless the inferior competitor is a superior colonizer of empty patches or there is spatial variability in their competitive abilities so that the superior competitor is at a disadvantage in at least some part of its distribution [2,6,8]. It is even less likely that two related species are able to coexist if one is an introduced species and the other indigenous, since the introduced species is often capable of becoming invasive precisely because it is a superior competitor [2]. Exploitative competition results in indirect negative interactions, while interference competition involves direct negative interactions,
e.g. territoriality, overgrowth or chemical competition. In classical competition theory, there are no benefits, only costs, for species engaged in interference competition. In nature, however, interfer-ence between interacting species can be both costly and beneficial for an inferior resource exploiter, e.g. the production of chemicals as defence involves a cost, while predation on the eggs and larvae of the competitor is beneficial in terms of growth etc. [2].
been suggested that introduced alien species are more likely to be successful if they are dissimilar from the dominant indigenous species, for example if they belong to different genera [14,15], precisely because they will have less similar resource requirements. However, in the case of competition for primary space (as opposed to secondary space) it is difficult to see how the resource can be differentiated and it is unclear that taxonomic similarity will have a strong effect on invasive success. For example, the introduced Mediterranean mussel Mytilus galloprovincialis (Lamarck 1819) has replaced the indigenous musselAulacomya ater(Chemn.) on the west coast of South Africa [16] but competes for space equally aggressively with congenericM. trossulus(Gould 1850), on the west coast of the USA, excluding it from the southern end of its distribution [17,18].
In South AfricaM. galloprovincialis now poses a threat on the south coast to the indigenous mussel Perna perna (Linnaeus 1758) [19], which has generally lower fecundity, recruitment and growth rates than other mytilid mussels [20,21]. At present, the abundance of M. galloprovincialis on the south coast is highly variable and site-specific [22]. At sites whereM. galloprovincialisis abundant, it dominates the upper mussel zone, and P. pernathe lower zone, with an overlap in distribution (co-existence at cm-m scales) in the mid zone [19]. Being different species, these mussels have different tolerances to wave action and desiccation, and in the upper zone they exhibit different post-settlement mortality of recent recruits, factors that partially explain these patterns of zonation [23,24,25,26]. Thus, the two species exhibit partial habitat partitioning across a gradient of environmental conditions, exhibited as differences in zonation. Although habitat partitioning through differences in physiological tolerances can be interpreted as a consequence of past competition, this does not apply to this situation where one of the species has been recently introduced to the system, rather habitat segregation reflects both direct and indirect interactions between the two. Direct interference competition betweenP. pernaandM. galloprovincialisoccurs through different growth rates, so that they can usurp each other’s space [24,27]. Exploitative competition between mussels includes different settlement and recruitment intensity [25] that results in different recolonization rates after disturbance.M. galloprovincialisre-colonizes free space faster than P. perna in the sympatric mid zone after disturbance by severe storm waves [11]. This accords with the suggestion of Amarasekare [2] that disturbance or human exploitation can help invasive species to dominate, at least temporarily.
In addition to competition for space, there is indirect evidence that these mussels are likely to compete for food. Depletion of food in the water column seems unlikely, but mussel growth rates can vary in response to very small scale (10 s cm) changes in food availability [28], while van de Koppel et al. [3] have shown that self-organized spatial structure inM. edulisis driven partly by food depletion, and Bertness and Grosholz [29] identify one of the disadvantages for bivalves of living in aggregations as reduced growth through intraspecific competition for food. As we can imagine no mechanism for partitioning food between our two species, we assume they exhibit interspecific competition for this resource. Certainly, they have indistinguishable stable isotope (dC13
and d15
) signatures [30], while upwelling, which increases local food availability, strongly affects their abundances and size distribution [31].
AlthoughM. galloprovincialisandP. perna exhibit partial habitat segregation, and have similar requirements for food and space, they also exhibit co-existence in the mid-mussel zone that seems to be stable in the mid-term i.e. over decades or multiple generations [19]. Facilitation or positive interactions between species [32] is
believed to be less common between closely related invasive and indigenous species than between taxonomically distinct organisms [14], yetP. pernaandM. galloprovincialisexhibit not just competitive interactions, they also facilitate each other’s survival in at least three ways. This is essentially because they are both ecosystem engineers so that each species can moderate abiotic conditions enough to allow survival of the other in areas where the second species would otherwise be excluded. Firstly,P. pernararely settles on bare rock and its recruitment rates are facilitated by the much faster recolonisation of bare rock surfaces ofM. galloprovincialis in the mid zone following disturbances such as storms [11]. Secondly,
M. galloprovincialis survives wave action much better on the low shore when it is intermingled experimentally withP. pernathan in monospecific plots [23,24]. Thirdly,P. pernasurvives desiccation in the mid-mussel zone better when mingled experimentally with the more tolerantM. galloprovincialis[27]. Thus, both competition and facilitation occur between these two mussel species.
Consequently, this system allows us to examine co-existence at small spatial scales between two species competing for the same resources (food and space) in the absence of apparent environ-mental heterogeneity. If interspecific competition is of over-riding importance, we would expect some degree of conspecific aggregation due to small-scale competitive exclusion. However, because the two species can facilitate each other’s survival on parts of the shore where they are otherwise vulnerable to either desiccation (P. perna) or wave action (M. galloprovincialis), we anticipate that individuals of each species would be likely to exist close to individuals of the other species, i.e. being more mixed (randomly dispersed), in the mid zone. Here we examine the small-scale spatial structure (at cm small-scales) of these two mussels where they co-exist in the mid-mussel zone. In particular, we examine the link between abundance (percent cover) and the degree of patchiness of each species to estimate whether numerical dominance of a species is an important predictor of patchiness, and also ask whether mussels in mixed beds are significantly aggregated with conspecifics.
Methods
Study area and sampling design
Using 3 photographs selected randomly from the 30 taken at one of the sub-sites from each site, we tested the hypothesis of non-random small-scale aggregation, with the null hypothesis being random distribution (see below). Discrimination between the two mussel species in the photographs was based mainly on shell colour, M. galloprovincialis having darker and blue colours (sometimes black) andP. pernahaving brown (usually light brown) and more purple colours [34]. Where there was uncertainty, we used more subtle shell colour differences (e.g. narrow blue lines indicateM. galloprovincialis, while reddish tints characteriseP. perna) described by Bownes [35] and Bownes et al. [36]. In addition, the percent cover of each mussel species was estimated in a 10610 cm2 quadrat in each photograph to examine the relationship between cover and patchiness. Cover was estimated visually using a transparent frame of 16 small quadrats (each constituting 6.25%) put over the larger quadrat within each photo.
Analyses and modelling
Different methods and techniques of estimating spatial hetero-geneity and patchiness exist, including geostatistical techniques such as spatial autocorrelation, variograms/semivariograms and fractal analysis/dimension, that have also been used in intertidal systems [37,38,39,40]. However, in the present study we needed an index that would measure patch sizes of each species directly while also estimating the size distribution of patches over different continuous small scales (in contrast to e.g. variance/mean ratio). The Korcak B patchiness exponent is such an index and therefore related to the concept of fractal dimension [41,42]. B is an estimate of the slope of the logarithmic relationship between the number of patches$specific threshold sizes and the different threshold sizes of those patches (here estimated as the number of individuals in a patch; see below). Thus, the number of patches$ the specific predetermined sizes is plotted on a log-linear graph [41,42,43]. The Korcak B patchiness exponent was originally used for describing the distribution/numbers of different sized islands (different areas) in an archipelago, but has since been used for different purposes although this has been rare in ecology [41]. It is also a useful index for the estimation of habitat fragmentation
[42,43] since it takes into account two of the three criteria for this process, i.e. the higher number of patches produced and the division into smaller patches [44]. The greater isolation/ separation between patches observed during the habitat fragmen-tation process is not estimated by this technique as it is with, for example, the nearest-neighbour analysis, but the nearest-neigh-bour analysis does not estimate or take into account the higher number of smaller patches produced. Our second technique, Monte-Carlo testing, used to assess deviation from random patterns is, together with other random permutation tests, commonly used in ecological studies [45]. What is special about the technique used in the present study is the application of a spatially explicit Monte-Carlo technique in a user-friendly way.
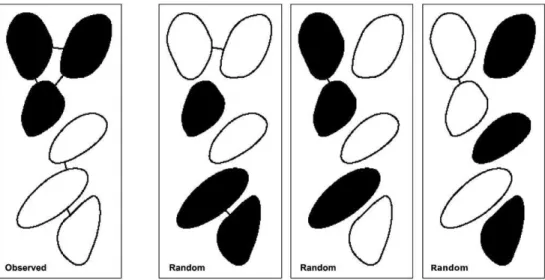
Deviation from small-scale random distributions. Here, our aim was to test the hypothesis that individuals of the two mussel species were non-randomly aggregated with their conspecifics at small scales in the 10610 cm2 quadrats in each of the 3 photographs at one sub-site from each site. As a measure of the degree of conspecific aggregation, we counted the total number of pairs of neighbouring mussels that belonged to the same species within each quadrat of the photos (the total density of mussels in these 6 photos ranged from 40 to 122). We also took into account the mussels just outside each quadrat, so that all neighbours to mussels inside the quadrat were detected, in order to avoid edge effects. Two mussels were judged to form a neighbouring pair if they were connected by shell contact or separated by a distance equal to or less than half of the width of a mussel individual without their boundaries being intersected by another mussel. This allowed for possible shell contact when the shell valves were open and possible byssus contact. The tests were performed conditionally on the observed number of each species and their spatial configuration with species labels blinded. Under these circumstances, random samples of configurations can easily be generated by randomly assigning species to the mussels while keeping their relative numbers fixed (see Fig. 1). For each photo, a Monte-Carlo based p-value for the hypothesis under study was computed as the proportion of a large number of generated random species configurations with the degree of conspecific aggregation greater than the observed. For the Monte-Carlo tests,
Figure 1. Simplified illustration of Monte-Carlo approach.Hypothetical configuration (observed; randomized) showing aggregations of two species (black/white). Neighbouring conspecifics are joined by arcs. Our measure of the degree of conspecific aggregation equals the number of arcs in the frame (i.e. 5 in frame 1). Frames 2-4: Sample random reconfigurations of the species labels, the number of arcs being 2, 1 and 1.
the sample unit was the individual mussel, so that sample size was the number of mussels in each quadrat. To allow a more robust test, we subsequently combined the probabilities derived from the 3 photographs for each site using Fisher’s method [46], providing meta-analyses of the results.
Patchiness structure of aggregations. To describe the spatial structure of the aggregations (degree of patchiness) of the two mussel species in the mid zone, we used the Korcak patchiness exponent B [41]. In each of 10 photographs at each sub-site we counted the number of patches or clumps (N) with the number of mussel individuals (10 different photos for each species) larger or equal ($) to i where i is equal to 1, 2, 4, 8, and 16 individuals. An aggregation was defined as mussels of each species that were connected by shell contact or a distance equal to or less than half of the width of a mussel individual between mussels. The Korcak patchiness exponent B is estimated from:
N(i)~constant|i-B ð1Þ
or
logN(i)~log(constant)-Blogi ð2Þ
B is estimated from the slope of the log-log relationship between N and i. Higher B estimates indicate smaller aggregations of individuals and more isolated mussels (i.e. higher patchiness), while lower B estimates mean that mussels are distributed in larger clumps with more individuals in each clump (i.e. lower patchiness). Three-factor ANOVA (species as a fixed factor; site as a random factor; subsite as a random factor nested in site) was done for B aggregation estimates and for percent cover. Correlation analysis between percent cover and B of each species and site (and pooled data) was also conducted.
Results
Deviation from random distributions
The Monte-Carlo test of random distribution of species gave p-values of 0.00001, 0.013, and 0.11 respectively for the three photos at Look-out Beach and values of 0.013, 0.053 and 0.22 at Robberg. While not all of these p-values showed significant deviation (i.e. p,0.05) from randomness, they may be combined site-wise using Fisher’s method [46], which gives a p-value of 0.0001 for Look-out Beach and 0.006 at Robberg. Hence, our test supports the interpretation that non-random aggregations can occur at both sites. However, this can be seen as a pilot study as we
can neither accept nor reject the possibility that non-random aggregations exist over the whole spatial scale of these sites, since only a very small subset of this was examined. Thus, under certain circumstances there is non-random conspecific aggregation ofP. pernaand M. galloprovincialis (i.e. context-dependent pattern), but random distribution (i.e. the two species are mixed at small scales) also occurs, meaning that neither conspecific or random aggregation is the rule at these sites. Since we did not design the study to analyse the circumstances or contexts that promote either random or aggregated patterns, there was no reason to analyse further samples. Instead we focus on describing the degree of patchiness of each species separately at each site, and whether there was any relationship between patchiness and percent cover of each species.
Patchiness structure of aggregations
At both sub-sites in Look-out Beach there was significantly higher cover ofP. pernathan M. galloprovincialis, while patchiness was significantly lower forP. perna(Korcak B estimates closer to 0) than forM. galloprovincialis(B closer to 1; Table 1 & 2; Fig. 2; SNK-post hoc test, P,0.05). In contrast, at both sub-sites in Robberg, there was significantly higher cover ofM. galloprovincialis than P. perna, with patchiness significantly lower forM. galloprovincialisthan for P. perna at this site (see Table 1, 2; Fig. 2; SNK-post hoc test, P,0.05). The two 3-factor nested ANOVAs of Korcak B index and percent cover of mussels respectively showed slightly heterogeneous variances (Cochran’s test: SQRT (Korcak B+1) transformed data, C = 0.3016, Ccrit= 0.2926, p,0.05; percent cover untransformed data, C = 0.3004, Ccrit= 0.2926, p,0.05). However, slightly heterogeneous variances are not a problem when samples are balanced and when the numbers of different treatment groups and samples are relatively large, usually more than 5 treatments and n larger than 6, as ANOVA is robust enough for this [45,47]. In the present study the numbers of treatment groups and samples were 8 and 10 respectively.
Thus, at each site the species with the highest cover had the lowest B estimates (patchiness low), indicating that it showed fewer, larger patches, while the species with the lowest cover had high B estimates (patchiness high) indicating that its distribution consisted of more, smaller patches. However, the correspondence between percent cover and patchiness of mussels between sites was not maintained within sites for either species, since there was no significant negative correlation between percent cover and Korcak B estimates of each species at each site. (such a correlation would be very hard to detect since the range of observed cover was very
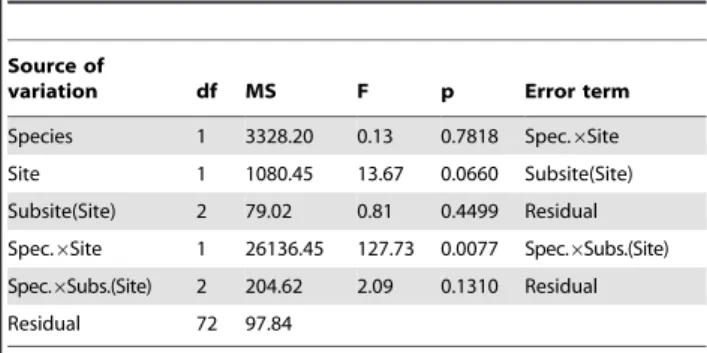
Table 2.Three-factor nested ANOVA (Sub-site nested in Site; Species a fixed factor) of percent cover of mussels in the mid zone.
Source of
variation df MS F p Error term
Species 1 3328.20 0.13 0.7818 Spec.6Site
Site 1 1080.45 13.67 0.0660 Subsite(Site)
Subsite(Site) 2 79.02 0.81 0.4499 Residual
Spec.6Site 1 26136.45 127.73 0.0077 Spec.6Subs.(Site)
Spec.6Subs.(Site) 2 204.62 2.09 0.1310 Residual
Residual 72 97.84
Analysis of non-transformed data as transformed data did not make variances more homogeneous.
doi:10.1371/journal.pone.0026958.t002 Table 1.Three-factor nested ANOVA (Sub-site nested in Site;
Species a fixed factor) of Korcak B patchiness exponent of mussels in the mid zone.
Source of variation df MS F p Error term
Species 1 0.1600 0.12 0.7839 Spec.6Site
Site 1 0.0055 0.15 0.7377 Subsite(Site)
Subsite(Site) 2 0.0373 9.32 0.0003 Residual
Spec.6Site 1 1.2823 49.73 0.0195 Spec.6Subs.(Site)
Spec.6Subs.(Site) 2 0.0258 6.43 0.0027 Residual
Residual 72 0.0040
narrow within subsites), although correlations were significant if species and/or sites were pooled (Fig. 3; both species combined at: Look-Out 1: t =25.91, p = 0.00001, r =20.81; Look-Out 2: t =21.96, p = 0.06, r =20.42; Robberg 1: t =27.63, p = 0.0000001, r =20.87; Robberg 2: t =215.48, p = 0.0000001, r =20.96; Look-Out 1+2: t =25.03, p = 0.00001, r =20.63; Robberg 1+2: t =213.42, p = 0.0000001, r =20.91). All Korcak B estimates (i.e. the slope of the log-log regression between N and i) showed r2-values ranging between 0.64 and 0.99 (mean = 0.89, SD = 0.08) indicating that log-log linear regressions between N and i (the number of patches with i individuals in) were very good.
Discussion
Monospecific populations of soft-bottom blue mussels are known to show strong self-organisation in both the laboratory and the field [7]. Here we show that both non-random and random distribution of two mussel species (i.e. conspecific or mixed aggregation) can occur at scales that are small relative to body size under field conditions on rocky shores, and that patchiness is related to the numerical dominance of each species. This is important, as it is linked to the long-term co-existence of two ecologically similar species in situations where
at least one resource (space) is limiting. In this system co-existence could be explained by the balance between facilitation and competition between the two species. If populations of these species are shaped primarily by interspecific competition, then we would expect conspecific aggregation, while facilitation would promote mixed (random) aggregation. In the event we observed both mixed and conspecific aggregation, which presumably reflects that in the mid-mussel zone both compe-tition and facilitation occur [27].
There is overlapping habitat use by our two study species, i.e. they co-exist in the mid-mussel zone with each being excluded
from one part of the shore by environmental stress or a combination of competition and environmental stress. M. galloprovincialishas weaker byssal attachment [48] and is excluded from the low shore by its susceptibility to wave action as well as competitive exclusion byP. perna[24].P.pernais excluded from the upper mussel zone by recruitment failure [25] and its vulnerability to desiccation [27]. ThusP.pernais excluded from the high mussel zone andM. galloprovincialisfrom the low mussel zone largely by pre- and post-recruitment processes respectively [49].
Here, we showed that the two species can exhibit both conspecific and mixed aggregation (i.e. context-dependent
gation) in the mid-mussel zone. Conspecific aggregation can be viewed as a consequence of interspecific competition (individuals are eliminated by competitors) or as active aggregation that could be established at different ontogenetic stages. Mussels have external fertilisation with dispersive planktonic larvae, and there is evidence for differences between the two mussels in spawning seasonality [50]. When coupled with seasonality in the ocean currents that disperse larvae, this can affect dispersal and population connectivity [51], and could result in conspecific aggregation as conspecific larvae will tend to arrive on the shore together. Secondly, larvae of these species show changes in their responsiveness to the presence of other recruits as they age. Field experiments indicate that larvae are attracted to biofilm as they settle out of the plankton, while older recruits (late plantigrades) are attracted to the combination of biofilm and other recruits [52]. This indicates that settler behaviour may be flexible so that conspecific attraction at the settlement stage is a possibility. Recruits (i.e. individuals that have settled and undergone metamorphosis) tend to move and clump together faster than adults (Porri et al. unpubl. data), while among adults, M. galloprovincialisis significantly more mobile than P. perna[53]. In the laboratory, medium-large sized (4–10 mm) recruits ofP. perna
show preferential movement towards conspecific adults (unpubl. data), but we have no information on how individual movement could allow conspecific aggregation under field conditions. A possibility unrelated to mussel behaviour is predator preference for one of the two species, although there is evidence that top-down control can eliminate rather than promote spatial structure [54]. Predators have significant effects on recruits of these species under experimental field conditions [55], but there is no evidence that they exhibit preferences between the two species at such sizes. The situation is different for adults as oystercatchers (Haematopus moquini) selectively feed their chicks withM. galloprovincialis where both mussel species are available [56], but it seems unlikely that this could produce the observed patterns. Although secondary settlers of mussels show attraction to other mussel recruits [52], we have no evidence that this attraction is species-specific. Overall it seems likely that conspecific aggregation results from a combina-tion of such attraccombina-tion plus synchronised settlement of monospe-cific clouds of larvae (although more extensive studies need to confirm this pattern).
Analyses of patchiness in the mid zone revealed that patchiness and numerical dominance can be linked depending on scale. The two are related among sites and species, so that the numerically dominant species at a given site had lower patchiness, but this effect did not occur within species and site (i.e. no significant correlation between percent cover and Korcak B estimates of each species at each site). This may simply reflect the probability of coalescence of small patches into fewer larger patches as abundance increases. In a similar way the probability of mussel removal by storms in the mid zone at the same sites is related to the numerical dominance of each species [11] conforming to the compensatory mortality model described by Connell [57]. We speculate that the negative relationship between patchiness and percent mussel cover would differ depending on the balance between competition and facilitation. With facilitation alone, there would be no competitive exclusion and a weak effect of cover on B (i.e. no significant relationship), while, with no facilitation, competition would result in exclusion of the weaker competitor and a strong negative effect of total mussel cover on B for that species as its population becomes more fragmented by more intense competition. Indeed, there is a trend (Fig. 3) that the slope of the curve at Robberg (total mussel cover ca 85–100%) is steeper than at Look-Out Beach where total mussel cover was
lower (ca 70–85%), and competition for space presumably weaker.
There are a number of interactions between the two species that can be considered as facilitation, as defined by Bruno et al. [32]. For example,P. pernais extremely slow to recolonise free primary space after experimental removal [58] and its settlement is facilitated by the presence of M. galloprovincialis, which recolonises free space 2–3 times faster following disturbance in the mid zone [11]. Furthermore, field experiments have shown that in the mid- mussel zoneP. pernais weakly facilitated byM. galloprovincialisas adultP. pernasurvive better when mixed withM. galloprovincialis, indicating that P. perna is to some extent also protected from desiccation by the physical matrix provided by the more desiccation-tolerant M. galloprovincialis [27]. This is presumably related to the greater susceptibility of P. perna to hypoxia; during aerial exposure it is obliged to gape the shell to allow oxygen uptake, making it more vulnerable to desiccation [26].
Similarly, on the low shore the survival ofM. galloprovincialisis initially facilitated byP. perna. M. galloprovincialis in experimental monospecific patches on wave-exposed shores show much higher mortality than when mixed withP. perna, although it is ultimately ousted by interference competition for space [24]. Thus each species is partially facilitated by the other in zones where it is physically challenged through amelioration of abiotic stress, though this does not prevent partial habitat segregation. M. galloprovincialisappears to have two competitive advantages in the mid zone: firstly, faster recolonisation of free space [11], and secondly P.perna exhibits intraspecific competition in this zone [27]. However, M. galloprovincialisalso ameliorates desiccation of
P.perna, allowing it to survive there, so that the patchy pattern observed in the mid zone may be explained by a combination of different factors.
The observation that co-existence, even at small spatial scales (cm-m scales), is possible between two species that compete for at least one and probably two resources (space and food) challenges existing theory, especially as one is indigenous and the other invasive. Importantly, this is possible because the two species both compete and facilitate each other’s survival [27]. This occurs because both species are ecosystem engineers that modify the physical environment, ameliorating conditions for their competitor, and is in contrast to Branch’s [10] suggestion that
Figure 4. Summary of suggested explanations of how two negative effects interact to produce a positive effect. The amelioration of abiotic stresses by the more tolerant species constitutes an indirect positive effect (two negative effects making a positive one) on the less tolerant competitor. In the case of wave action, this is an indirect effect of P. perna on M. galloprovincialis. In the case of desiccation stress, the reverse is true. Direct interactions between the two are negative.
competitive exclusion on rocky shores is likely when two species compete for space. Co-existence at these small spatial scales is possible through the balance between direct (competitive) negative interactions and indirect (facilitative) interactions that are positive in sum, because they combine two negative effects (Fig. 4).
Acknowledgments
We thank Sarah Bownes and Purba Pal for help in the field. We are also grateful to two anonymous reviewers for improving the manuscript.
Author Contributions
Conceived and designed the experiments: JE CM. Performed the experiments: JE CM. Analyzed the data: JE MS. Contributed reagents/ materials/analysis tools: JE MS. Wrote the paper: JE CM MS. Analysis/ modeling using Monte-Carlo tests: MS. Analyses using Korcak B exponent: JE.
References
1. Holt RD (1984) Spatial heterogeneity, indirect interactions, and the coexistence of prey species. Am Nat 124: 377–406.
2. Amarasekare P (2002) Interference competition and species coexistence. Proc R Soc Lond B 269: 2541–2550.
3. van de Koppel J, Rietkerk M, Dankers N, Herman PMJ (2005) Scale-dependent feedback and regular spatial patterns in young mussel beds. Am Nat 165(3): E66–E77.
4. Chesson PL, Warner RR (1981) Environmental variability promotes coexistence in lottery competitive systems. Am Nat 117(6): 923–943.
5. Hassell MP, Comins HN, May RM (1994) Species coexistence and self organizing spatial dynamics. Nature 370: 290–292.
6. Amarasekare P, Nisbet R (2001) Spatial heterogeneity, source-sink dynamics and the local coexistence of competing species. Am Nat 158: 572–584.
7. van de Koppel J, Gascoigne JC, Theraulaz G, Rietkerk M, Mooij WM, et al. (2008) Experimental evidence for spatial self-organization and its emergent effects in mussel bed ecosystems. Science 322: 739–742.
8. Chesson P (2000) Mechanisms of maintenance of species diversity. Ann Rev Ecol Syst 31: 343–366.
9. Geange SW, Stier AC (2009) Order of arrival affects competition in two reef fishes. Ecology 90: 2868–2878.
10. Branch GM (1984) Competition between marine organisms: ecological and evolutionary implications. Oceanogr Mar Biol Ann Rev 22: 429–593. 11. Erlandsson J, Pal P, McQuaid CD (2006) Re-colonisation rate differs between
co-existing indigenous and invasive intertidal mussels following major distur-bance. Mar Ecol Prog Ser 320: 169–176.
12. Quinn JF (1982) Competitive hierarchies in marine benthic communities. Oecologia 54: 129–135.
13. Bell JJ (2008) Sponges as agents of biological disturbance. Mar Ecol Prog Ser 368: 127–135.
14. Ricciardi A, Atkinson SK (2004) Distinctiveness magnifies the impact of biological invaders in aquatic ecosystems. Ecol Lett 7: 781–784.
15. Stachowicz JJ, Tilman D (2005) Species invasions and the relationships between species diversity, community saturation, and ecosystem functioning. In: Sax DF, Stachowicz JJ, Gaines SD, eds. Species Invasions: Insights into Ecology, Evolution and Biogeography Sinauer Associates, Inc., Massachusetts. pp 41–64. 16. Robinson TB, Griffiths CL, McQuaid CD, Rius M (2005) Marine alien species
of South Africa – status and impacts. Afr J Mar Sci 27: 297–306.
17. McDonald J, Koehn R (1988) The musselsMytilus galloprovincialisandM. trossulus on the Pacific coast of North America. Mar Biol 99: 111–118.
18. Rawson P, Agrawal V, Hilbish T (1999) Hybridization between the blue mussels Mytilus galloprovincialisandM. trossulusalong the Pacific coast of North America: evidence for limited introgression. Mar Biol 134: 201–211.
19. Bownes SJ, McQuaid CD (2006) Will the invasive musselMytilus galloprovincialis Lamarck replace the indigenousPerna pernaL. on the south coast of South Africa? J Exp Mar Biol Ecol 338: 140–151.
20. Lasiak TA, Barnard TCE (1995) Recruitment of the brown musselPerna perna onto natural substrata: a refutation of the primary/secondary settlement hypothesis. Mar Ecol Prog Ser 120: 147–153.
21. Harris JM, Branch GM, Elliott BL, Currie B, Dye AH, et al. (1998) Spatial and temporal variability in recruitment of intertidal mussels around the coast of southern Africa. S Afr J Zool 33: 1–11.
22. von der Meden C, Porri F, Erlandsson J, McQuaid CD (2008) Coastline topography affects the distribution of indigenous and invasive mussels. Mar Ecol Prog Ser 372: 135–145.
23. Zardi GI, Nicastro KR, McQuaid CD, Rius M, Porri F (2006) Hydrodynamic stress as a determinant factor in habitat segregation between the indigenous musselPerna pernaand the invasiveMytilus galloprovincialisin South Africa. Mar Biol 150: 79–88.
24. Rius M, McQuaid CD (2006) Wave action and competitive interaction between the invasive musselMytilus galloprovincialisand the indigenousPerna pernain South Africa. Mar Biol 150: 69–78.
25. Bownes SJ, McQuaid CD (2009) Mechanisms of habitat segregation between an invasive and an indigenous mussel: settlement, post-settlement mortality and recruitment. Mar Biol 156: 991–1006.
26. Nicastro KR, Zardi GI, McQuaid CD, Stephens L, Radloff S, et al. (2010) The role of gaping behaviour in habitat partitioning between coexisting intertidal mussels. BMC Ecology 10: 17–27.
27. Rius M, McQuaid CD (2009) Facilitation and competition between invasive and indigenous mussels over a gradient of physical stress. Basic Appl Ecol 10: 607–613.
28. McQuaid CD, Mostert BP (2010) The effects of within-shore water movement on growth of the intertidal musselPerna perna: an experimental field test of bottom-up control at centimetre scales. J Exp Mar Biol Ecol 384: 119–123.
29. Bertness MD, Grosholz E (1985) Population dynamics of the ribbed mussel, Geukensia demissa: the costs and benefits of an aggregated distribution. Oecologia 67: 192–204.
30. Hill JM, McQuaid CD, Kaehler S (2006) Biogeographic and nearshore-offshore trends in isotope ratios of intertidal mussels and their food sources around the coast of southern Africa. Mar Ecol Prog Ser 318: 63–73.
31. Cole VJ, McQuaid CD (2010) Bioengineers and their associated fauna respond differently to the effects of biogeography and upwelling. Ecology 91: 3549–3562.
32. Bruno JF, Stachowicz JJ, Bertness MD (2003) Inclusion of facilitation into ecological theory. Trends Ecol & Evol 18(3): 119–125.
33. McQuaid CD, Lindsay JR, Lindsay TL (2000) Interactive effects of wave exposure and tidal height on population structure of the musselPerna perna. Mar Biol 137: 925–932.
34. Branch GM, Griffiths CL, Branch ML, Beckley LE (1994) Two oceans: a guide to the marine life of southern Africa David Philip Publishers, Cape Town.
35. Bownes SJ (2005) Habitat segregation in competing species of intertidal mussels in South Africa. PhD thesis, Rhodes University, Grahamstown.
36. Bownes SJ, Barker NP, McQuaid CD (2008) Morphological identification of primary settlers and post-larvae of three mussel species from the coast of South Africa. Afr J Mar Sci 30: 233–240.
37. Legendre P (1993) Spatial autocorrelation: trouble or new paradigm? Ecology 74: 1659–1673.
38. Hewitt JE, Thrush SF, Cummings VJ, Pridmore RD (1996) Matching patterns with processes: predicting the effect of size and mobility on the spatial distributions of the bivalvesMacomona lilianaandAustrovenus stutchburyi. Mar Ecol Prog Ser 135: 57–67.
39. Dale MRT (2000) Spatial pattern analysis in plant ecology Cambridge University Press, Cambridge.
40. Kostylev V, Erlandsson J (2001) A fractal approach for detecting spatial hierarchy and structure on mussel beds. Mar Biol 139: 497–506.
41. Hastings HA, Sugihara G (1993) Fractals: A User’s Guide for the Natural Sciences Oxford University Press, Oxford.
42. Imre AR, Cseh D, Neteler M, Rocchini D (2011) Korcak dimension as a novel indicator of landscape fragmentation and re-forestation. Ecol Indicat 11(5): 1134–1138.
43. Peralta P, Mather P (2000) An analysis of deforestation patterns in the extractive reserves of Acre, Amazonia from satellite imagery: a landscape ecological approach. Int J Remote Sensing 21(13–14): 2555–2570.
44. Fahrig L (2003) Effects of habitat fragmentation on biodiversity. Ann Rev Ecol Evol Syst 34: 487–515.
45. Quinn GP, Keough MJ (2002) Experimental design and data analysis for biologists Cambridge University Press, Cambridge.
46. Fisher RA (1932) Statistical Methods for Research Workers. 4th edn Oliver and Boyd: London.
47. Underwood AJ (1997) Experiments in ecology: their logical design and interpretation using analysis of variance Cambridge University Press, Cam-bridge.
48. Nicastro KR, Zardi GI, McQuaid CD (2010) Differential reproductive investment, attachment strength and mortality of invasive and indigenous mussels across heterogeneous environments. Biol Inv 12: 2165–2177. 49. Bownes SJ, McQuaid CD (2010) Mechanisms of habitat segregation between an
invasive (Mytilus galloprovincialis) and an indigenous (Perna perna) mussel: adult growth and mortality. Mar Biol 157: 1799–1810.
51. Carson HS, Lopez-Duarte MP, Rasmussen L, Wang D, Levin LA (2010) Reproductive timing alters population connectivity in marine metapopulations. Curr Biol 20: 1926–1931.
52. von der Meden CEO, Porri F, McQuaid CD, Faulkner K, Robey J (2010) Fine-scale ontogenetic shifts in settlement behaviour of mussels: changing responses to biofilm and conspecific settler presence inMytilus galloprovincialisandPerna perna. Mar Ecol Prog Ser 411: 161–171.
53. Nicastro KR, Zardi GI, McQuaid CD (2008) Movement behaviour and mortality in invasive and indigenous mussels: resilience and resistance strategies at different spatial scales. Mar Ecol Prog Ser 372: 119–126.
54. Weerman EJ, Herman PMJ, van de Koppel J (2011) Top-down control inhibits spatial self-organization of a patterned landscape. Ecology;doi: 10.1890/10-0270.1.
55. Plass-Johnson JG, McQuaid CD, Porri F (2010) Top-down effects on intertidal mussel populations: assessing two predator guilds in a South African marine protected area. Mar Ecol Prog Ser 411: 149–159.
56. Kohler S, Bonnevie B, McQuaid C, Jaquemet S (2009) Foraging ecology of an endemic shorebird, the African Black Oystercatcher (Haematopus moquini) on the south–east coast of South Africa. Estuar Coast Shelf Sci 84: 361–366. 57. Connell JH (1978) Diversity in tropical rain forests and coral reefs. Science 199:
1302–1310.