Crowdsourcing a Collective Sense of Place
Andrew Jenkins1¤a
*, Arie Croitoru1,2¤a, Andrew T. Crooks3¤b, Anthony Stefanidis1,2¤a
1Department of Geography and GeoInformation Science George Mason University, Fairfax, Virginia, United States of America,2Center for Geospatial Intelligence George Mason University, Fairfax, Virginia, United States of America,3Department of Computational and Data Sciences George Mason University, Fairfax, Virginia, United States of America
¤a Current address: Department of Geography and GeoInformation Science George Mason University, Fairfax, Virginia, United States of America
¤b Current address: Department of Computational and Data Sciences George Mason University, Fairfax, Virginia, United States of America
*ajenki11@gmu.edu
Abstract
Place can be generally defined as a location that has been assigned meaning through human experience, and as such it is of multidisciplinary scientific interest. Up to this point place has been studied primarily within the context of social sciences as a theoretical con-struct. The availability of large amounts of user-generated content, e.g. in the form of social media feeds or Wikipedia contributions, allows us for the first time to computationally ana-lyze and quantify the shared meaning of place. By aggregating references to human activi-ties within urban spaces we can observe the emergence of unique themes that characterize different locations, thus identifying places through their discernible sociocultural signatures. In this paper we present results from a novel quantitative approach to derive such sociocul-tural signatures from Twitter contributions and also from corresponding Wikipedia entries. By contrasting the two we show how particular thematic characteristics of places (referred to herein as platial themes) are emerging from such crowd-contributed content, allowing us to observe the meaning that the general public, either individually or collectively, is assign-ing to specific locations. Our approach leverages probabilistic topic modellassign-ing, semantic association, and spatial clustering to find locations are conveying a collective sense of place. Deriving and quantifying such meaning allows us to observe how people transform a location to a place and shape its characteristics.
Introduction
The study of space and place has been the subject of multiple disciplines, ranging from geogra-phy [1,2] and planning [3,4], to health informatics [5], sociology [6,7], and psychology [8–10], to name but a few. Nevertheless, the concept of place itself remains rather elusive, as it is the outcome of cognitive processes that were up to now difficult to observe and curate. An often-cited definition has been provided by Tuan [2] who termed places as“. . .spatial locations that have been given meaning by human experience.”In the context of this paper, we consider place to be one’s perception of a location as it relates to one’s sociocultural views and personal
OPEN ACCESS
Citation:Jenkins A, Croitoru A, Crooks AT, Stefanidis A (2016) Crowdsourcing a Collective Sense of Place. PLoS ONE 11(4): e0152932. doi:10.1371/journal. pone.0152932
Editor:Tobias Preis, University of Warwick, UNITED KINGDOM
Received:December 18, 2015
Accepted:March 20, 2016
Published:April 6, 2016
Copyright:© 2016 Jenkins et al. This is an open access article distributed under the terms of the
Creative Commons Attribution License, which permits unrestricted use, distribution, and reproduction in any medium, provided the original author and source are credited.
Data Availability Statement:Data are accessible via Figshare (http://dx.doi.org/10.6084/m9.figshare. 2429491).
Funding:Publication of this article was funded in part by the George Mason University Libraries Open Access Publishing Fund and a Provost Award. The funder had no role in study design, data collection and analysis, decision to publish, or preparation of the manuscript.
experiences. Accordingly, places are formed through the reoccurrence of experiences and activ-ities (of individuals or groups) at a certain location [11,12], which transform this location from a geometric concept (its three dimensional shape) to an experiential construct (conveying per-sonal and/or public perceptions). Herein we refer to the defining characteristics of places, whether they are e.g. a financial district, a nightlife hotspot, or an artistic neighbourhood of a city, as platial signatures.
By its very nature, the concept of place is constantly evolving, as over time places are recon-stituted with new meaning, reflecting for example urban dynamics [13], evolving sociocultural perceptions [14], or significant events [15]. While the assignment of a crisp geometric shape to places derived from social or collective meanings is often problematic due to vagueness and indeterminate boundaries [15,16], there exist substantial advantages to pursuing this effort: platial views offer new insights beyond traditional space perspectives as human activity is more aligned with place rather than geometric space.
The emergence of massive amounts of geotagged content (see e.g. [17]) is bringing forward a renewed focus on spatial humanities, or the study of human activities in, and in relation to, space and place [18]. We now have access to continuous streams of worldwide crowd-gener-ated content, for example in the form of geotagged tweets and blog entries or Flickr and Insta-gram imagery. While it has been shown that such content can capture breaking events in the context of citizen journalism (see e.g. [19–22]) the question still remains of how well such crowd-contributed content can be mined to discover platial knowledge. The importance of developing new approaches to mining and reasoning with platial knowledge is evident
[16,23,24] However, the types of data sources (i.e. geotagged media) available for mining platial knowledge present their own inherent challenges with respect to dimensionality, spatial and temporal coverage, linguistic style, etc. Thus the use of combined techniques from across multi-ple disciplines (i.e. geography, machine learning, social science) to study platial knowledge has proven most effective to date.
Enrico et al., [23] used a mixed approach, albeit with a single data source, that extracted spa-tiotemporal and semantic features from Twitter using a combination of spatial statistics, semantic modeling, and a neural network to detect human activity patterns from perceived pla-tial content. Liu et al., [25] presented an approach to mining human representations of place and social activities from taxi trajectories and social media check-ins using a remote sensing framework to create social images. The images provide arguably land-use representations of platial knowledge and also highlight the fusion of multiple data sources to derive such informa-tion. Adams and McKenzie [26] evaluated platial content in travel blogs using topic modeling and spatiotemporal features to determine the thematic similarity between different places. This work highlights yet another dimension and data source of platial content, provided in this case, through tourist narratives at both an individual and collective event levels.
leverages probabilistic topic modelling, semantic association, and spatial clustering to find loca-tions of collective sense of place.
Materials and Methods
In order to address our research question we proceed by collecting Wikipedia entries and semantic access statistics for various locations and Twitter streams originating from these loca-tions as well. We then learn topical terms in such user-generated content, label them by assign-ing them into high-level categories, and compare them to quantify the level of thematic alignment between these two different sources. In this paper we present results from four major cities, namely New York City (NYC), Los Angeles (LA), Singapore (SG), and London (LDN). Furthermore, in order to highlight our research question at a finer geographical scale, we also present results from three areas within NYC (Lower Manhattan, Central Park, and Theatre District). We should note here that in the context of this paper we also use the term neighbourhood to refer to such sub-city level areas. We pursue our study at both scales because the notion of place is inherently multiscalar [28–30].
Regarding the sociocultural categories that characterize a place, we selected politics, busi-ness, education, recreation, sports, and entertainment as our high-level categories. These par-ticular categories were chosen because they have been shown to be dominant in both
Wikipedia and Twitter (see e.g. [31,32]), with entertainment in particular having a dispropor-tionately strong presence in user-generated media [33,34]. Each of the above-listed high-level categories is an explicit category in Wikipedia and appears in over 50,000 articles. Previous studies have demonstrated content alignment with said categories for classifying trending top-ics [35], filtering tweets into new groups [36], and categorizing the professions of users [37].
Our overall approach is presented inFig 1, for which we briefly describe Twitter processing first. We collected geotagged tweets from our study areas using Twitter’s streaming Application Programming Interface (API) that returns a sample of 1% of all tweets. Previous studies have shown that such precisely geotagged tweets typically reflect a sample of approximately 2% [38] of the entire Twitter API traffic. For both the city and neighbourhood scales, Twitter data were gathered continuously for an entire month (April 2014), resulting in approximately 4.5 million tweets for NYC, 4.3 million for LA, 821,000 for SG, and 1.3 million for LDN. The tweets were filtered spatially using official geographic boundaries for all cities and neighbourhood areas [39–42]. Tweets were then grouped into 24hr time periods by location and processed using topicaln-gram modelling.
In order to extract and label topics from our data corpus we applied a variation of the proba-bilistic topic model Latent Dirichlet Allocation (LDA, [43]), known as the topicaln-gram
Fig 1. Flowchart describing overall process used to discover platial alignment.Step 1: sequential ingestion of Twitter, and Wikipedia article representing each spatial location, and all geo-located Wikipedia article titles spatially and semantic access statistics contained within the same location. Step 2: unsupervised topic discovery using topicaln-grams. Step 3: determine the semantic overlap of topicaln-grams and defined categories using Wikipedia search counts and PMI. Step 4: determine the statistical significance of each platial category and compare proportional alignment between Twitter and Wikipedia.
model [44], treating 24-hour subsets of our data corpus as the equivalent of individual docu-ments for the LDA analysis. To describe, LDA is an unsupervised generative probabilistic model that discovers latent structure in a collection of documents by representing each docu-ment as a mixture of latent topics (unigrams), where a topic is itself represented as a distribu-tion of words that tend to co-occur [43]. In general, topic modelling enables the conversion of high-dimensional and noisy spaces of words and document allocations into a low-dimensional topic and document allocations. Blei et al. [43] described the use of LDA for dimensionality reduction for feature selection in supervised classifiers such as Support Vector Machine (SVM). In essences, topical n-gram model is applied for dimensionality reduction of tweets and Wikipedia articles.
Each detected bi-gram is considered part of atopic of discussion. Discussion topics may be classified linguistically as belonging to multiple high-level categories by considering their
Point-wise Mutual Information(PMI) value [45]. PMI is a measure of association originating from information theory and statistics that calculates the probability of two events occurring given their individual and joint distributions. The measure has been applied in the field linguis-tics, from which we use here, to find associations between words using an online knowledge base. The probability of association is calculated by the collocation frequency of topical terms and categories. We thematically classify each topic as belonging to the high-level category that corresponds to its highest PMI value, which are estimated using the entire online Wikipedia corpus and comparing the frequencies of topic and category co-occurrences.
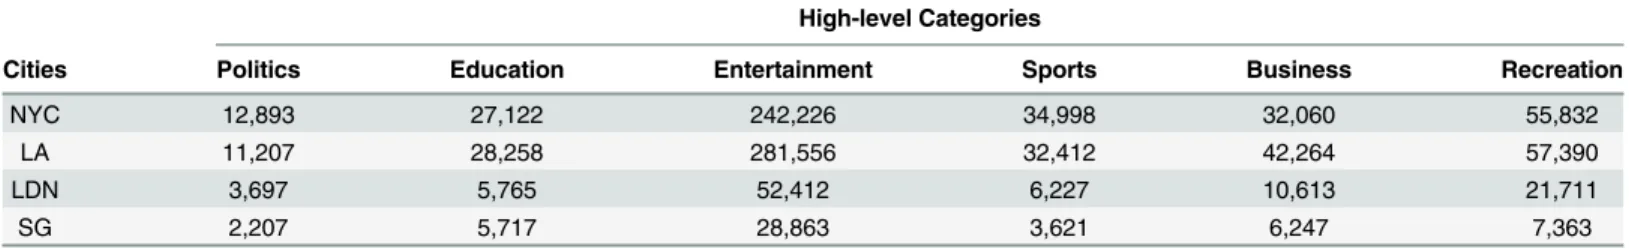
For our particular study, bi-grams perform better than unigrams or phrases, when it comes to their thematic classification. This is consistent with studies addressing the performance ofn -gram classification in Twitter, which also supported the notion that bi--grams outperform other alternatives [46]. This is not surprising, as given the brief nature of tweets (at only 140 charac-ters per tweet), unigrams are ambiguous, while meaningful longer phrases tend to be scarce. Based on the labelling of the bi-grams contained within them, individual tweets were classified under the 6 top-level categories as shown inTable 1.
Table 1demonstrates the dominance of entertainment content in Twitter data. The results of this Table were obtained by setting a maximum value of 700 to the number of bi-gram topics that were extracted from our data corpus. In our studies we also compared the effect of varying the number of topics (i.e. from 100 to 700 in increments of 100) and found that the propor-tional allocations to high-level themes were consistent.
For single Wikipedia articles (Fig 1), we applied the same approach to analyzing individual article content, and more specifically the single entry for each city and neighbourhood that are subjects to our study. Each single Wikipedia entry was accessed programmatically using the article’s webpage address. We extracted topical bi-grams from these entries, and allowed for up to 30 topics per document, with up to 10 bi-grams per topic, reflecting the smaller size of these documents, compared to our Twitter data corpus. The number of topics was based on the empirical evidence from [47], as 30 was shown to optimize the Kullback-Leibler [48]
Table 1. Total count of tweets per high-level category containing a semantically related topical n-gram.
High-level Categories
Cities Politics Education Entertainment Sports Business Recreation
NYC 12,893 27,122 242,226 34,998 32,060 55,832
LA 11,207 28,258 281,556 32,412 42,264 57,390
LDN 3,697 5,765 52,412 6,227 10,613 21,711
SG 2,207 5,717 28,863 3,621 6,247 7,363
divergence value. Bi-grams within each topic were thematically classified against each of the six high-level categories using the aforementioned PMI process.
We also investigate geo-located Wikipedia articles and their associated online semantic access statistics that are spatially contained with each study area. The rational for inclusion of this data is that Twitter is highly dynamic and event driven, and a single Wikipedia article (e.g. NYC), although derived from collective consensus, is comparatively more static. Hence, by the-matically classifying each geo-located article using its title as the topic and the number of online page accesses from the same month as the categorical proportions, we extract a more dynamic representation of place from Wikipedia. We used DBPedia [49], which offers a more structured means to access Wikipedia content, to collect titles and geographic coordinates from geotagged articles [50]. The official boundaries of each study were used as before with Twitter to spatially filter the geotagged Wikipedia articles. We then used a Wikipedia statistics site [51] to gather the number of page accesses for each article title over the same time period as the Twitter data was collected (i.e. April 2014). As shown inFig 1, the title of each article is processed using the same thematic classification approach as the topical n-grams. Instead of using topic counts to calculate category proportions (seeTable 1), the number of page accesses was used. To illus-trate, take for example the geo-tagged Wikipedia article entitled“Roseland Ballroom”, the arti-cle was thematically classified as entertainment and accessed 21,492 times in the month of April 2014. The process is repeated for all articles within the same boundaries and the total proportions for each category are calculated.
We selected a variation of LDA, topicaln-gram model (i.e. bi-grams), given the short 140-character limit of tweets to achieve higher topic coherence. Individual bi-grams within each topic were programmatically sent to Wikipedia’s search engine to capture the search count (total number of articles containing the terms). This process was repeated for each high-level category and finally the joint count of each bi-gram and high-high-level category. We normal-ized each search count over the total number of articles in Wikipedia, which at the time of this study was N = 4,502,037. A PMI value was calculated for every bi-gram for each of the six
high-level categories. The equationPMIðw1;w2Þ ¼log2
pðw1;w2Þ
pðw1;Þpðw2Þ
depicts the PMI
calcula-tion adapted from [52]. The probabilityp(w1) is estimated byfw1=N, where is the Wikipedia
web count of topic termw1andNis total number of Wikipedia articles. The probabilityp(w2) is estimated byfw2=N, wherefw2is the Wikipedia web count of themew2andNis total number of Wikipedia articles. The probability of co-occurrencep(w1,w2) is calculated byfw1fw2=N,
wherefw1fw2is the Wikipedia web count ofw1andw2, andNis the total number of Wikipedia
articles.
In order to assess the PMI of the topicaln-gram results related to the high-level categories we performed a manual assessment of a random subset of our Twitter data and found a nomi-nal F1score of 0.70. The bi-grams that Wikipedia could not disambiguate or interpret, thus resulting in a search count of zero, were not included in the results. This accuracy is consistent with similar studies using PMI, albeit without Twitter [53]. Recchia and Jones [54] compared PMI with Latent Semantic Analysis (LSA) using Wikipedia and Spearman rank correlation between human judgments of semantic similarity. These researchers reported correlations ranging between 0.73 and 0.86, and concluded that the simple PMI metric with large volumes of data correlates more closely with human semantic similarities ratings than more complex models.
geographies vary considerably. As such, we used Global Moran’s I [55] to find an appropriate analysis distance per location (i.e. NYC) by repeatedly measuring spatial autocorrelation at incremented distances using the geo-located Tweets. Using the geotagged tweets and their PMI values per high-level category, we found the prominent distance with a statistically significant z-score (z>1.96,P<0.05), and detected the following measures: LA 701.3m, NYC 619.2m, SG 1,334.9m, LDN 731.4m. The distances were recorded for each of the four cities and parame-terized as the fixed distance threshold in the local Getis-Ord Gi[56] statistic along with the PMI values for each category.
The Getis-Ord Gistatistic is used to discover local spatial clusters with high semantic val-ues within the boundaries of each city. To briefly describe, Getis-Ord Giis a local spatial sta-tistic that produces z-scores and p-values for each feature by looking at neighbouring features given a weighting, in this case distance is used as the weight, to determine spatial clusters of high or low values. We calculated the statistic by taking the sum of a single tweet PMI value combined with it’s neighbours within the set distance, and compared this to the expected local sum from all the tweet PMI values combined. When the difference between these two propor-tions is considerable and not by random chance, the single tweet is labelled as significant. A tweet with a high PMI similarity score is interesting, but may not be a statistically significant hot spot or a place with nearby features with similar place expressions. Moreover, a feature (i.e. single geotagged tweet) will have a high PMI similarity value and be surrounded by other fea-tures with high values as well. We determined statistical significance at theP<0.05level and considered only z-scores greater than +1.96.
We selected the Renkonen [57], percentage similarity index (PS =Smin(p1i,p2i)) to assess proportional alignment of high-level categories due to the minimal affect of sample size differ-ences [58]. The similarity measure is traditionally used in measuring the proportional abun-dances of species between communities and habitats. We used the counts per high-level category to calculate percentages between each individual source at different locations (i.e. just Twitter or Wikipedia) and then a cross-source comparison (i.e. Twitter and Wikipedia). More specifically, the counts of topical terms per high-level category (e.g.Table 1) are expressed as percentages that sum to 100% for each location. Each location is compared to all other loca-tions in pairwise steps using the Renkonen index. For instance, comparing the percentage simi-larity between NYC and LA entails taking the minimum percentage value between
corresponding high-level categories (i.e. NYC politics vs. LA politics) and summing the values across all high-level categories. The higher the percentage value the more similar the places and conversely a lower value would indicate dissimilarity.
Results
Spatial alignment between Twitter hotspots and corresponding physical
locations
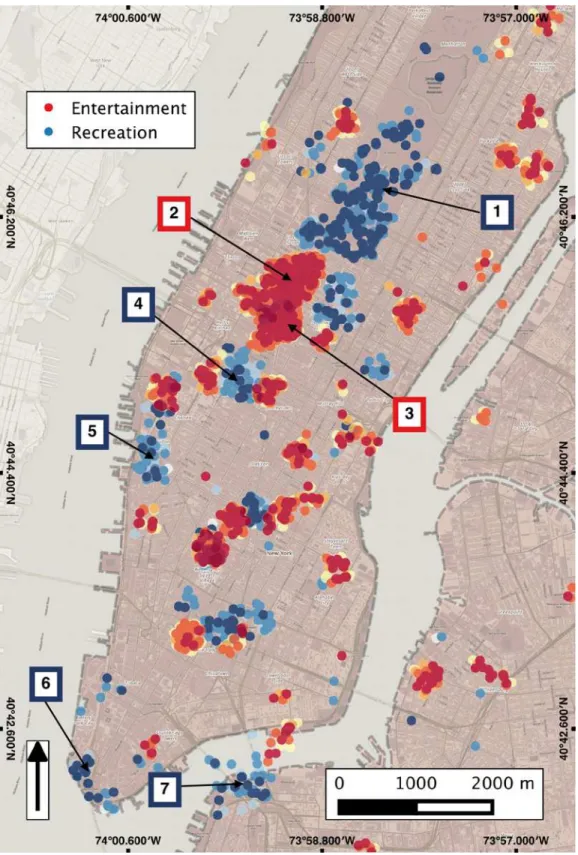
In order to assess the degree to which Twitter content originating from various locations reflects the characteristics of these locations, we compare spatial clusters of thematic content in Twitter data to the corresponding physical neighbourhoods and their thematic characteristics as reflected in Wikipedia.Fig 2shows the resulting high value clusters for two categories, namely entertainment (red) and recreation (blue) in a subset of Manhattan, NYC. In this Fig we show the spatial distribution in finer resolution in order to better communicate the level of alignment between Twitter clusters and corresponding physical places: green clusters align at, or near, known areas of recreational affordances such as parks and squares, with the most nota-ble cluster spatially aligned with Central Park. Similarly, the entertainment clusters align with established local entertainment hubs such as Times Square, Madison Square Garden, and the most notable cluster being at Broadway in the Theatre Sub District, just southwest of Central Park.
Once these clusters are aggregated locally we have an even clearer view of this thematic alignment. These clusters are visualized inFig 3, showing that the recreational clusters of Twit-ter content are overlapping not just with Central Park, but also with multiple parks throughout the city, including Battery Park, Brooklyn Bridge Park, High Line Park, etc. This supports the argument that at this scale of analysis Twitter content is reflective of the local platial character-istics. In the same figure, the pie chart on its right-hand side shows the relative portion of Twit-ter content that is considered asrecreationwithin our Twitter data corpus for this area (namely 13.7%, second to the dominantentertainmentcategory). Of course, as we see inFig 3, we also receive few false positives (e.g. spots that are not aligned with parks in that figure). This is due to two reasons. First, there is some inherent fuzziness in the use of various terms, which may have multiple meanings in various contexts, yet are assigned their primary label in our cluster-ing. For example, we often encounter the termreadin tweets originating in the vicinity of air-ports, leading to the detection of local educational hotspots (as the term is primarily
considered indicative of educational activities), even though in that case it is simply used by passengers who read books or periodicals while awaiting their plane. Second, the social media data may often indicate need rather than support for a certain type of activity. A small local square for example, may be serving as an informal recreational spot, even though formally it may not be recognized as such.
While the above results show the overall alignment of thematic hotspots, we also compared the extent to which the crowdsourced spatial footprint of a thematic place aligns with its for-mally-defined extent. InFig 4we show the spatial extent of entertainment Twitter clusters (red dots) at the neighbourhood level for the Theatre Sub District, NYC. Beyond the spatial align-ment, this Fig also illustrates how a place affordance extends beyond the formal boundary of that place due to human activity and/or expression: as the public moves to or from the Theatre District, it remainsimmersedin the thematic character of that place. As a result of this process, we have a collective reconfiguration of the platial boundary, shifting it westwards of its formal outline. Thus, social media content can capture places not just as the aggregate of their form and functions [15], but also by revealing the transitional immersion into the themes that these functions enable.
Fig 2. Statistically significant clusters of recreation and entertainment categories concentrated over Manhattan, NYC.For reference, the following sample places are labelled in the map with colour coded borders based on the legend features: (1) Central Park, (2) Broadway, (3) Times Square, (4) Madison Square Garden, (5) High Line Park, (6) Battery Park, and (7) Brooklyn Bridge Park.
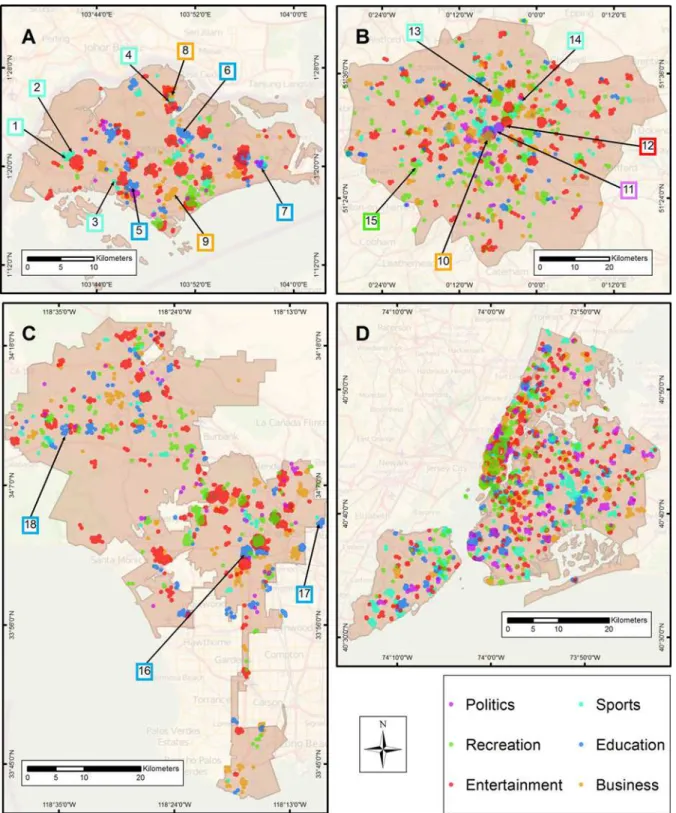
experiences, to further demonstrate spatial alignment. In SG sports clusters were detected in the western portion of the city near Jurong West Stadium and the Golazo Futsal Singapore. Additional alignment was observed in the central part of the city near Clementi Stadium as well as to the north near Yishun Stadium. Majority of the education clusters were found near schools and universities as expected with notable locations as the United World College of South East Asia, Nanyang Polytechnic, and Temasek Polytechnic. Business clusters were detected in the Yishun district primarily in the central business district. Additional clusters are observed in the southern portion of the city near the Orchard Road location, which is a popular shopping area according to Wikipedia, and a large tourist attraction.
For LDN, we found overlapping thematic clusters of business, politics, and entertainment concentrated in the West End of London area. The location contains numerous government buildings, businesses, and theatres. We observed sports clusters near both Emirates and Olym-pic Stadiums, and also near restaurants and sports pubs. For recreation, our results indicated strong spatial alignment with parks and mostly notably LDN’s largest, Richmond Park. In LA, significant clusters in the business category were observed near outdoor and indoor malls, shopping centres, and restaurants. However, we must note that we did not find a significant business cluster in LA’s Financial District. Comparing our results against geographic data from the LA city government, we observed clustering in the education category near such example locations as the University of Southern California, California State University Los Angeles, and California Lutheran University.
To further investigate the relationship between thematic hotspots and corresponding loca-tions of interest, we analyzed the Euclidean distance between thematic hotspots relating to edu-cation and sports and corresponding facilities in LA using average nearest neighbour and proximity analysis. We first used average nearest neighbour analysis to understand the spatial Fig 3. Spatially significant high value recreation clusters over NYC.The hexagon map depicts the statistically significant spatial clusters by point count coloured in blue. The results show a significant spatial alignment with prominent parks in NYC. The pie chart (right) shows that 13.7% of the total topics discovered from the entire NYC Twitter resulted in the highest semantic similarity with recreation out of the other five categories. Large clusters are annotated with location names to show spatial alignment.
distribution of facilities and then calculated the proximity of thematic hotspot points to these locations. To briefly describe average nearest neighbour analysis, the process calculates the minimum distance between a point and its closest neighbour, and repeats the process for all points to derive a mean distance that is compared to an expected mean random nearest neigh-bour distance [62]. This process produces the average nearest neighbour distance and gives a measure as to whether the points are spatially clustered or dispersed. We then subsequently looked at the average proximity of tweets to said facilities to get a relative indication of the dis-tance between the two sources.
In doing so, we focused on LA due to the accessibility of a GIS database, and chose educa-tion and sports because these are themes that have facilities with understood meanings. We first calculated an average nearest neighbour distance of 1298.6m for official sports facilities using LA city government data [40], and a nearest neighbour index of 0.43 and z-score of -16.67. With an index value less than 1 and a significant z-score, this result indicates the spatial distribution of sports facilities within the city are clustered. We then calculated the average proximity distance between all sports hotspot points to their nearest sports facility. We found Fig 4. Depiction of spatially significant clusters and the Theatre Sub District, NYC.The spatial concentration of entertainment tweet clusters (red dots) contained within, and nearby, the Theatre Sub District (yellow polygon) show the alignment of platial expressions with local affordances (i.e. theatres around Broadway). We observe the dynamics of platial expressions with spaces adjacent to the official boundary being reconstituted with entertainment expressions.
Fig 5. Maps depict significant hotspots for each of the high-level categories for (A) Singapore, (B) London, (C) Los Angeles, and (D) New York City.Additionally, the maps are annotated with sample locations were the hotspot aligns with a place with common meaning such as a school or stadium. The outlines of the numbered boxes correspond to the map legend colours. In map (A) Singapore, 1) Jurong West Stadium 2) Golazo Futsal Singapore 3) Clementi Stadium 4) Yishun Stadium 5) United World College of South East Asia 6) Nanyang Polytechnic 7) Temasek Polytechnic 8) Yishun District and 9) Orchard Road. In map (B) London, 10–12) West End of London 13) Emirates Stadium 14) Olympic Stadium and 15) Richmond Park. In map (C) Los Angeles,
that distance to have a mean value of 158.6 m, which is less then the average nearest neighbour distance and indicates an overall closeness in proximity between sports related tweets and facil-ities such as stadiums and athletic fields.
This also suggests that tweets conveying an athletic theme tend to originate in the vicinity of such facilities, conveying the platial nature of such locations. Accordingly, the mean distance of 158.6 m can be viewed as a measure of the extent of this particular theme’s immersion poten-tial. Similarly, we calculated an average nearest neighbour distance among all schools, colleges, and universities in LA and found it to be 956.7 m with a nearest neighbour index of 0.75 and z-score of -10.13. As before, this result indicates the educational facilities are also spatially clus-tered within the city boundary. The corresponding average proximity between education-related tweets and the nearest educational facility had a mean value of 406.1 m. This pattern is consistent with the above-made observations regarding sports facilities and their relation to thematically-focused Twitter content.
Thematic alignment between Twitter and Wikipedia at the
neighbourhood level
Above we discussed the spatial alignment of Twitter thematic clusters with corresponding facil-ities and neighbourhoods to show how thematic hotspots tend to coincide with relevant physi-cal locations and their characteristics. We now turn to assessing the thematic alignment among the uncurated content of individual tweets and the consensus expressing crowd-curated Wiki-pedia platial content. In that sense, each neighbourhood can be seen as having a sociocultural signature, expressing the ensemble of themes that assign it a particular character. Our objective is to compare such signatures as they emerge in Twitter traffic to the corresponding content as it is harvested from Wikipedia. We do so by studying the various percentages of different the-matic categories as they are used to describe various neighbourhoods in Wikipedia and com-pare them to the corresponding percentages of Twitter traffic originating from these locations. In order to pursue this objective we present our results first at the neighbourhood level, and then aggregating up to the city level.
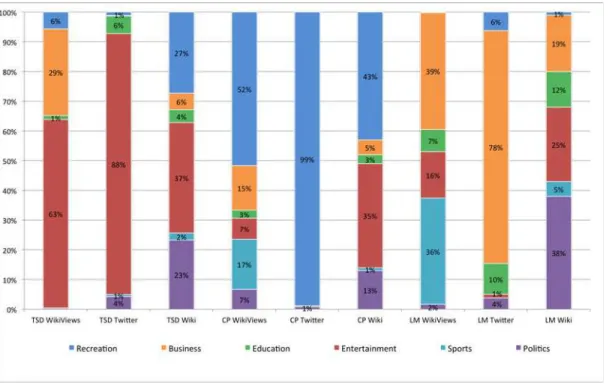
In order to highlight platial themes as they emerge at theneighbourhoodlevel of analysis, we present results from NYC’s Theatre District, Central Park, and the Lower Manhattan Financial District inFig 6. Each figure is a composite view of the proportions from Twitter and both Wikipedia topics and semantic page accesses by title. The outer pie chart on each graphic rep-resents Wikipedia topics, the middle shows Twitter topics, and the inner depicts Wikipedia page accesses. In the Fig we have summarized the degree to which various themes express the particular nature of each neighbourhood, capturing for example the more recreational nature of Central Park and the more entertainment-oriented character of the Theatre District.
experiences and activities at each location, and more importantly that unique expressions of place emerge from Twitter through uncurated processes.
We similarly assessed the single Wikipedia articles for each location (Fig 6). The average overall Renkonen similarity of this content for these three locations is 64%, which shows that single Wikipedia articles have higher proportional alignment and less uniqueness of place com-pared to Twitter. Central Park and the Theatre District resulted in the highest pairwise similar-ity of 87% compared to Lower Manhattan similarities of 49% (Central Park) and 57% (Theatre District). Considering the nature of Wikipedia entries as a reflection of crowd consensus, these similarity values can be viewed as an indicative reflection of the thematic variability among these locations. Regarding individual neighbourhoods, in the Theatre Sub District, entertain-ment is clearly dominant (37%), followed by recreation (27%). For Central Park, we find near the largest division between recreation (43%) and recreation (35%). In the Lower Manhattan District, home of City Hall and the financial district, proportions differ significantly from the other two locations with politics leading (38%), followed by entertainment (25%), and business (19%).
Additionally, we evaluated the Wikipedia titles with page accesses using Renkonen similar-ity from the percentages inFig 6and assessed the average overall similarity for these three loca-tions at 40%. Thus indicating less proportional alignment and more uniqueness of place between the neighbourhoods. Although the uniqueness is not as distinct as Twitter at 7%, we do see a reduction in alignment compared to the individual Wikipedia articles taken from the same data source. Looking at the most prominent proportions in each neighbourhood from Fig 6; the Theatre District is 64% entertainment, Central Park 51% recreation, and Lower Man-hattan 39% business followed by 35% sports.
Fig 6. Percentages for each category, data source, and location in New York City neighbourhoods.The bar chart labels are presented in<Location> <Data Source>form. The locations are Theatre Sub District (TSD), Central Park (CP), Lower Manhattan District (LM). The data sources are Wikipedia Article Topics (Wiki), Spatial Twitter Topics (Twitter), and Wikipedia Semantic Accesses (WikiViews).
We compared the thematic content of Wikipedia (single articles and geo-located semantic access) and Twitter per location to assess proportional alignment by looking atFig 7. Our find-ings show that for the Theatre District the highest similarity between Twitter and the geo-located article access at 66% followed by the single article and Twitter at 57%. The neighbour-hood displays more pronounced particularities, namely its entertainment orientation. For Cen-tral Park, we have very high thematic alignment, compared to the other areas, between Twitter and Wikipedia (both single and geo-located page views) content (53% and 39% respectively).
Conversely, in the Lower Manhattan District, which is home to diverse affordances and therefore more multifaceted, the thematic alignment between Twitter and the neighbourhood single Wikipedia article was lower (36%). The comparison Twitter and geo-located page access resulted in higher alignment at 50%. Interestingly, our findings show the highest proportional alignment between two different neighbourhoods, Central Park and Theatre District, but using the single Wikipedia article for each area. This results points to homogeneity of Wikipedia, referring to its content and afforded activities, but also that these two neighbourhoods are spa-tially joined. Meaning the descriptions and expressions of place within Wikipedia for these two places share common semantics and lineages.
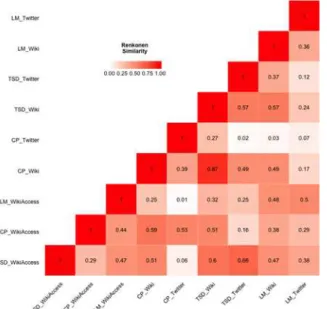
InFig 8, we visualize the neighbourhoods using non-metric multidimensional scaling to better understand the proportional similarities. As previously discussed, the process of ordina-tion uses the Renkonen dissimilarities derived fromFig 7. The distance between data points in Fig 8is determined from the rank-ordering of dissimilarity values and distance values in ordi-nation space for each pair of data points. From this we see two visual trends emerge fromFig 8. The first trend is the closeness of Twitter and Wikipedia semantic access proportions for each location, which indicates that at the neighbourhood scale a relative uniqueness of place, is revealed across these two different dynamic sources. Conversely, the second trend is the rela-tive grouping of Wikipedia articles from different locations thus representing more homogene-ity of the data source vice uniqueness of the places.
Thematic alignment between Twitter and Wikipedia at the city level
We performed the same analysis at the city level, aggregating all results within the city bound-aries, for NYC, LA, SG, and LDN. Focusing on Twitter, percentage data inFig 9and Renkonen similarities inFig 10, our results show similar proportional distributions across the four cities with an overall average similarity of 69%. When compared to Twitter at the neighbourhood scale this result indicates a loss of locational uniqueness. This further suggests that aggregating social media content at the city level of analysis has a smoothing effect on thematic content, removing the fine level platial characteristics that we observed at the neighbourhood level. Moreover, one could make the argument that at this level of analysis the platial character dissi-pates, and we observe Twitter at large rather than particulars.Comparing the Wikipedia articles (Figs9and10) produced an average similarity of 76% across the four cities. Our findings show that NYC and LA have the highest pairwise similarity (Fig 10) of 94% with entertainment as the dominant category. The results for Wikipedia semantic accesses are somewhat alike the Wikipedia articles with an average similarity of 80%, with NYC and LA having 93% proportional alignment. Like our neighbourhood findings, we see strong similarity between Wikipedia articles and semantic accesses for different areas, pointing to the homogeneity of the source as opposed to locational distinction or scale.
InFig 11, we view the cities using non-metric multidimensional scaling as previously shown with the neighbourhoods to better understand the proportional similarities across the all data sources and cities. Once again, the Renkonen percentage similarities fromFig 10are converted to dissimilarity values and visualized so that the data points are in rank-order agreement between distance and dissimilarity. As previously discussed, we explored various iteration val-ues to minimize the stress or fit between distance and dissimilarity in the visualization. The apparent smoothing effect of scale and aggregation is further revealed at this level with the notable grouping of Wikipedia articles, minus LDN, and lack of clear groupings of Twitter and semantic accesses by location. The distances of dynamic content, Twitter and Wikipedia access, are tempered by the lack of a unique single category for any one location.
Fig 8. Non-metric multi-dimensional scaling of each neighbourhood and data source.The first and second dimensions of the ordination are represented with distances computed by rank-ordering between Renkonen dissimilarity values and distances in ordination space. The neighbourhoods are abbreviated as follows: Theatre District (TSD), Central Park (CP), and Lower Manhattan (LM). The data sources are differentiated as Twitter, single Wikipedia articles (Wiki), and geo-located Wikipedia article with semantic access (WikiAccess).
Discussion
Our findings demonstrate how the meaning of place can be harvested through the analysis of crowd-generated content in the form of geotagged tweets. We do so by combining probabilistic topic modelling, semantic association, and spatial clustering to identify locations of collective sense of place. This approach also addresses the signal-to-noise problem found in Twitter, Fig 9. Percentages for each category and data source by city.The bar chart labels are presented in<Location> <Data Source>form. Locations include London (LDN), New York City (NYC), Los Angeles (LA), and Singapore (SG) and data sources are Wikipedia article topics (Wiki), spatial Twitter topics (Twitter), and geo-located Wikipedia semantic accesses (WikiViews).
doi:10.1371/journal.pone.0152932.g009
whereby, people may be in a place physically, but not necessarily participating or contributing to the shared meaning of a place. By contrasting such locations with the corresponding Wiki-pedia entries and semantic access we showed for the first time the thematic and spatial align-ment between these two sources, supporting the argualign-ment that such content can be analyzed to reveal the shared meaning of place, as it emerges through human activities and perception.
Ultimately, the scale of place has a significant impact on its discernibility within sources as shown in our findings of neighbourhoods and cities. At the neighbourhood scale the particular-ities of place emerge, whereas zooming out to the city scale reveals more of the medium such as Twitter and Wikipedia instead of a particular location. Undoubtedly, the aggregation of sources at varying scales of analysis will produce different results, which is why we separately investigated cities and neighbourhoods. As our world is becoming increasingly urbanized and dynamic, gaining an understanding of the building blocks of these urban environments is bringing forth the need for a new science of cities [63]. The work that we presented here is con-tributing towards this goal, as it provides a new lens to observe platial content as it emerges from the people themselves, and allows us to do so at levels of spatial and temporal granularity that far exceed our past capabilities. The spectrum of applications that may benefit from such an understanding of space is broad, ranging from business (e.g. supporting location-based ser-vices) to security (e.g. detecting hotspots of unrest) and even health (e.g. studying health pat-terns not only as geometrical constructs, but also in association to underlying sociocultural data and attitudes). By moving from a geometrical view of the world around us to a platial view, we better support the quantitative study of the world’s character, in addition to its layout.
Author Contributions
Conceived and designed the experiments: AJ AC ATC AS. Performed the experiments: AJ. Analyzed the data: AJ AC AS. Contributed reagents/materials/analysis tools: AJ AS. Wrote the paper: AJ AC ATC AS. Designed the software used in analysis: AJ.
References
1. Relph E. Place and placelessness. London: Pion; 1976.
Fig 11. Non-metric multi-dimensional scaling of each city with data source.The first and second dimensions of the ordination are represented with distances computed using rank-ordering of Renkonen dissimilarities. The cities are abbreviated as follows: London (LDN), New York City (NYC), Los Angeles (LA), and Singapore (SG) The data sources are differentiated as Twitter, single Wikipedia articles (Wiki), and geo-located Wikipedia articles with semantic access (WikiAccess).
2. Tuan YF. Space and place: The perspective of experience. U of Minnesota Press; 1977.
3. Graham S, Healey P. Relational concepts of space and place: issues for planning theory and practice. European planning studies. 1999 Oct 1; 7(5):623–46.
4. Healey P. The treatment of space and place in the new strategic spatial planning in Europe. Interna-tional journal of urban and regional research. 2004 Mar 1; 28(1):45–67.
5. Kearns RA, Joseph AE. Space in its place: developing the link in medical geography. Social Science & Medicine. 1993 Sep 30; 37(6):711–7.
6. Gieryn TF. A space for place in sociology. Annual review of sociology. 2000 Jan 1:463–96.
7. Law J, Urry J. Enacting the social. Economy and society. 2004 Aug 1; 33(3):390–410.
8. Devine-Wright P, Lyons E. Remembering pasts and representing places: The construction of national identities in Ireland. Journal of Environmental Psychology. 1997 Mar 31; 17(1):33–45.
9. Gustafson P. Meanings of place: Everyday experience and theoretical conceptualizations. Journal of Environmental Psychology 21, 5–16 (2001).
10. Gustafson P. Meanings of place: Everyday experience and theoretical conceptualizations. Journal of environmental psychology. 2001 Mar 31; 21(1):5–16.
11. Brandenburg AM, Carroll MS. Your place or mine?: The effect of place creation on environmental val-ues and landscape meanings. Society & Natural Resources. 1995 Sep 1; 8(5):381–98.
12. Williams DR, Stewart SI. Sense of place: An elusive concept that is finding a home in ecosystem man-agement. Journal of forestry. 1998 May 1; 96(5):18–23.
13. Batty M, Xie Y, Sun Z. Modeling urban dynamics through GIS-based cellular automata. Computers, environment and urban systems. 1999 May 1; 23(3):205–33.
14. Salesses P, Schechtner K, Hidalgo CA. The collaborative image of the city: mapping the inequality of urban perception. PloS one. 2013 Jul 24; 8(7):e68400. doi:10.1371/journal.pone.0068400PMID:
23894301
15. Crooks A, Pfoser D, Jenkins A, Croitoru A, Stefanidis A, Smith D, Karagiorgou S, Efentakis A, Lampria-nidis G. Crowdsourcing urban form and function. International Journal of Geographical Information Sci-ence. 2014, 29(5):1–22.
16. Goodchild MF, Li L. Assuring the quality of volunteered geographic information. Spatial statistics. 2012 May 31; 1:110–20.
17. Croitoru A., Crooks A. T., Radzikowski J., Stefanidis A., Vatsavai R. R., & Wayant N. Geoinformatics and social media: A new big data challenge. Big Data Techniques and Technologies in Geoinformatics, 2014, CRC Press, Boca Raton, FL, 207–232.
18. Louail T, Lenormand M, Ros OG, Picornell M, Herranz R, Frias-Martinez E, Ramasco JJ, Barthelemy M. From mobile phone data to the spatial structure of cities. Scientific reports. 2014 Jun 13; 4. 19. Goode L. Social news, citizen journalism and democracy. New Media & Society. 2009 Nov 24. 20. Kwak H, Lee C, Park H, Moon S. What is Twitter, a social network or a news media?. InProceedings of
the 19th international conference on World wide web 2010 Apr 26 (pp. 591–600). ACM.
21. Mathioudakis M, Koudas N. Twittermonitor: trend detection over the twitter stream. InProceedings of the 2010 ACM SIGMOD International Conference on Management of data 2010 Jun 6 (pp. 1155–
1158). ACM.
22. Bruns A, Highfield T, Lind RA. Blogs, Twitter, and breaking news: The produsage of citizen journalism. Produsing Theory in a Digital World: The Intersection of Audiences and Production in Contemporary Theory. 2012; 80(2012):15–32.
23. Steiger E, Resch B, Zipf A. Exploration of spatiotemporal and semantic clusters of Twitter data using unsupervised neural networks. International Journal of Geographical Information Science. 2015 Oct 19:1–23.
24. Roche S. Geographic information science II Less space, more places in smart cities. Progress in Human Geography. 2015 May 19:0309132515586296.
25. Liu Y, Liu X, Gao S, Gong L, Kang C, Zhi Y, Chi G, Shi L. Social Sensing: A New Approach to Under-standing Our Socioeconomic Environments. Annals of the Association of American Geographers. 2015 Apr 25(ahead-of-print):1–9.
26. Adams B, Janowicz K. Thematic signatures for cleansing and enriching place-related linked data. Inter-national Journal of Geographical Information Science. 2015 Feb 16(ahead-of-print):1–24.
27. Kaplan AM, Haenlein M. Users of the world, unite! The challenges and opportunities of Social Media. Business horizons. 2010 Feb 28; 53(1):59–68.
29. Batty M. Cities and complexity: understanding cities with cellular automata, agent-based models, and fractals. The MIT press; 2007 Sep 30.
30. Lewicka M. What makes neighborhood different from home and city? Effects of place scale on place attachment. Journal of environmental psychology. 2010 Mar 31; 30(1):35–51.
31. Kittur A, Chi EH, Suh B. What's in Wikipedia?: mapping topics and conflict using socially annotated cat-egory structure. InProceedings of the SIGCHI conference on human factors in computing systems 2009 Apr 4 (pp. 1509–1512). ACM.
32. Zhao WX, Jiang J, Weng J, He J, Lim EP, Yan H, Li X. Comparing twitter and traditional media using topic models. In Advances in Information Retrieval 2011 Jan 1 (pp. 338–349). Springer Berlin
Heidelberg.
33. Shao G. Understanding the appeal of user-generated media: a uses and gratification perspective. Inter-net Research. 2009 Jan 30; 19(1):7–25.
34. Hargittai E, Litt E. The tweet smell of celebrity success: Explaining variation in Twitter adoption among a diverse group of young adults. New Media & Society. 2011 Aug 1; 13(5):824–42.
35. Lee K, Palsetia D, Narayanan R, Patwary MM, Agrawal A, Choudhary A. Twitter trending topic classifi-cation. In Data Mining Workshops (ICDMW), 2011 IEEE 11th International Conference on 2011 Dec 11 (pp. 251–258). IEEE.
36. Dilrukshi I, De Zoysa K, Caldera A. Twitter news classification using SVM. In Computer Science & Edu-cation (ICCSE), 2013 8th International Conference on 2013 Apr 26 (pp. 287–291). IEEE.
37. Wagner C, Asur S, Hailpern J. Religious politicians and creative photographers: Automatic user catego-rization in twitter. In Social Computing (SocialCom), 2013 International Conference on 2013 Sep 8 (pp. 303–310). IEEE.
38. Burton SH, Tanner KW, Giraud-Carrier CG, West JH, Barnes MD. " Right time, right place" health com-munication on Twitter: value and accuracy of location information. Journal of medical Internet research. 2012 Nov; 14(6).
39. Nyc.gov. BYTES of the BIG APPLE—New York City Department of City Planning [Internet]. 2015 [cited
14 December 2015]. Available from:http://www.nyc.gov/html/dcp/html/bytes/applbyte.shtml
40. Cityplanning.lacity.org. Department of City Planning [Internet]. 2015 [cited 14 December 2015]. Avail-able from:http://cityplanning.lacity.org/
41. Data.london.gov.uk. Statistical GIS Boundary Files for London | Greater London Authority (GLA) | Pub-lishers [Internet]. 2015 [cited 14 December 2015]. Available from:http://data.london.gov.uk/dataset/ statistical-gis-boundary-files-london
42. OpenStreetMap. OpenStreetMap [Internet]. 2015 [cited 14 December 2015]. Available from:http:// www.openstreetmap.org
43. Blei DM, Ng AY, Jordan MI. Latent dirichlet allocation. the Journal of machine Learning research. 2003 Mar 1; 3:993–1022.
44. Wang X, McCallum A, Wei X. Topical n-grams: Phrase and topic discovery, with an application to infor-mation retrieval. In Data Mining, 2007. ICDM 2007. Seventh IEEE International Conference on 2007 Oct 28 (pp. 697–702). IEEE.
45. Turney PD. Thumbs up or thumbs down?: semantic orientation applied to unsupervised classification of reviews. InProceedings of the 40th annual meeting on association for computational linguistics 2002 Jul 6 (pp. 417–424). Association for Computational Linguistics.
46. Pak A, Paroubek P. Twitter as a Corpus for Sentiment Analysis and Opinion Mining. InLREC 2010 May 19 (Vol. 10, pp. 1320–1326).
47. Arun R, Suresh V, Madhavan CV, Murthy MN. On finding the natural number of topics with latent dirichlet allocation: Some observations. InAdvances in Knowledge Discovery and Data Mining 2010 Jan 1 (pp. 391–402). Springer Berlin Heidelberg.
48. Kullback S, Leibler RA. On information and sufficiency. The annals of mathematical statistics. 1951 Mar 1:79–86.
49. Auer S, Bizer C, Kobilarov G, Lehmann J, Cyganiak R, Ives Z. Dbpedia: A nucleus for a web of open data. Springer Berlin Heidelberg; 2007 Jan 1.
50. Popescu A, Grefenstette G. Spatiotemporal mapping of Wikipedia concepts. InProceedings of the 10th annual joint conference on Digital libraries 2010 Jun 21 (pp. 129–138). ACM.
51. Stats.grok.se. Wikipedia article traffic statistics [Internet]. 2015 [cited 13 December 2015]. Available from:http://stats.grok.se/
53. Iosif E, Potamianos A. Unsupervised semantic similarity computation between terms using web docu-ments. Knowledge and Data Engineering, IEEE Transactions on. 2010 Nov; 22(11):1637–47.
54. Recchia G, Jones MN. More data trumps smarter algorithms: Comparing pointwise mutual information with latent semantic analysis. Behavior research methods. 2009 Aug 1; 41(3):647–56. doi:10.3758/ BRM.41.3.647PMID:19587174
55. Páez A, Scott DM. Spatial statistics for urban analysis: a review of techniques with examples. GeoJour-nal. 2005 Sep 1; 61(1):53–67.
56. Getis A, Ord JK. The analysis of spatial association by use of distance statistics. Geographical analysis. 1992 Jul 3; 24(3):189–206.
57. Renkonen O.Statistisch-ökologische Untersuchungen über die terrestrische Käferwelt der finnischen Bruchmoore(Doctoral dissertation, Societas zoologica-botanica Fennica Vanamo).
58. Wolda H. Similarity indices, sample size and diversity. Oecologia. 1981 Sep 1; 50(3):296–302.
59. Kenkel NC, Orlóci L. Applying metric and nonmetric multidimensional scaling to ecological studies: some new results. Ecology. 1986 Aug 1:919–28.
60. JanáčM, Jurajda P. Diel differences in 0+ fish samples: effect of river size and habitat. River Research and Applications. 2013 Jan 1; 29(1):90–8.
61. de Mattos B, Bezerra L, Aguiar F, Moura-Neto C, Zucco CA, Cascon P. Diet, activity patterns, micro-habitat use and defensive strategies of Rhinella hoogmoedi Caramaschi & Pombal, 2006 from a humid forest in northeast Brazil. The Herpetological Journal. 2013 Jan 1; 23(1):29–37.
62. Clark PJ, Evans FC. Distance to nearest neighbor as a measure of spatial relationships in populations. Ecology. 1954 Oct 1; 35(4):445–53.