Identification of Novel Genetic Loci Associated with
Thyroid Peroxidase Antibodies and Clinical Thyroid
Disease
Marco Medici1.*
, Eleonora Porcu2,3., Giorgio Pistis4., Alexander Teumer5
, Suzanne J. Brown6,
Richard A. Jensen7, Rajesh Rawal8, Greet L. Roef9, Theo S. Plantinga10, Sita H. Vermeulen11, Jari Lahti12, Matthew J. Simmonds13, Lise Lotte N. Husemoen14, Rachel M. Freathy15, Beverley M. Shields16,
Diana Pietzner17, Rebecca Nagy18, Linda Broer19, Layal Chaker1, Tim I. M. Korevaar1, Maria Grazia Plia2, Cinzia Sala4, Uwe Vo¨lker5, J. Brent Richards20,21, Fred C. Sweep11, Christian Gieger8, Tanguy Corre4, Eero Kajantie22,23, Betina Thuesen14, Youri E. Taes9, W. Edward Visser1, Andrew T. Hattersley16, Ju¨rgen Kratzsch24, Alexander Hamilton13, Wei Li18, Georg Homuth5, Monia Lobina2, Stefano Mariotti3, Nicole Soranzo25, Massimiliano Cocca4, Matthias Nauck26, Christin Spielhagen26, Alec Ross11,
Alice Arnold27, Martijn van de Bunt13, Sandya Liyanarachchi18, Margit Heier28, Hans Jo¨rgen Grabe29, Corrado Masciullo4, Tessel E. Galesloot11, Ee M. Lim30, Eva Reischl31, Peter J. Leedman32,33, Sandra Lai2, Alessandro Delitala3, Alexandra P. Bremner34, David I. W. Philips35, John P. Beilby30,36, Antonella Mulas2, Matteo Vocale37, Goncalo Abecasis38, Tom Forsen39,40, Alan James32,41, Elisabeth Widen42, Jennie Hui30, Holger Prokisch43,44, Ernst E. Rietzschel45, Aarno Palotie42,46,47, Peter Feddema48, Stephen J. Fletcher30, Katharina Schramm43, Jerome I. Rotter49,50, Alexander Kluttig17, Do¨rte Radke51, Michela Traglia4, Gabriela L. Surdulescu52, Huiling He18, Jayne A. Franklyn53, Daniel Tiller17, Bijay Vaidya54, Tim de Meyer55, Torben Jørgensen14,56, Johan G. Eriksson22,57,58,59,60, Peter C. O’Leary36,61, Eric Wichmann62, Ad R. Hermus10, Bruce M. Psaty7,63, Till Ittermann51, Albert Hofman19, Emanuele Bosi64,
David Schlessinger65, Henri Wallaschofski24, Nicola Pirastu66,67, Yurii S. Aulchenko19, Albert de la Chapelle18, Romana T. Netea-Maier10, Stephen C. L. Gough13, Henriette Meyer zu Schwabedissen68, Timothy M. Frayling15, Jean-Marc Kaufman9, Allan Linneberg14, Katri Ra¨ikko¨nen12, Johannes W. A. Smit10, Lambertus A. Kiemeney11, Fernando Rivadeneira1,19,69, Andre´ G. Uitterlinden1,19,69, John P. Walsh6,32, Christa Meisinger28, Martin den Heijer70, Theo J. Visser1, Timothy D. Spector52, Scott G. Wilson6,32,52, Henry Vo¨lzke51, Anne Cappola71, Daniela Toniolo4,72, Serena Sanna2", Silvia Naitza2", Robin P. Peeters1"
1Department of Internal Medicine, Erasmus Medical Center Rotterdam, Rotterdam, The Netherlands,2Istituto di Ricerca Genetica e Biomedica (IRGB), Consiglio Nazionale delle Ricerche, c/o Cittadella Universitaria di Monserrato, Monserrato, Cagliari, Italy,3Dipartimento di Scienze Biomediche, Universita di Sassari, Sassari, Italy,4Division of Genetics and Cell Biology, San Raffaele Scientific Institute, Milan, Italy,5Interfaculty Institute for Genetics and Functional Genomics, University Medicine and Ernst-Moritz-Arndt-University Greifswald, Greifswald, Germany,6Department of Endocrinology and Diabetes, Sir Charles Gairdner Hospital, Nedlands, Western Australia, Australia, 7Cardiovascular Health Research Unit, Departments of Medicine, Epidemiology and Health Services, University of Washington, Seattle, Washington, United States of America,8Institute for Genetic Epidemiology, Helmholtz Zentrum Munich, Munich/Neuherberg, Germany,9Department of Endocrinology and Internal Medicine, University Hospital Ghent and Faculty of Medicine, Ghent University, Ghent, Belgium,10Internal Medicine, Division of Endocrinology, Radboud University Nijmegen Medical Center, Nijmegen, The Netherlands, 11Department for Health Evidence, Radboud University Medical Centre, Nijmegen, The Netherlands,12Institute of Behavioural Sciences, University of Helsinki, Helsinki, Finland,13Oxford Centre for Diabetes, Endocrinology and Metabolism and NIHR Oxford Biomedical Research Centre, Oxford, UK Churchill Hospital, Headington, Oxford, United Kingdom,14Research Centre for Prevention and Health, Glostrup University Hospital, the Capital Region of Denmark, Glostrup, Denmark,15Genetics of Complex Traits, University of Exeter Medical School, University of Exeter, Exeter, United Kingdom,16Peninsula NIHR Clinical Research Facility, University of Exeter Medical School, University of Exeter, Exeter, United Kingdom,17Institute of Medical Epidemiology, Biostatistics, and Informatics, Martin-Luther-University Halle-Wittenberg, Halle, Germany, 18Comprehensive Cancer Center, Ohio State University, Columbus, Ohio, United States of America, 19Department of Epidemiology, Erasmus Medical Center Rotterdam, Rotterdam, The Netherlands,20Departments of Medicine, Human Genetics, Epidemiology and Biostatistics, Lady Davis Institute, McGill University, Montreal, Canada,21Department of Twin Research and Genetic Epidemiology, King’s College London, London, United Kingdom,22National Institute for Health and Welfare, Helsinki, Finland,23Hospital for Children and Adolescents, Helsinki University Central Hospital and University of Helsinki, Helsinki, Finland,24Institute of Laboratory Medicine, Clinical Chemistry and Molecular Diagnostics, University Hospital Leipzig, Leipzig, Germany,25Wellcome Trust Sanger Institute, Hixton, United Kingdom,26Institute of Clinical Chemistry and Laboratory Medicine, University Medicine Greifswald, Greifswald, Germany, 27Department of Biostatistics, University of Washington, Seattle, Washington, United States of America,28Helmholtz Zentrum Muenchen, German Research Center for Environmental Health, Institute of Epidemiology II, Neuherberg, Germany,29Department of Psychiatry and Psychotherapy, University Medicine Greifswald, HELIOS Hospital Stralsund, Greifswald, Germany,30Pathwest Laboratory Medicine WA, Nedlands, Western Australia, Australia,31Research Unit of Molecular Epidemiology Helmholtz Zentrum Mu¨nchen - German Research Center for Environmental Health, Neuherberg, Germany,32School of Medicine and Pharmacology, the University of Western Australia, Crawley, Western Australia, Australia,33UWA Centre for Medical Research, Western Australian Institute for Medical Research, Perth, Western Australia, Australia,34School of Population Health, University of Western Australia, Nedlands, Western Australia, Australia,35MRC Lifecourse Epidemiology Unit, Southampton General Hospital, Southampton, United Kingdom,36School of Pathology and Laboratory Medicine, University of Western Australia, Crawley, Western Australia, Australia, 37High Performance Computing and Network, CRS4, Parco Tecnologico della Sardegna, Pula, Italy,38Center for Statistical Genetics, Department of Biostatistics, University of Michigan, Ann Arbor, Michigan, United States of America,39Department of Chronic Disease Prevention, National Institute for Health and Welfare, Helsinki, Finland,40Vaasa Health Care Centre, Diabetes Unit, Vaasa, Finland,41Department of Respiratory Medicine, Sir Charles Gairdner Hospital, Nedlands, Western Australia,
Australia,42Institute for Molecular Medicine Finland (FIMM), University of Helsinki, Helsinki, Finland,43Institute of Human Genetics, Helmholtz Zentrum Munich, Munich, Germany,44Institute of Human Genetics, Technische Universita¨t Mu¨nchen, Munich, Germany,45Department of Cardiology and Internal Medicine, University Hospital Ghent and Faculty of Medicine, Ghent University, Ghent, Belgium,46Wellcome Trust Sanger Institute, Wellcome Trust Genome Campus, Cambridge, United Kingdom, 47Department of Medical Genetics, University of Helsinki and University Central Hospital, Helsinki, Finland,48Diagnostica Stago, Doncaster, Victoria, Australia, 49Institute for Translational Genomics and Population Sciences, Los Angeles Biomedical Research Institute, Torrance, California, United States of America,50Department of Pediatrics, Harbor-UCLA Medical Center, Torrance, California, United States of America,51Institute for Community Medicine, University Medicine Greifswald, Greifswald, Germany, 52Department of Twin Research and Genetic Epidemiology, King’s College London, London, United Kingdom,53School of Clinical and Experimental Medicine, College of Medical and Dental Sciences, Univeristy of Birmingham, Edgbaston, Birmingham, United Kingdom,54Diabetes, Endocrinology and Vascular Health Centre, Royal Devon and Exeter NHS Foundation Trust, Exeter, United Kingdom,55BIOBIX Lab. for Bioinformatics and Computational Genomics, Dept. of Mathematical Modelling, Statistics and Bioinformatics. Faculty of Bioscience Engineering, Ghent University, Ghent, Belgium,56Faculty of Health Science, University of Copenhagen, Copenhagen, Denmark,57Department of General Practice and Primary Health Care, University of Helsinki, Helsinki, Finland,58Helsinki University Central Hospital, Unit of General Practice, Helsinki, Finland,59Folkhalsan Research Centre, Helsinki, Finland,60Vasa Central Hospital, Vasa, Finland,61Curtin Health Innovation Research Institute, Curtin University of Technology, Bentley, Western Australia, Australia,62Institute of Epidemiology I, Helmholtz Zentrum Munich, Munich, Germany, 63Group Health Research Institute, Group Health Cooperative, Seattle, Washington, United States of America, 64Department of Internal Medicine, Diabetes & Endocrinology Unit, San Raffaele Scientific Institute and Vita-Salute San Raffaele University, Milan, Italy,65Laboratory of Genetics, National Institute on Aging, Baltimore, Maryland, United States of America, 66Institute for Maternal and Child Health - IRCCS ‘‘Burlo Garofolo’’, Trieste, Italy, 67University of Trieste, Trieste, Italy, 68Biopharmacy, Department of Pharmaceutical Sciences, University Basel, Basel, Switzerland,69Netherlands Consortium for Healthy Aging, Netherlands Genomics Initiative, Leiden, The Netherlands,70Department of Internal Medicine, VU Medical Center, Amsterdam, The Netherlands,71Division of Endocrinology, Diabetes, and Metabolism, Perelman School of Medicine at the University of Pennsylvania, Philadelphia, Pennsylvania, United States of America,72Institute of Molecular Genetics-CNR, Pavia, Italy
Abstract
Autoimmune thyroid diseases (AITD) are common, affecting 2-5% of the general population. Individuals with positive thyroid peroxidase antibodies (TPOAbs) have an increased risk of autoimmune hypothyroidism (Hashimoto’s thyroiditis), as well as autoimmune hyperthyroidism (Graves’ disease). As the possible causative genes of TPOAbs and AITD remain largely unknown, we performed GWAS meta-analyses in 18,297 individuals for TPOAb-positivity (1769 TPOAb-positives and 16,528 TPOAb-negatives) and in 12,353 individuals for TPOAb serum levels, with replication in 8,990 individuals. Significant associations (P,561028) were detected atTPO-rs11675434,ATXN2-rs653178, andBACH2-rs10944479 for TPOAb-positivity,
and atTPO-rs11675434,MAGI3-rs1230666, andKALRN-rs2010099 for TPOAb levels. Individual and combined effects (genetic risk scores) of these variants on (subclinical) hypo- and hyperthyroidism, goiter and thyroid cancer were studied. Individuals with a high genetic risk score had, besides an increased risk of TPOAb-positivity (OR: 2.18, 95% CI 1.68–2.81,P= 8.161028), a
higher risk of increased thyroid-stimulating hormone levels (OR: 1.51, 95% CI 1.26–1.82,P= 2.961026), as well as a decreased
risk of goiter (OR: 0.77, 95% CI 0.66–0.89,P= 6.561024). TheMAGI3andBACH2variants were associated with an increased
risk of hyperthyroidism, which was replicated in an independent cohort of patients with Graves’ disease (OR: 1.37, 95% CI 1.22–1.54, P= 1.261027 and OR: 1.25, 95% CI 1.12–1.39, P= 6.261025). The MAGI3 variant was also associated with an
increased risk of hypothyroidism (OR: 1.57, 95% CI 1.18–2.10, P= 1.961023). This first GWAS meta-analysis for TPOAbs
identified five newly associated loci, three of which were also associated with clinical thyroid disease. With these markers we identified a large subgroup in the general population with a substantially increased risk of TPOAbs. The results provide insight into why individuals with thyroid autoimmunity do or do not eventually develop thyroid disease, and these markers may therefore predict which TPOAb-positives are particularly at risk of developing clinical thyroid dysfunction.
Citation:Medici M, Porcu E, Pistis G, Teumer A, Brown SJ, et al. (2014) Identification of Novel Genetic Loci Associated with Thyroid Peroxidase Antibodies and Clinical Thyroid Disease. PLoS Genet 10(2): e1004123. doi:10.1371/journal.pgen.1004123
Editor:Chris Cotsapas, Yale School of Medicine, United States of America
ReceivedAugust 22, 2013;AcceptedDecember 3, 2013;PublishedFebruary 27, 2014
This is an open-access article, free of all copyright, and may be freely reproduced, distributed, transmitted, modified, built upon, or otherwise used by anyone for any lawful purpose. The work is made available under the Creative Commons CC0 public domain dedication.
Funding:The Asklepios Study was supported by a Fonds voor Wetenschappelijk Onderzoek–Vlaanderen FWO research grant G.0427.03 and G.0838.10N (Asklepios Study). The 1994-5 Busselton Health Survey was funded by Healthway, Western Australia. The Busselton Health Studies are supported by the National Health and Medical Research Council of Australia and the Great Wine Estates Auctions. The CHS research reported in this article was supported by NHLBI contracts HHSN268201200036C, N01HC85239, N01HC55222, N01HC85079, N01HC85080, N01HC85081, N01HC85082, N01HC85083, N01HC85086; and NHLBI grants HL080295, HL087652, HL105756 with additional contribution from the National Institute of Neurological Disorders and Stroke (NINDS). Additional support was provided through AG023629 from the National Institute on Aging (NIA). DNA handling and genotyping at Cedars-Sinai Medical Center was supported in part by the National Center for Research Resources, grant UL1RR033176, and is now at the National Center for Advancing Translational Sciences, CTSI grant UL1TR000124; in addition to the National Institute of Diabetes and Digestive and Kidney Disease grant DK063491 to the Southern California Diabetes Endocrinology Research Center. Additional funding was provided by the Cedars-Sinai Board of Governors’ Chair in Medical Genetics (JIR). The CARLA Study was founded by a grant from the Deutsche Forschungsgemeinschaft as part of the Collaborative Research Center 598 ‘‘Heart failure in the elderly - cellular mechanisms and therapy’’ at the Medical Faculty of the Martin-Luther-University Halle-Wittenberg, by a grant of the Wilhelm-Roux Programme of the Martin-Luther-University Halle-Wittenberg; by the Ministry of Education and Cultural Affairs of Saxony-Anhalt, and by the Federal Employment Office. The Exeter Family Study of Childhood Health (EFSOCH) was supported by South West NHS Research and Development, Exeter NHS Research and Development, the Darlington Trust, and the Peninsula NIHR Clinical Research Facility at the University of Exeter. Genotyping of EFSOCH DNA samples was supported by the Endocrine Research Fund. ATH and BMS are employed as core members of the Peninsula NIHR Clinical Research Facility. RMF is funded by a Sir Henry Wellcome Postdoctoral Fellowship (Wellcome Trust grant: 085541/Z/ 08/Z). The Health2006 Study is funded by grants from The Velux Foundation; The Danish Medical Research Council, Danish Agency for Science, Technology and Innovation; The Aase and Ejner Danielsens Foundation; ALK-Abello´ A/S (Hørsholm, Denmark), Timber Merchant Vilhelm Bangs Foundation, MEKOS Laboratories (Denmark), the Health Insurance Foundation, and Research Centre for Prevention and Health, the Capital Region of Denmark. Helsinki Birth Cohort Study has been supported by grants from the Academy of Finland, the Finnish Diabetes Research Society, Finnish Society for Cardiovascular Research, Folkha¨lsan Research Foundation, Novo Nordisk Foundation, Finska La¨karesa¨llskapet, Signe and Ane Gyllenberg Foundation, University of Helsinki, European Science Foundation (EUROSTRESS), Ministry of Education, Ahokas Foundation, Emil Aaltonen Foundation, Juho Vainio Foundation, and Wellcome Trust (grant number WT089062). This work was supported by KORA, which is a research platform initiated and financed by the Helmholtz Center Munich, German Research Center for
Novel Thyroid Antibody and Disease Loci
Environmental Health, by the German Federal Ministry of Education and Research and by the State of Bavaria. The work of KORA is supported by the German Federal Ministry of Education and Research (BMBF) in the context of the German National Genome Research Network (NGFN-2 and NGFN-plus). The present research was supported within the Munich Center of Health Sciences (MC Health) as part of LMUinnovativ. Thyroid examinations in KORA-F4 were supported by Sanofi-Aventis in the framework of the Papillon Initiative. Collection and genotyping of the NBS samples was funded in part by the European Commission (POLYGENE: LSHC-CT-2005-018827) and a research investment grant of the Radboud University Nijmegen Medical Centre. This work was sponsored by the National Computing Facilities Foundation (NCF) for the use of supercomputer facilities, with financial support from the NWO. The Thyroid Cancer Program (P.I. Matthew Ringel) at the Ohio State University is supported by grants P30 CA16058 and P01 CA124570 from the National Cancer Institute, USA. The generation and management of GWAS genotype data for the Rotterdam Study is supported by the Netherlands Organisation of Scientific Research NWO Investments (no. 175.010.2005.011, 911-03-012). This study is funded by the Research Institute for Diseases in the Elderly (014-93-015; RIDE2), the Netherlands Genomics Initiative (NGI)/Netherlands Organisation for Scientific Research (NWO) project no. 050-060-810. The Rotterdam Study is funded by Erasmus Medical Center and Erasmus University, Rotterdam, Netherlands Organization for the Health Research and Development (ZonMw), the Research Institute for Diseases in the Elderly (RIDE), the Ministry of Education, Culture and Science, the Ministry for Health, Welfare and Sports, the European Commission (DG XII), and the Municipality of Rotterdam. The SardiNIA study is supported by the Intramural Research Program of the National Institute on Aging (NIA), National Institutes of Health (NIH). The SardiNIA (‘‘Progenia’’) team was supported by Contract NO1-AG-1–2109 from the NIA; the efforts of SS were supported in part by contract 263-MA-410953 from the NIA to the University of Michigan and by research grant HG002651. SHIP is part of the Community Medicine Research net of the University of Greifswald, Germany, which is funded by the Federal Ministry of Education and Research (grants no. 01ZZ9603, 01ZZ0103, and 01ZZ0403), the Ministry of Cultural Affairs as well as the Social Ministry of the Federal State of Mecklenburg-West Pomerania, and the network ‘Greifswald Approach to Individualized Medicine (GANI_MED)’ funded by the Federal Ministry of Education and Research (grant 03IS2061A). Genome-wide data have been supported by the Federal Ministry of Education and Research (grant no. 03ZIK012) and a joint grant from Siemens Healthcare, Erlangen, Germany and the Federal State of Mecklenburg-West Pomerania. Data analyses were further supported by the German Research Foundation (DFG Vo 955/10-2; SPP 1629: THYROID TRANS ACT WA 1328/5-1) and the Federal Ministry of Nutrition, Agriculture and Consumer’s Safety (BMELV 07 HS 003). SHIP-Trend is part of the Community Medicine Research net of the University of Greifswald, Germany, which is funded by the Federal Ministry of Education and Research (grants no. 01ZZ9603, 01ZZ0103, and 01ZZ0403), the Ministry of Cultural Affairs as well as the Social Ministry of the Federal State of Mecklenburg - West Pomerania. Thyroid-related examinations have been funded by the Federal Ministry of Nutrition, Agriculture and Consumer’s Safety (BMELV 07 HS 003) and the German Research Foundation (DFG Vo 955/10-1; SPP 1629: THYROID TRANS ACT WA 1328/5-1). Genome-wide data have been supported by the Federal Ministry of Education and Research (grant no. 03ZIK012) and a joint grant from Siemens Healthcare, Erlangen, Germany and the Federal State of Mecklenburg, West Pomerania. Whole-body MR imaging was supported by a joint grant from Siemens Healthcare, Erlangen, Germany and the Federal State of Mecklenburg West Pomerania. TwinsUK received funding from the Wellcome Trust; the Chronic Disease Research Foundation; the European Community’s Seventh Framework Program grant agreement (FP7/2007-2013); ENGAGE project grant agreement (HEALTH-F4-2007-201413); the Department of Health via the National Institute for Health Research (NIHR) Comprehensive Biomedical Research Centre award to Guy’s & St Thomas’ NHS Foundation Trust in partnership with King’s College London; the Canadian Institutes of Health Research, Canadian Foundation for Innovation, Fonds de la Recherche en Sante´ Que´bec, Ministe`re du De´veloppement E´conomique, de l9Innovation et de l9Exportation Que´bec and the Lady Davis Institute of the Jewish General Hospital; the Australian National Health and Medical Research Council (Project Grants 1010494, 1031422) and the Sir Charles Gairdner Hospital Research Fund. Val Borbera was supported by funds from Compagnia di San Paolo, Torino, Italy; Fondazione Cariplo, Italy and Ministry of Health, Ricerca Finalizzata 2008. The UK Graves’ disease cohort was funded by the Wellcome Trust grant 068181. The funders had no role in study design, data collection and analysis, decision to publish, or preparation of the manuscript.
Competing Interests:I have read the journal’s policy and have the following conflicts: Dr. Bruce M Psaty reported serving on a DSMB for a clinical trial of a device funded by the manufacturer (Zoll LifeCor) and on the Yale Open Data Access Project funded by Medtronic. All other authors have declared that no competing interests exist.
* E-mail: [email protected]
.These authors contributed equally to this work.
"SS, SN and RPP also contributed equally to this work.
Introduction
Autoimmune thyroid disease (AITD), including Hashimoto’s thyroiditis and Graves’ disease, is one of the most common autoimmune diseases, affecting 2–5% of the general population [1,2,3]. Thyroid dysfunction has been associated with osteoporosis, depression, atrial fibrillation, heart failure, metabolic syndrome, and mortality [4,5,6,7,8,9,10,11]. High serum antibodies against the enzyme thyroid peroxidase (TPO), which is located in the thyroid and plays a key role in thyroid hormone synthesis, are present in 90% of patients with Hashimoto’s thyroiditis [12,13], the most frequent cause of hypothyroidism and goiter. Although TPO antibodies (TPOAbs) are a useful clinical marker for the detection of early AITD, it remains controversial if these antibodies play a causative role in the pathogenesis of Hashimoto’s thyroiditis [14,15,16].
Interestingly, TPOAb-positive persons also have an increased risk of developing autoimmune hyperthyroidism (Graves’ disease) [17,18], which is caused by stimulating antibodies against the thyroid stimulating hormone (TSH) receptor [19]. Numerous studies have shown that Graves’ hyperthyroidism and Hashimoto’s thyroiditis show co-inheritance [17,20,21]. Finally, thyroid auto-immunity is the most common autoimmune disorder in women of childbearing age, and TPOAb-positive women have an increased risk of developing pregnancy complications such as miscarriage and pre-term delivery [17,18,22,23,24,25,26].
The prevalence of TPOAb-positivity in the general population ranges from 5–24%, but it is currently unknown why these people develop TPOAbs, nor is it known why not all individuals with thyroid autoimmunity develop clinical thyroid disease [27,28]. It is estimated that around 70% of the susceptibility to develop thyroid autoantibodies is due to genetic factors [29]. In this context it is remarkable to note that little is known about the genetic factors that determine TPOAb-positivity and the risk of AITD.
We therefore performed a genome wide association study (GWAS) meta-analysis for TPOAbs in the general population in 18,297 individuals from 11 populations. Newly identified genetic variants were studied in relation to subclinical and overt hypo- and hyperthyroidism, goiter, thyroid autoimmunity during pregnancy and thyroid cancer risk.
Results
Characteristics of the studied populations are shown in Table 1 and the Supplementary Material S1. Heritability estimates in the family-based cohorts SardiNIA, TwinsUK and Val Borbera were, respectively, 0.65, 0.66, and 0.54 for TPOAb-positivity, and 0.43, 0.66, and 0.30 for TPOAb levels.
Loci associated with TPOAb-positivity and TPOAb levels
See Table 1 and Supplementary Figure S1 for TPOAb measurements and Supplementary Table S1 for genotyping procedures. In most autoimmune diseases, both the presence and the level of autoantibodies are relevant for the disease onset [18,30,31]. Furthermore, different pathophysiological processes may be involved in the initiation and severity of the autoimmune response. We therefore performed a GWAS on TPOAb-positivity (including 1769 TPOAb-positives and 16,528 TPOAb–negatives), as well as a GWAS on continuous TPOAb levels (including 12,353 individuals) in stage 1. See Supplementary Figures S2 and S3 for QQ (quantile-quantile) and Manhattan plots.
In stage 2, we followed-up 20 stage 1 SNPs (P,561026; 13 TPOAb-positivity and 10 TPOAb level SNPs, with 3 SNPs overlapping) in 5 populations, including up to 8,990 individuals for TPOAb-positivity (922 TPOAb-positives and 8068 TPOAb– negatives) and 8,159 individuals for TPOAb level analyses (see Supplementary Material S1). Results of the combined stage 1 and 2
Novel Thyroid Antibody and Disease Loci
meta-analyses, including heterogeneity analyses, are shown in Supplementary Tables S2 and S3. Regional association plots are shown in Supplementary Figures S4 and S5. In the combined stage 1 and 2 meta-analyses GWAS significant associations (P,561028) were observed nearTPO(Chr 2p25; rs11675434), atATXN2(Chr 12q24.1; rs653178), and BACH2 (Chr 6q15; rs10944479) for TPOAb-positivity, and near TPO (rs11675434), at MAGI3 (Chr 6q15; rs1230666), andKALRN(Chr 3q21; rs2010099) for TPOAb levels (Table 2 and Figure 1). The TPOAb level meta-analysis P-values for the 3 GWAS significant TPOAb-positivity loci were:
TPO-rs11675434: P= 7.4610213, ATXN2-rs653178: P= 1.361027,
and
BACH2-rs10944479:P= 2.061024.
As the 3 GWAS significant loci for TPOAb levels also showed associations with TPOAb-positivity (TPO-rs11675434: OR, 1.21 [95% CI, 1.15–1.28)], P= 1.5610216; MAGI3-rs1230666: OR,
1.23 [95% CI, 1.14–1.33],P= 1.561026;KALRN-rs2010099:OR,
1.24 [95% CI, 1.12–1.37], P= 7.461025), we subsequently
studied the (combined) effects of these 5 SNPs on clinical thyroid disease. Genetic risk scores were calculated as described in the Supplementary Material. The variance explained by these 5 SNPs was 3.1% for TPOAb-positivity and 3.2% for TPOAb levels. Subjects with a high genetic risk score had a 2.2 times increased risk of TPOAb-positivity compared to subjects with a low genetic risk score (P= 8.161028) (Table 3).
Table S4 shows the stage 1 TPOAb-positivity and TPOAb level meta-analyses results for GWAS significant SNPs reported in previous GWAS on thyroid related phenotypes.
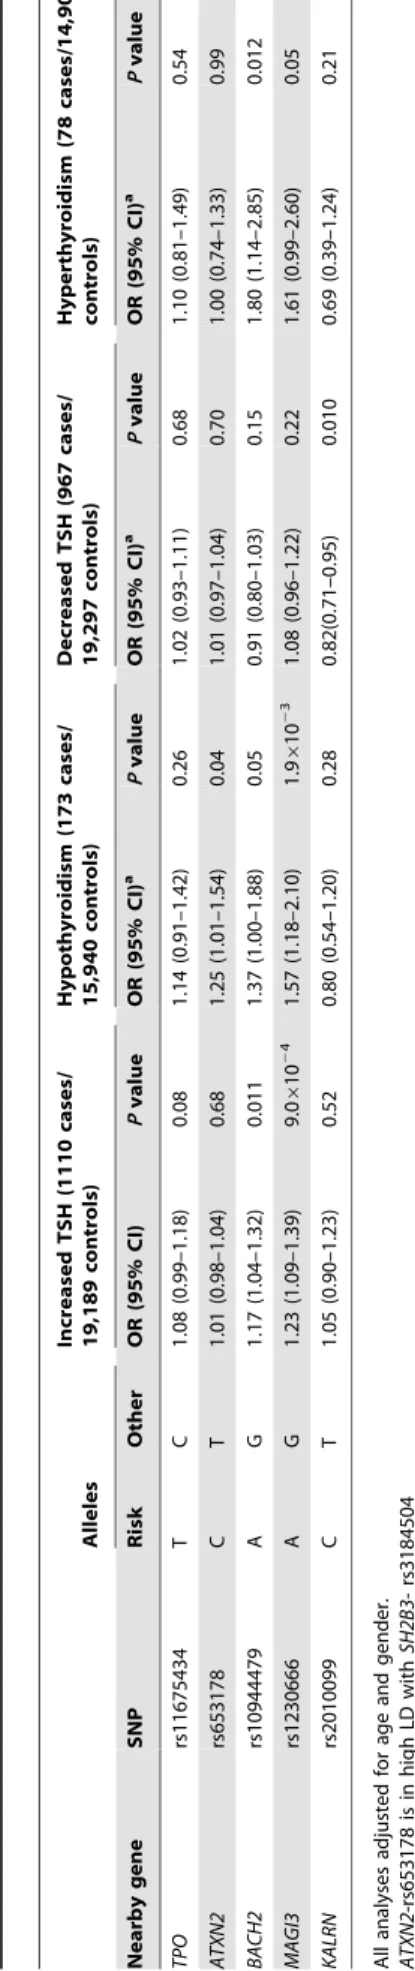
Associations with hypo- and hyperthyroidism
The associations between the 5 GWAS significant SNPs and the risk of abnormal thyroid function tests are shown in Table 4. MAGI3- rs1230666 was associated with an increased risk of overt hypothyroidism and increased TSH levels below the Bonferroni threshold (i.e., P =0.05/5 = 0.01). Borderline significant signals were observed at BACH2- rs10944479 with a higher risk of
increased TSH levels as well as overt hyperthyroidism (P =0.011 andP =0.012), and at the KALRN-rs2010099 SNP with a lower risk of decreased TSH levels (P =0.010).
Furthermore, a higher genetic risk score was associated with a higher risk of increased TSH levels (Supplementary Table S5). No effects of the genetic risk score on the risk of overt hypothyroidism, hyperthyroidism or decreased TSH levels were observed.
Associations with goiter
Individuals with a high genetic risk score had a 30.4% risk of sonographically-proven goiter, compared to 35.2% in subjects with a low score (P= 6.561024) (Table 5). None of the individual
SNPs was significantly associated with goiter risk.
Thyroid autoimmunity during pregnancy
As autoimmunity significantly changes during pregnancy [25], we additionally studied these effects in an independent pregnant population. Pregnant women with a high genetic risk score had a 2.4 times increased risk of TPOAb-positivity compared to women with a low score (10.3% vs 4.8%,P= 0.03). These women did not have a higher risk of increased TSH levels. However, a borderline significant signal with a lower risk of increased TSH levels was observed atATXN2- rs653178 (OR, 0.54 [95% CI, 0.34–0.87], P= 0.012).
Associations with thyroid disease in independent populations
a) Graves’ disease. As MAGI3- rs1230666 and BACH2-rs10944479 showed promising associations (i.e., P#0.05) with hyperthyroidism in our meta-analyses, we tested these SNPs in an independent population of 2478 patients with Graves’ disease and 2682 controls (see Supplementary Material for further details). Both were associated with an increased risk of Graves’ disease (MAGI3-rs1230666: OR, 1.37 [95% CI, 1.22–1.54];P= 1.261027; BACH2-rs10944479: OR, 1.25 [1.12–1.39];P= 6.261025).
b) Thyroid cancer. Supplementary Table S6 shows the associations of the 5 GWAS significant SNPs with thyroid cancer. No statistically significant associations were detected, but a borderline significant signal with an increased risk of thyroid cancer was observed atATXN2- rs653178 (OR, 1.32 [95% CI, 1.02–1.70],P= 0.03).
Pathway analyses
Ingenuity Pathway Analyses (IPA; Ingenuity Systems, Ca, USA) and GRAIL analyses [32] were performed to identify potential pathways involved in AITD, the results of which are shown in Supplementary Tables S7 and S8, and Figure S6. The identified top pathways involved cell death, survival, movement, and OX40 signalling.
Discussion
This is the first GWAS meta-analysis investigating the genetics of TPOAbs in the normal population in up to 18,297 individuals from 11 populations with replication in up to 8,990 individuals from 5 populations. We identified 5 GWAS significant loci associated with TPOAb-positivity and/or levels.
The most significant hit for both TPOAb-positivity and TPOAb levels was located near theTPOgene itself. TPO is a membrane-bound protein located on the apical membranes of the thyroid follicular cell, catalyzing key reactions in thyroid hormone synthesis [33]. Mutations in TPO have been found in patients with congenital hypothyroidism [34,35]. Although TPOAbs are Author Summary
Individuals with thyroid peroxidase antibodies (TPOAbs) have an increased risk of autoimmune thyroid diseases (AITD), which are common in the general population and associated with increased cardiovascular, metabolic and psychiatric morbidity and mortality. As the causative genes of TPOAbs and AITD remain largely unknown, we performed a genome-wide scan for TPOAbs in 18,297 individuals, with replication in 8,990 individuals. Significant associations were detected with variants atTPO, ATXN2, BACH2, MAGI3, and KALRN. Individuals carrying multiple risk variants also had a higher risk of increased thyroid-stimulating hormone levels (including subclinical and overt hypothyroidism), and a decreased risk of goiter. TheMAGI3 andBACH2variants were associated with an increased risk of hyperthyroidism, and the MAGI3 variant was also associated with an increased risk of hypothyroidism. This first genome-wide scan for TPOAbs identified five newly associated loci, three of which were also associated with clinical thyroid disease. With these markers we identified a large subgroup in the general population with a substan-tially increased risk of TPOAbs. These results provide insight into why individuals with thyroid autoimmunity do or do not eventually develop thyroid disease, and these markers may therefore predict which individuals are particularly at risk of developing clinical thyroid dysfunc-tion.
Novel Thyroid Antibody and Disease Loci
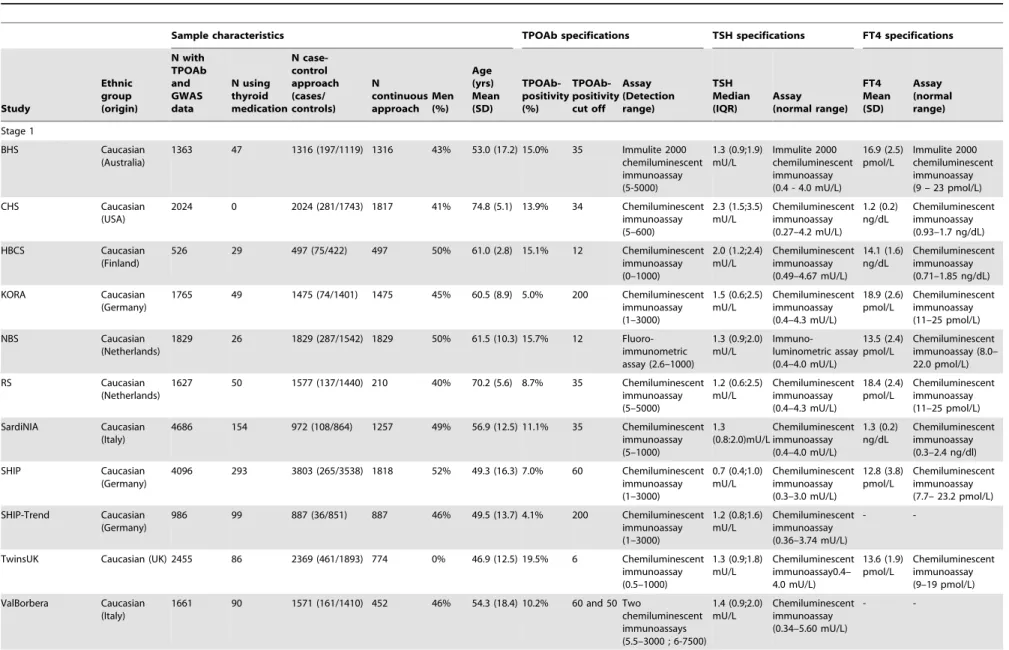
Table 1.Population characteristics and serum TPOAb, TSH, and FT4 level measurements specifications.
Sample characteristics TPOAb specifications TSH specifications FT4 specifications
Study Ethnic group (origin) N with TPOAb and GWAS data N using thyroid medication N case-control approach (cases/ controls) N continuous approach Men (%) Age (yrs) Mean (SD) TPOAb-positivity (%) TPOAb-positivity cut off Assay (Detection range) TSH Median (IQR) Assay (normal range) FT4 Mean (SD) Assay (normal range) Stage 1 BHS Caucasian (Australia)
1363 47 1316 (197/1119) 1316 43% 53.0 (17.2) 15.0% 35 Immulite 2000
chemiluminescent immunoassay (5-5000) 1.3 (0.9;1.9) mU/L Immulite 2000 chemiluminescent immunoassay (0.4 - 4.0 mU/L)
16.9 (2.5) pmol/L
Immulite 2000 chemiluminescent immunoassay (9 – 23 pmol/L)
CHS Caucasian
(USA)
2024 0 2024 (281/1743) 1817 41% 74.8 (5.1) 13.9% 34 Chemiluminescent
immunoassay (5–600) 2.3 (1.5;3.5) mU/L Chemiluminescent immunoassay (0.27–4.2 mU/L) 1.2 (0.2) ng/dL Chemiluminescent immunoassay (0.93–1.7 ng/dL) HBCS Caucasian (Finland)
526 29 497 (75/422) 497 50% 61.0 (2.8) 15.1% 12 Chemiluminescent
immunoassay (0–1000) 2.0 (1.2;2.4) mU/L Chemiluminescent immunoassay (0.49–4.67 mU/L) 14.1 (1.6) ng/dL Chemiluminescent immunoassay (0.71–1.85 ng/dL) KORA Caucasian (Germany)
1765 49 1475 (74/1401) 1475 45% 60.5 (8.9) 5.0% 200 Chemiluminescent
immunoassay (1–3000) 1.5 (0.6;2.5) mU/L Chemiluminescent immunoassay (0.4–4.3 mU/L) 18.9 (2.6) pmol/L Chemiluminescent immunoassay (11–25 pmol/L) NBS Caucasian (Netherlands)
1829 26 1829 (287/1542) 1829 50% 61.5 (10.3) 15.7% 12
Fluoro-immunometric assay (2.6–1000) 1.3 (0.9;2.0) mU/L Immuno-luminometric assay (0.4–4.0 mU/L) 13.5 (2.4) pmol/L Chemiluminescent immunoassay (8.0– 22.0 pmol/L) RS Caucasian (Netherlands)
1627 50 1577 (137/1440) 210 40% 70.2 (5.6) 8.7% 35 Chemiluminescent
immunoassay (5–5000) 1.2 (0.6:2.5) mU/L Chemiluminescent immunoassay (0.4–4.3 mU/L) 18.4 (2.4) pmol/L Chemiluminescent immunoassay (11–25 pmol/L) SardiNIA Caucasian (Italy)
4686 154 972 (108/864) 1257 49% 56.9 (12.5) 11.1% 35 Chemiluminescent
immunoassay (5–1000) 1.3 (0.8:2.0)mU/L Chemiluminescent immunoassay (0.4–4.0 mU/L) 1.3 (0.2) ng/dL Chemiluminescent immunoassay (0.3–2.4 ng/dl) SHIP Caucasian (Germany)
4096 293 3803 (265/3538) 1818 52% 49.3 (16.3) 7.0% 60 Chemiluminescent
immunoassay (1–3000) 0.7 (0.4;1.0) mU/L Chemiluminescent immunoassay (0.3–3.0 mU/L) 12.8 (3.8) pmol/L Chemiluminescent immunoassay (7.7– 23.2 pmol/L)
SHIP-Trend Caucasian
(Germany)
986 99 887 (36/851) 887 46% 49.5 (13.7) 4.1% 200 Chemiluminescent
immunoassay (1–3000) 1.2 (0.8;1.6) mU/L Chemiluminescent immunoassay (0.36–3.74 mU/L) -
-TwinsUK Caucasian (UK) 2455 86 2369 (461/1893) 774 0% 46.9 (12.5) 19.5% 6 Chemiluminescent
immunoassay (0.5–1000) 1.3 (0.9;1.8) mU/L Chemiluminescent immunoassay0.4– 4.0 mU/L) 13.6 (1.9) pmol/L Chemiluminescent immunoassay (9–19 pmol/L) ValBorbera Caucasian (Italy)
1661 90 1571 (161/1410) 452 46% 54.3 (18.4) 10.2% 60 and 50 Two
chemiluminescent immunoassays (5.5–3000 ; 6-7500)
1.4 (0.9;2.0) mU/L Chemiluminescent immunoassay (0.34–5.60 mU/L) -
-Sample characteristics TPOAb specifications TSH specifications FT4 specifications
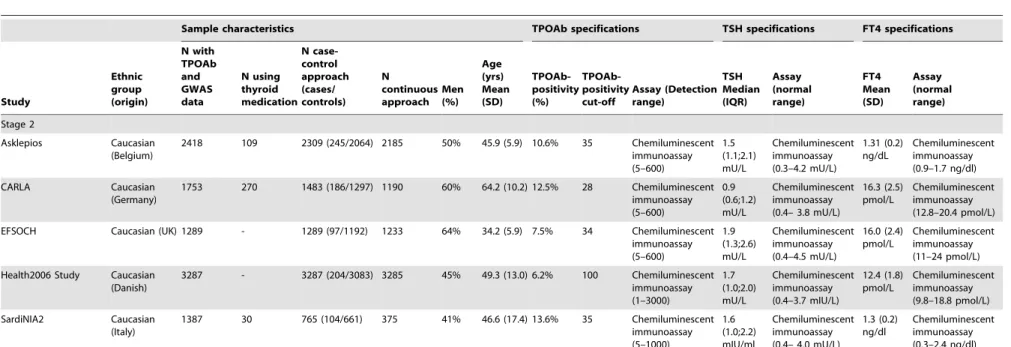
Table 1.Cont.
Sample characteristics TPOAb specifications TSH specifications FT4 specifications
Study
Ethnic group (origin)
N with TPOAb and GWAS data
N using thyroid medication
N case-control approach (cases/ controls)
N continuous approach
Men (%)
Age (yrs) Mean (SD)
TPOAb-positivity (%)
TPOAb-positivity cut-off
Assay (Detection range)
TSH Median (IQR)
Assay (normal range)
FT4 Mean (SD)
Assay (normal range)
Stage 2
Asklepios Caucasian
(Belgium)
2418 109 2309 (245/2064) 2185 50% 45.9 (5.9) 10.6% 35 Chemiluminescent
immunoassay (5–600)
1.5 (1.1;2.1) mU/L
Chemiluminescent immunoassay (0.3–4.2 mU/L)
1.31 (0.2) ng/dL
Chemiluminescent immunoassay (0.9–1.7 ng/dl)
CARLA Caucasian
(Germany)
1753 270 1483 (186/1297) 1190 60% 64.2 (10.2) 12.5% 28 Chemiluminescent
immunoassay (5–600)
0.9 (0.6;1.2) mU/L
Chemiluminescent immunoassay (0.4– 3.8 mU/L)
16.3 (2.5) pmol/L
Chemiluminescent immunoassay (12.8–20.4 pmol/L)
EFSOCH Caucasian (UK) 1289 - 1289 (97/1192) 1233 64% 34.2 (5.9) 7.5% 34 Chemiluminescent
immunoassay (5–600)
1.9 (1.3;2.6) mU/L
Chemiluminescent immunoassay (0.4–4.5 mU/L)
16.0 (2.4) pmol/L
Chemiluminescent immunoassay (11–24 pmol/L)
Health2006 Study Caucasian
(Danish)
3287 - 3287 (204/3083) 3285 45% 49.3 (13.0) 6.2% 100 Chemiluminescent
immunoassay (1–3000)
1.7 (1.0;2.0) mU/L
Chemiluminescent immunoassay (0.4–3.7 mIU/L)
12.4 (1.8) pmol/L
Chemiluminescent immunoassay (9.8–18.8 pmol/L)
SardiNIA2 Caucasian
(Italy)
1387 30 765 (104/661) 375 41% 46.6 (17.4) 13.6% 35 Chemiluminescent
immunoassay (5–1000)
1.6 (1.0;2.2) mIU/ml
Chemiluminescent immunoassay (0.4– 4.0 mU/L)
1.3 (0.2) ng/dl
Chemiluminescent immunoassay (0.3–2.4 ng/dl)
doi:10.1371/journal.pgen.1004123.t001
Novel
Thyroid
Antibody
and
Disease
Loci
PLOS
Genetics
|
www.plosgen
etics.org
6
February
2014
|
Volume
10
|
Issue
2
|
valid clinical biomarkers of AITD, they are generally considered to be secondary to the thyroid damage inflicted by T-cells.
TheFOXE1gene has been previously associated with
hypothy-roidism [36,37] and is known to regulate transcription of TPO [38]. In this context it is interesting to note that we did not find any associations of the variant nearTPOwith hypothyroidism. Most genes that have been associated with AITD (predominantly Graves’ disease) by candidate gene and GWAS studies so far are located in the HLA class I and II regions, or in genes involved in T-cell (i.e., CTLA-4, PTPN22) or other autoimmune responses [28,39]. Until now, theTPOgene itself had not been associated with AITD, except in one recent candidate gene analysis in a small cohort (n = 188) without replication [40]. A variant near TPO (rs11694732), which is in LD with rs11675434 (r2 = 0.97 in HapMap2), has previously been associated with TSH levels by Gudmundsson et al [41]. However, various other GWAS on serum TSH and FT4 levels have not found any significant associations in or near this locus, including a recent similar sized GWAS by Porcu et al [42].
Three of the other four loci identified here are located in or are in linkage disequilibrium (LD) with genes previously associated with other autoimmune diseases. Rs1230666 is located in intron 9 of MAGI3, encoding a protein that modulates activity of AKT/PKB. AKT/PKB is expressed in the thyroid and regulates apoptosis [43], which seems to play an important role in the development of AITD [44,45]. In addition, rs1230666 is in LD with rs2476601 (r2 = 0.70 in HapMap2), a variant causing a R620W substitution in PTPN22. PTPN22 is a lymphoid-specific intracellular phosphatase involved in the T-cell receptor signaling pathway. Variations in PTPN22, and specifically R620W, are associated with various autoimmune disorders including type 1 diabetes, rheumatoid arthritis, systemic lupus erythematosus and Graves’ disease [46,47,48,49]. The associ-ations of theMAGI3locus with TPOAb-positivity and Graves’ disease may therefore also be explained by linkage with disease-associated variants inPTPN22[50]. Of note, the association signal at rs2476601 is one order weaker than that of the top variant rs1230666.
TheBACH2locus has been implicated in the susceptibility to
several autoimmune diseases, including celiac disease, type 1 diabetes, vitiligo, Crohn’s disease, and multiple sclerosis
[46,51,52,53,54]. A recent candidate gene analysis associated the
BACH2 locus with an increased risk of AITD, including
Hashimoto’s thyroiditis and Graves’ disease [55]. However, the associations were not significant when Hashimoto’s thyroiditis and Graves’ disease were studied separately. BACH2 is specifically expressed in early stages of B-cell differentiation and represses different immunoglobulin genes [56]. Interestingly, BACH2 can bind to the co-repressor SMRT (silencing mediator of retinoid and thyroid receptor), which may suggest a more direct effect on thyroid hormone secretion and action as well.
Polymorphisms in ATXN2have been associated with multiple neurodegenerative diseases, including spinocerebellar ataxia and Parkinson’s disease [57,58,59]. Different epidemiological studies have associated thyroid dysfunction with cerebellar ataxia [60,61]. Furthermore, the identified SNP in ATXN2has been previously associated with renal function, serum urate levels and blood pressure [62,63,64]. However, this SNP is in high LD with rs3184504 (r2 = 0.873), a variant causing a Trp262Arg substitu-tion ofSH2B adaptor protein 3(SH2B3).SH2B3encodes the adaptor protein LNK, a key negative regulator of cytokine signaling playing a critical role in hematopoiesis. This variant is associated with susceptibility to several autoimmune diseases, including celiac disease, type 1 diabetes, vitiligo, and rheumatoid arthritis [46,51,53,65], suggesting more relevance for TPOAb levels than ATXN2. This is supported by a recent study which showed that variants in LD withSH2B3,BACH2, andPTPN22are associated with TPOAb levels in patients with type 1 diabetes [66].
Whereas the above four loci are located in genes involved in the immune response or the autoantigen, the KALRN (Kalirin) gene encodes a multi-domain guanine nucleotide exchange factor for GTP-binding proteins of the Rho family. The relation ofKALRN with levels of TPOAbs is unclear. This gene has recently been found to be associated with megakaryopoiesis and platelet formation [67], which may suggest a function in the immune system [68]. We furthermore performed pathway analyses on the stage 1 TPOAb-positivity and TPOAb level lead SNPs, and identified the cell death, survival and movement pathway as an important pathway for TPOAbs. This finding is supported by previous studies, which show an important role for apoptosis in the Table 2.Newly identified loci associated with TPOAb-positivity and/or serum TPOAb levels reaching genome wide significance.
Alleles
Stage 1+2 meta-analysis: up to 2691 cases and 24,596 controls
TPOAb-positivity SNP Chr. Position (Build 36)
Risk Other RAFa Nearby gene OR (95% CI)b
Pvalue
rs11675434 2 1386822 T C 0.39 TPO 1.21 (1.15–1.28) 1.5610216
rs653178 12 110492139 C T 0.40 ATXN2 1.14 (1.08–1.19) 9.9610210
rs10944479 6 90937114 A G 0.16 BACH2 1.25 (1.14–1.37) 4.061028
Alleles Stage 1+2 meta-analysis: up to 20,512
subjects TPOAb levels SNP Chr. Position
(Build 36)
Risk Other RAFa Nearby gene b(SE)c Pvalue
rs11675434 2 1386822 T C 0.39 TPO 0.0202 (0.0046) 7.4610213
rs1230666 1 113974933 A G 0.16 MAGI3 0.0269 (0.0064) 1.861028
rs2010099 3 125782947 C T 0.91 KALRN 0.0240 (0.0076) 3.161028
Chr., chromosome
aRisk allele frequency: Weighted mean frequency of the risk allele across all included cohorts. bAdjusted for age and gender
c
Expressed in sd of natural logarithm transformed serum TPOAb level, adjusted for age and gender doi:10.1371/journal.pgen.1004123.t002
Novel Thyroid Antibody and Disease Loci
development of AITD [44,45]. Another top pathway involved was the OX40 signalling pathway, and it is of interest to note that OX40 is a T-cell activator promoting the survival of CD4+T-cells at sites of inflammation [69].
Our results have potential clinical relevance for several reasons. Genetic risk scores based on these novel common (risk allele frequencies: 9–40%) TPOAb-associated SNPs enabled us to iden-tify a large subgroup in the general population with a two-fold Figure 1. Genome wide association studies meta-analyses: Loci associated with TPOAb-positivity (a–c) and TPOAb levels (d–f) on a genome-wide level of significance.Regional association plots of the genome-wide significant loci associated with TPOAb positivity (a–c) and TPOAb levels (d–f). The y-axis on the left indicates the – log10Pvalue for the association with TPOAb –positivity (a–c) or TPOAb levels (d–f). SNPs are
plotted on the x-axis according to their chromosomal position against the association with the phenotype on the y-axis. The most significant stage 1 SNP is indicated in purple. The combined stage 1 and 2 result of this SNP is indicated in yellow. The SNPs surrounding the most significant SNP are color-coded to reflect their LD with this SNP. Symbols reflect functional genomic annotation, as indicated in the legend. The blue y-axes on the right of each plot indicate the estimated recombination rates (based on HapMap Phase II); the bottom of each panel shows the respective annotated genes at the locus and their transcriptional direction. Mb, megabases.
doi:10.1371/journal.pgen.1004123.g001
Novel Thyroid Antibody and Disease Loci
increased risk of TPOAb-positivity (10.4% vs 5.4%). These individuals also have a higher risk of increased TSH levels and a lower risk of goiter, suggesting an advanced stage of destruction of the thyroid due to autoimmune processes. Furthermore, pregnant women with high genetic risk scores had a 2.4 times increased risk of TPOAb-positivity during pregnancy. In this context it is interesting to note that TPOAb-positive pregnant women have an increased risk of miscarriages and preterm births independent of thyroid function [70].
Associations with thyroid disease were also found on an individual SNP level. The MAGI3 SNP was associated with a substantially increased risk of hypothyroidism, and the BACH2 SNP showed a borderline significant association (P= 0.011) with a higher risk of increased TSH levels, which includes subjects with subclinical and overt hypothyroidism. Furthermore, both loci were significantly associated with an increased risk of Graves’ hyper-thyroidism in an independent population. To predict which patients with first or second degree relatives with documented Hashimoto’s or Graves’ disease will develop clinical thyroid disease, a clinical algorithm has been developed (i.e., the THEA score) [18]. Future studies should analyze if these genetic markers increase the sensitivity of the THEA score. Graves’ hyperthyroid-ism and Hashimoto’s thyroiditis co-segregate in families and subjects with TPOAbs have an increased risk of both diseases [17,18,20,21,22,26]. The current study provides insight into this phenomenon by showing that specific loci associated with TPOAbs and (subclinical) hypothyroidism, i.e. MAGI3 and BACH2, are also associated with Graves’ hyperthyroidism in an independent case-control study.
The prevalence of TPOAb-positivity in the general population is high (5–24%), but it is currently unknown why part of the individuals with thyroid autoimmunity develop clinical thyroid disease whereas others do not [27,28]. In this context it is interesting to note that the TPOAb-associated SNPs located in
TPOandATXN2were not associated with clinical thyroid disease.
This suggests that the TPOAbs in these individuals may be of less clinical relevance, providing insight into why TPOAb-positive individuals do or do not eventually develop clinical thyroid disease. Our study has some limitations. The validity of the results is restricted to individuals from populations of European ancestry. Future GWASs in populations from non-European descent will be required to determine to which extent our results can be generalized to other ethnic groups. Secondly, we did not perform conditional analyses to further identify secondary association signals within the identified loci, nor did we perform functional studies for the identified variants. Further research is therefore needed to unravel the exact biological mechanism behind the observed associations. The fact that various TPOAb assays were used across the participating cohorts could lead to bias. We Table
4. Newly identified TPOAb associated loci and the risk of thyroid disease in stage 1 and 2 populations. Alleles Increased TSH (1110 cases/ 19,189 controls) Hypothyroidism (173 cases/ 15,940 controls) Decreased TSH (967 cases/ 19,297 controls) Hyperthyroidism (78 cases/14,901 controls) Nearby gene SNP Risk Other OR (95% CI) P value OR (95% CI) a P value OR (95% CI) a P value OR (95% CI) a P value TPO rs11675434 T C 1.08 (0.99–1.18) 0.08 1.14 (0.91–1.42) 0.26 1.02 (0.93–1.11) 0.68 1.10 (0.81–1.49) 0.54 ATXN2 rs653178 C T 1.01 (0.98–1.04) 0.68 1.25 (1.01–1.54) 0.04 1.01 (0.97–1.04) 0.70 1.00 (0.74–1.33) 0.99 BACH2 rs10944479 A G 1.17 (1.04–1.32) 0.011 1.37 (1.00–1.88) 0.05 0.91 (0.80–1.03) 0.15 1.80 (1.14–2.85) 0.012 MAGI3 rs1230666 A G 1.23 (1.09–1.39) 9.0 6 10 2 4 1.57 (1.18–2.10) 1.9 6 10 2 3 1.08 (0.96–1.22) 0.22 1.61 (0.99–2.60) 0.05 KALRN rs2010099 C T 1.05 (0.90–1.23) 0.52 0.80 (0.54–1.20) 0.28 0.82(0.71–0.95) 0.010 0.69 (0.39–1.24) 0.21 All analyses adjusted for age and gender. ATXN2 -rs653178 is in h igh LD w ith SH2B3-rs3184504 MAGI3-rs1230666 is in high LD w ith PTPN22-rs2476601 doi:10.1371/journal.pg en.1004123.t004
Table 3.Genetic risk score and the risk of TPOAb-positivity.
GRS Quartile
% TPOAb-positivity
(N cases/total) OR (95% CI)a Pvalue
1 (reference) 5.4% (89/1637) -
-2 7.0% (114/1637) 1.29 (0.98–1.69) 0.07
3 9.0% (152/1695) 1.64 (1.26–2.13) 1.361024 4 10.4% (158/1523) 2.18 (1.68–2.81) 8.161028
GRS, genetic risk score (based on rs11675434, rs653178, rs10944479, rs1230666, rs2010099).
aAdjusted for age and gender
doi:10.1371/journal.pgen.1004123.t003
Novel Thyroid Antibody and Disease Loci
therefore used TPOAb-positivity cut-off values as provided by the respective assay manufacturer, instead of using one fixed cut-off value. This is also of clinical importance as in clinical practice most institutions rely on the TPOAb-positivity cut-off as provided by the assay manufacturer. Furthermore, we did not detect hetero-geneity in our results, supporting the fact that results obtained with different assays can be combined across cohorts using the z-score based meta-analysis. Finally, as AITD coincides with other autoimmune diseases, our results could be driven by indirect associations with other autoimmune diseases. However, AITD is the most common autoimmune disease in the general population. We furthermore show that carriage of multiple risk alleles is associated with an increased risk of thyroid dysfunction, which underlines the clinical importance of our findings.
In conclusion, this first GWAS for TPOAbs identified five newly associated loci, three of which were also associated with clinical thyroid disease. Furthermore, we show that carriage of multiple risk variants is not only associated with a substantial increased risk of TPOAb-positivity, but also with a higher risk of increased TSH levels (including subclinical and overt hypothyroidism) and a lower risk of goiter. These genetic markers not only help to identify large groups in the general population with an increased risk of TPOAb-positivity, but may also predict which TPOAb-positive persons are particularly at risk of developing clinical thyroid disease.
Materials and Methods
Study cohorts
For the TPOAb GWAS stage 1 and 2 analyses, and the hypothyroidism, hyperthyroidism and goiter analyses, individuals were recruited from 16 independent community-based and family studies. For the Graves’ disease analyses, cases were recruited from the United Kingdom Graves’ disease cohort and controls from the British 1958 Birth Cohort. Thyroid cancer cases and controls were recruited from the Nijmegen and Ohio thyroid cancer cohorts. A detailed description of the original cohorts contributing samples is provided in Table 1 and in the Supplementary Material. All participants provided written informed consent and protocols were approved by the institutional review boards or research ethics committees at the respective institutions, and conducted according to the Declaration of Helsinki.
Phenotype definitions
Serum TPOAb levels were determined with a range of assays. TPOAb-positives were defined as subjects with TPOAb levels
above the assay-specific TPOAb-positivity cut-off, as defined by the manufacturer (Table 1). Serum TSH and free thyroxine (FT4) levels were determined using a range of assays (Table 1). Assay-specific TSH and FT4 reference ranges were used, as provided by the manufacturer (Table 1). Overt hypothyroidism was defined as a high TSH (i.e., a TSH level above the TSH reference range) and a low FT4. Increased TSH was defined as a high TSH, including persons with overt hypothyroidism or subclinical hypothyroidism (i.e., high TSH with a normal FT4). Overt hyperthyroidism was defined as a low TSH and a high FT4. Decreased TSH was defined as a low TSH, including persons with subclinical or overt hyperthyroidism.
The diagnosis of goiter is described in the Supplementary Material, and the diagnosis of Graves’ disease and thyroid cancer in the respective cohorts have been described previously [41].
Genotyping
Samples were genotyped with a range of GWAS genotyping arrays (Supplementary Table S1). Sample and SNP quality control procedures were undertaken within each study. For each GWAS, over 2.5 million SNPs were imputed using CEU samples from Phase 2 of the International HapMap project (www.hapmap.org). Genotyping procedures in the stage 2, Graves’ disease and thyroid cancer populations are described in the Supplementary Material.
Association analyses
The heritabilities of TPOAb-positivity and serum TPOAb levels were estimated, as described in the Supplementary Material.
In stage 1, we performed a GWAS on TPOAb-positivity as well as a GWAS on continuous TPOAb levels. Persons taking thyroid medication were excluded. Each SNP was tested for association with TPOAb-positivity using logistic regression analyses, adjusting for age and sex. For cohorts with family structure, we approximated the probability of being affected with a linear mixed model adjusting for age and sex. The produced model was used to predict the expected proportion of ‘‘risk’’ (effective) alleles in cases and controls, hence giving the means to estimate odds ratios. Only unrelated individuals were considered for the SardiNIA cohort. For the GWAS of continuous TPOAb levels, samples with a TPOAb level lower than the minimum TPOAb assay detection limit (Table 1) were excluded. TPOAb levels were natural log-transformed, and sex-specific, age adjusted standardized residuals were calcu-lated. Each SNP was tested for association with these TPOAb level residuals using linear regression analyses (additive model), Table 5.Newly identified TPOAb associated loci, genetic risk scores and the risk of goiter.
Individual SNPs (2205 goiter cases/4532 controls) Genetic risk scores
Nearby gene SNP
Risk allele
Other
allele OR (95% CI)a Pvalue GRS Quartile
% Goiter
(N cases/total) OR (95% CI)a Pvalue
TPO rs11675434 T C 0.95 (0.88–1.02) 0.17 1 (reference) 35.2% (588/1669) -
-ATXN2 rs653178 C T 0.95 (0.88–1.03) 0.22 2 33.7% (570/1691) 0.92 (0.79–1.06) 0.21 BACH2 rs10944479 A G 0.94 (0.85–1.05) 0.28 3 31.6% (530/1675) 0.84 (0.72–0.98) 0.03 MAGI3 rs1230666 A G 0.90 (0.81–1.00) 0.05 4 30.4% (517/1702) 0.77 (0.66–0.89) 6.561024
KALRN rs2010099 C T 0.93 (0.81–1.05) 0.23 GRS, genetic risk score (based on rs11675434, rs653178, rs10944479, rs1230666, rs2010099).
aAdjusted for age, gender, and body surface area.
ATXN2-rs653178 is in high LD withSH2B3-rs3184504. MAGI3-rs1230666 is in high LD withPTPN22-rs24756601. doi:10.1371/journal.pgen.1004123.t005
Novel Thyroid Antibody and Disease Loci
correcting for relatedness in studies with family structure. See Supplementary Table S1 for the software used for these analyses.
Before meta-analysis, SNPs with a minor allele frequency (MAF)
,1% or a low imputation quality were excluded (Supplementary Material), after which the results of each GWAS were combined in a population size weighted z-score based meta-analysis using METAL [71]. Genomic control was applied to individual studies if
l.1.0.
In stage 2, we followed-up stage 1 GWAS significant SNPs, as well as promising SNPs not reaching GWAS significance, in an attempt to reach GWAS significant associations by increasing sample size (Supplementary Material). Results from stage 1 and 2 were combined in a population size weighted z-score based meta-analysis using METAL [71]. A z-score based meta-meta-analysis was used to reduce bias that might be induced by different assays. As this method does not provide betas, and we wanted to provide a rough estimate of the actual effect sizes for convenience, we calculated betas using the fixed effects (inverse variance based) meta-analysis method. Heterogeneity was tested, applying bonfer-roni based P-value thresholds of P= 0.004 for the TPOAb-positivity analyses andP= 0.005 for the TPOAb level analyses.
All studies assessed and, if present, corrected for population stratification using principal-component analysis (PCA) and/or multidimensional-scaling (MDS), with the exception of SardiNIA and ValBorbera where the high isolation substantiates a lack of stratification (Table S1) [72,73]. Lambda values were all ,1,
indicating that population stratification was overall properly accounted for (Table S1). To fully remove residual effects, we applied genomic correction to studies were lambda was.1. The final meta-analyses reported a lambda of 1.01 for both the TPOAb-positivity and the TPOAb level GWAS, thus no genomic correction was applied.
The variances explained by the GWAS significant SNPs were calculated. We subsequently studied the individual as well as the combined effects of the GWAS significant SNPs on the risk of clinical thyroid disease, as specified in the Supplementary Material. In short, to study combined effects, a genetic risk score was calculated for every person as the weighted sum of TPOAb risk alleles. The associations between the individual SNPs, genetic risk scores and the risk of abnormal thyroid function tests were studied using logistic regression analyses. Logistic regression analyses were used to study the associations with goiter, Graves’ disease and thyroid cancer (Supplementary Material). The results of each study were combined in a population size weighted z-score based meta-analysis using METAL [71].
Various bioinformatic tools were searched for evidence for functional relevance of the GWAS significant SNPs and pathway analyses were performed on the Stage 1 lead SNPs (see Supplementary Material).
Supporting Information
Figure S1 TPOAb level distributions in persons with detectable TPOAb levels in stage 1 and 2 populations.
(PPTX)
Figure S2 Quantile-quantile (QQ) plots for the TPOAb-positivity and TPOAb level stage 1 meta-analyses.
(PPTX)
Figure S3 Manhattan plots for stage 1 meta-analyses for TPOAb-positivity (a) and TPOAb levels (b). SNPs are plotted on the x-axis according to their chromosomal position against TPOAb-positivity (a) or TPOAb levels (b) (shown as – log10 P value) on the y-axis. The horizontal grey line indicates the
threshold for genome-wide statistical significance (P,561028). Genome-wide significant associations were observed near TPO (Chr 2p25; P= 1.5610212), at ATXN2 (Chr 12q24.1;
P= 1.661029) and near HCP5 (Chr 6p21.3; P= 4.161028) for
TPOAb-positivity, and nearTPO(Chr 2p25;P= 5.4610213) and
atATXN2(Chr 12q24.1;P= 1.161028) for TPOAb levels.
(PPTX)
Figure S4 Regional association plots of stage 1 lead loci for TPOAb-positivity (panels a-m). The y-axis on the left indicates the – log10Pvalue for the association with TPOAb –positivity. SNPs are plotted on the x-axis according to their chromosomal position. The most significant stage 1 SNP is indicated in purple. The combined stage 1 and 2 result of this SNP is indicated in yellow. The SNPs surrounding the most significant SNP are color-coded to reflect their LD with this SNP. Symbols reflect functional genomic annotation, as indicated in the legend. The blue y-axes on the right of each plot indicate the estimated recombination rates (based on HapMap Phase II); the bottom of each panel shows the respective annotated genes at the locus and their transcrip-tional direction. Mb, megabases.
(PPTX)
Figure S5 Regional association plots of stage 1 lead loci for TPOAb levels (panels a-j). The y-axis on the left indicates the – log10 P value for the association with TPOAb levels. SNPs are plotted on the x-axis according to their chromosomal position. The most significant stage 1 SNP is indicated in purple. The combined stage 1 and 2 result of this SNP is indicated in yellow. The SNPs surrounding the most significant SNP are color-coded to reflect their LD with this SNP. Symbols reflect functional genomic annotation, as indicated in the legend. The blue y-axes on the right of each plot indicate the estimated recombination rates (based on HapMap Phase II); the bottom of each panel shows the respective annotated genes at the locus and their transcrip-tional direction. Mb, megabases.
(PPTX)
Figure S6 GRAIL results for the stage 1 TPOAb-positivity and TPOAb level lead SNPs. GRAIL circle plot of locus connectivity where each locus is plotted in a circle, where significant connections (P,0.05) based on PubMed abstracts are drawn spanning the circle. Analyses were based on the 20 stage 1 TPOAb-positivity and TPOAb level lead SNPs.
(PPTX)
Table S1 Study sample genotyping, quality control and association analyses for stage 1 populations.
(DOCX)
Table S2 Associations of stage 1 lead SNPs with TPOAb-positivity in stage 1 and 2.
(DOCX)
Table S3 Associations of stage 1 lead SNPs with serum TPOAb levels in stage 1 and 2.
(DOCX)
Table S4 Stage 1 TPOAb-positivity and TPOAb level meta-analyses results for GWAS significant SNPs reported in previous GWAS on thyroid related phenotypes.
(XLSX)
Table S5 Genetic risk score and the risk of increased TSH levels. (DOCX)
Table S6 Newly identified TPOAb associated loci and the risk of thyroid cancer.
(DOCX)
Novel Thyroid Antibody and Disease Loci
Table S7 Top IPA associated networks for the Stage 1 TPOAb-positivity and TPOAb level lead SNPs.
(DOCX)
Table S8 Top IPA associated canonical pathways for the Stage 1 TPOAb-positivity and TPOAb level lead SNPs.
(DOCX)
Text S1 Supplementary methods. (DOCX)
Acknowledgments
We thank all study participants, volunteers and study personnel that made this work possible.
The Asklepios study is indebted to Femke van Hoeke, Bianca Leydens, and Caroline van Daele, and the residents and general practitioners of Erpe-Mere and Nieuwerkerken for their help in completing the study.
with the IPA and GRIMP pathway analyses.
The SardiNIA study thanks the many individuals who generously participated in this study, Monsignore Piseddu, Bishop of Ogliastra, the mayors and citizens of the Sardinian towns (Lanusei, Ilbono, Arzana, and Elini), and the head of the Public Health Unit ASL4 for their volunteerism and cooperation; the team also thanks the physicians, Marco Orru
The SHIP study is grateful to the contribution of Florian Ernst, Anja Wiechert and Astrid Petersmann in generating the SNP data.
The SHIP–Trend study is grateful to Mario Stanke for the opportunity to use his Server Cluster for the SNP imputation as well as to Holger Prokisch and Thomas Meitinger (Helmholtz Zentrum Mu¨nchen) for the genotyping of the SHIP-TREND cohort.
TwinsUK thanks the staff from the Genotyping Facilities at the Wellcome Trust Sanger Institute, UK, for sample preparation, quality control, and genotyping; Le Centre National de Ge´notypage, France, for genotyping; Duke University, NC, USA, for genotyping; and the Finnish Institute of Molecular Medicine, Finnish Genome Center, University of Helsinki. We thank the volunteer twins who made available their time.
The United Kingdom (UK) Graves’ disease cohort would like to thank all principle investigators (Amit Allahabadia, Northern General Hospital; Sheffield, UK, Mary Armitage Royal Bournemouth Hospital, Bourne-mouth, UK; Krishna V. Chatterjee, University of Cambridge, Adden-brookes Hospital, Cambridge, UK; John H. Lazarus Centre for Endocrine and Diabetes Sciences, Cardiff University, Cardiff, UK; Simon H. Pearce, Institute of Human Genetics, Newcastle University, Newcastle-upon-Tyne, Newcastle, UK and Bijay Viadya, Royal Devon and Exeter Hospital, Exeter, UK), doctors and nurses for recruiting AITD subjects into the AITD National Collection.
in the study, the local administrations and the ASL-Novi Ligure for support
Camaschella, Prof Federico Caligaris-Cappio and the MDs of the
collection.
Author Contributions
References
1. Gough SC (2000) The genetics of Graves’ disease. Endocrinol Metab Clin North Am 29: 255–266.
2. Simmonds MJ, Gough SC (2004) Unravelling the genetic complexity of autoimmune thyroid disease: HLA, CTLA-4 and beyond. Clin Exp Immunol 136: 1–10.
3. Tunbridge WM, Evered DC, Hall R, Appleton D, Brewis M, et al. (1977) The spectrum of thyroid disease in a community: the Whickham survey. Clin Endocrinol (Oxf) 7: 481–493.
4. Biondi B (2012) Mechanisms in endocrinology: Heart failure and thyroid dysfunction. Eur J Endocrinol 167: 609–618.
5. Collet TH, Gussekloo J, Bauer DC, den Elzen WP, Cappola AR, et al. (2012) Subclinical hyperthyroidism and the risk of coronary heart disease and mortality. Arch Intern Med 172: 799–809.
6. Davis JD, Tremont G (2007) Neuropsychiatric aspects of hypothyroidism and treatment reversibility. Minerva Endocrinol 32: 49–65.
7. Gencer B, Collet TH, Virgini V, Bauer DC, Gussekloo J, et al. (2012) Subclinical thyroid dysfunction and the risk of heart failure events: an individual participant data analysis from 6 prospective cohorts. Circulation 126: 1040– 1049.
8. Nicholls JJ, Brassill MJ, Williams GR, Bassett JH (2012) The skeletal consequences of thyrotoxicosis. J Endocrinol 213: 209–221.
9. Rodondi N, den Elzen WP, Bauer DC, Cappola AR, Razvi S, et al(201) Subclinical hypothyroidism and the risk of coronary heart disease and mortality. Jama 304: 1365–1374.
10. Ruhla S, Weickert MO, Arafat AM, Osterhoff M, Isken F, et al. (2010) A high normal TSH is associated with the metabolic syndrome. Clin Endocrinol (Oxf) 72: 696–701.
11. Selmer C, Olesen JB, Hansen ML, Lindhardsen J, Olsen AM, et al. (2012) The spectrum of thyroid disease and risk of new onset atrial fibrillation: a large population cohort study. Bmj 345: e7895.
12. Pearce EN, Farwell AP, Braverman LE (2003) Thyroiditis. N Engl J Med 348: 2646–2655.
13. Schweizer U, Chiu J, Kohrle J (2008) Peroxides and peroxide-degrading enzymes in the thyroid. Antioxid Redox Signal 10: 1577–1592.
14. Brix TH, Hegedus L, Gardas A, Banga JP, Nielsen CH (2011) Monozygotic twin pairs discordant for Hashimoto’s thyroiditis share a high proportion of thyroid peroxidase autoantibodies to the immunodominant region A. Further evidence for genetic transmission of epitopic ‘‘fingerprints’’. Autoimmunity 44: 188–194. 15. Huber G, Staub JJ, Meier C, Mitrache C, Guglielmetti M, et al. (2002) Prospective study of the spontaneous course of subclinical hypothyroidism: prognostic value of thyrotropin, thyroid reserve, and thyroid antibodies. J Clin Endocrinol Metab 87: 3221–3226.
16. Nielsen CH, Brix TH, Leslie RG, Hegedus L (2009) A role for autoantibodies in enhancement of pro-inflammatory cytokine responses to a self-antigen, thyroid peroxidase. Clin Immunol 133: 218–227.
17. Strieder TG, Prummel MF, Tijssen JG, Endert E, Wiersinga WM (2003) Risk factors for and prevalence of thyroid disorders in a cross-sectional study among healthy female relatives of patients with autoimmune thyroid disease. Clin Endocrinol (Oxf) 59: 396–401.
18. Strieder TG, Tijssen JG, Wenzel BE, Endert E, Wiersinga WM (2008) Prediction of progression to overt hypothyroidism or hyperthyroidism in female relatives of patients with autoimmune thyroid disease using the Thyroid Events Amsterdam (THEA) score. Arch Intern Med 168: 1657–1663.
19. Weetman AP (2000) Graves’ disease. N Engl J Med 343: 1236–1248. Novel Thyroid Antibody and Disease Loci
PLOS Genetics | www.plosgenetics.org 12 February 2014 | Volume 10 | Issue 2 | e1004123
The Busselton Health Study thanks the Busselton Population Medical Research Foundation for approving the study. We thank Siemens Ltd. Australia and New Zealand Healthcare Sector for donating assay reagents. The Rotterdam Study thanks Pascal Arp, Mila Jhamai, Marijn Verkerk,
database, and Karol Estrada and Maksim V. Struchalin for their support in creation and analysis of imputed data. The authors are grateful to the study participants, the staff from the Rotterdam Study and the participating general practitioners and pharmacists. We would like to thank Karol Estrada, Dr. Fernando Rivadeneira, Dr. Tobias A. Knoch, Anis Abuseiris, Luc V. de Zeeuw, and Rob de Graaf (Erasmus MC Rotterdam, The Netherlands), for their help in creating GRIMP, and BigGRID,
computing resources. We would like to thank Symen Ligthart for his help MediGRID, and Services@MediGRID/D-Grid for access to their grid
Lizbeth Herrera and Marjolein Peters for their help in creating the GWAS and Fiammetta Vigano` for technical help. We also thank Prof. Clara Val Borbera thanks the inhabitants of the Val Borbera for participating
Medicine Dept. of the San Raffaele Hospital for help with clinical data
` , Maria Grazia Pilia, Liana Ferreli, Francesco Loi, Stefano Angius, nurses Paola Loi, Monica Lai and Anna Cau who carried out participant physical exams, and the recruitment personnel Susanna Murino. We thank Francesco Cucca, PI of the SardiNIA study.