Abstract— A visualization program based on a new technique for volume rendering and accelerating visualization of large datasets is presented. The method keeps track of previous moves and uses the application and viewer’s specifications to produce areas called layers. The layers help to predict next moves and the objects that have to be selected for future use. By gathering statistics about different objects a unique shape layer is obtained that is used to select different objects and put them in the groups to be rendered with different resolutions. The technique used simplifies the implementation, requires smaller memory footprint, and accelerates production of high resolution visualization at interactive rate.
Index Terms—Large dataset, multi-resolution techniques, object selecting methods, visualization software.
I. INTRODUCTION
Direct volume rendering [1]-[4] has become a standard technique for visualizing 3D datasets. This technique maps the data in the volume and projects it to 2D images. The direct volume rendering techniques using 3D texture mapping and hardware can visualize volumes of moderate sizes at interactive frame rates. While the available texture memory in the high–end graphics hardware is limited to only several hundred megabytes, simulation applications can produce terabytes of data.
As visualization is an interactive process, sometimes rendering a lower resolution of data is sufficient for the user to get enough information about the area based on its distance. It is useful to first render the data at a lower resolution and then as the user navigates through the data and requests further details in local regions of interest, if the rendering resources are available, different portions of the data are retrieved and rendered at their higher resolution. The capability to visualize data at different resolutions allows user to focus on specific area of interest and to spend more time and hardware resources for higher quality data for that area. Techniques have been introduced to provide
hierarchical data representations for 3D volumetric data in [3]-[5] and for multi-resolution encoding and rendering of large scale in [6].
Level of detail based visualization techniques as proposed in [7] allow rendering of the same objects using several
Manuscript received November 8, 2007. This work was supported in part by NASA Langley Research Center Grant No. NOC-03033 under the Chesapeake Information Based Aeronautic Consortium (CIBAC).
N. Fallah is with the University of Maryland Eastern Shore, Prince Anne, MD 21853 USA.
A. Eydgahi is with the Department of Engineering and Aviation Sciences, University of Maryland Eastern Shore, Princess Anne, MD 21853 USA (Phone: 410-651-7559; fax: 410-651-6486; e-mail: [email protected]).
different triangle meshes of variable complexity. Thus, the mesh complexity can be adjusted according to the object’s relative position from the viewer, its visual importance in the rendered scene, and with respect to the available rendering power to guarantee stable interactive frame rates [8]. Although numerous ideas have been implemented on mesh simplification for geometric approximation [9]-[10], fewer approaches have been taken to address the problem of view-dependent simplification [8] for real-time rendering and performance optimization.
In this paper, a program based on a new technique [11] to predict and cover more general and comprehensive datasets is presented. The method utilizes a level of detail technique which has been optimized for urban area visualization and requires minimum amount of necessary memory.
II. THE TECHNIQUE USED
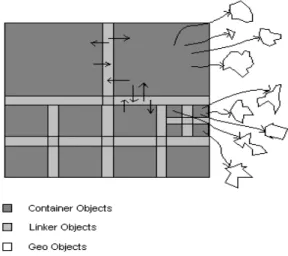
The method consists of three different types of objects. A prefixed is added to each type to distinguish between these objects. The first objects are Geo-Objects which have to be shown on screen. Geo-Objects simulate the real word objects and keep different information about each object such as shape, color, and location. The two other types of objects are Container-Objects and Linker-Objects. These two types construct the platform for data structure by pointing to each other and to relevant Geo-Objects. These objects are responsible to keep the integrity of the Geo-Objects.
The three different objects are shown in figure 1. The white objects represent Geo-Objects which are rendered and are shown on screen at the same time. Dark gray represent Container-Objects which points to Geo-Objects in their area. When a special area needs to be shown on screen, that container and the related Geo-Objects are loaded into memory to render. The bright gray represents Linker-Objects which links different containers. These objects are being used to find neighbors of a container when they need to be selected.
Each Container-Object refers to a specific geographic area and points to a group of Geo-Objects belonging to the same geographic location. These objects have to attach to each other in order to construct the dataset using
Container-Objects. Each Container-Object by using Linker-Objects connects to all other Container-Objects around it. Container-Objects have pointer to point to all necessary Linker-Objects that are around it. Linker-Objects are pointing to Container-Objects that are next to them and other Linker-Objects. Connecting Container-Objects using this technique helps the algorithm to find nearby Geo-Objects in least amount of time.
Software for Visualizing Volume Rendering of
Large Datasets
Figure 1: Different types of objects
Container-Objects have size-limit based on hardware and software specifications and requirements. By adding each Geo-Object to a specific location, the relevant
Container-Object for that area points to that Geo-Object. When the size of the Geo-Objects that are being pointed with Container-Object exceeds the size-limit for that
Container-Object, the Container-Object has to be broken down to smaller pieces and cover the same area with more Container-Objects to keep the balance. This feature is necessary to improve the memory performance and keep the access time as short as possible.
As a Container-Object breaks down, new Linker-Objects joins the new Container-Objects and other Container-Objects that are nearby. Separating these two responsibilities, maintain Geo-Objects with Container-Objects and
establishes the links between these objects, which improves the memory and CPU performance while updating and maintaining the objects.
For identifying and selecting proper objects that need to be processed a layer is used. The layer is obtained from probability of viewers changing their directions. Different statistics and characteristics of movement such as speed and probability of turning to different directions are employed to generate layers. The layer is used to predict the viewer’s next position and consequently enables the algorithm to deal with the objects that are affected by the move. This improves the performance, reduces the delay time, and makes it feasible for the real-time visualization of objects.
There are two methods to generate the layers. The first one is to provide the probabilities while defining a new object as viewer. The second approach is to use the same probability for all directions as default. In this case, the program keeps track of movements and collects necessary statistics to generate probabilities and make corrections on the layers shape.
The distance between the viewer and Geo-Objects around it creates layers with different sizes. Combining layers with different sizes produces a base layer which is used by the algorithm to determine proper resolution for each Geo-Object using multi-resolution and level of detail concepts.
The interior layer in the base layer selects the Geo-Objects that have to be shown on screen and have to be rendered by an program. Other layers select the Geo-Objects that do not
need to be rendered but have to be cached into memory for later use. This technique speeds up the rendering process for next move when interior layer covers the Geo-Objects. The interior layer can contain several sub-layers depending on specification of an environment. The program can render Geo-Objects in each sub-layer with different resolution and spend more time for Geo-Objects that are closer to viewer. Using this special shape helps to render or cache Geo-Objects into the memory more accurately by reducing the effort for caching the Geo-Objects that are less likely to be visited by viewer.
The process of data handling consists of two phases. The startup phase and update phase which includes add or delete of Geo-Objects to/from an existing dataset. The startup phase starts with an empty Container-Object which covers all the demanded area. Geo-Objects are being added to the container till the container reaches the size-limit. The size-limit of the container depends on the software and hardware
specifications such as the rendering device, graphic card, and main memory. When the container reaches the size-limit, it is broken down to four new containers which each covers one-fourth of the old container area. This process continues until all the Geo-Objects have been added to the containers. Since each break produces 4 new containers, frequently breaking is not necessary and it improves the performance.
Those containers that have less than one-eighth of size-limit must be combined with their neighbors to make a new container. This assures that storage and memory spaces are not wasted. If all four containers have one-eighth of size-limit, by combining them the new container will have half of the size-limit.
The containers are numbered in specific order to speed up the access time to objects. The specific order of numbering helps to find any Container-Object in the area and its related containers, such as its neighbors or children’s of the same container, in case the containers have to be merged. The merge is necessary when the four containers from the same parents have less than one-eighth of size-limit.
The numbering process for the first break is shown in figure 2. In this process, containers are numbered using two digits where the first digit is the number of main container. For example, by breaking container number 3 to four new containers, they are numbered as 30, 31, 32, and 33. This number specifies the relevant container in reverse method.
Figure 2: Numbering containers after being
numbering method, any container or Geo-Object can be identified very fast and finding the neighbors of a container is achieved just by changing a digit in this string of digits.
The other advantage of this numbering is that each digit can be represented only by 2 bits. For example, container numbered 230131 can be stored in 12 bits. Bitwise instructions can be used to manipulate these numbers and to extract container information such as location and neighbors which reduce the calculation time.
III. THE SOFTWARE
The program is implemented in Java and consists of RLMain, RLFrame, DataSetCreator, DataSetViewer, RLImageApplet, and RLColorApplet classes. In this software, the rendered images are shown on screen and rendering phase can be added as an extension.
The DataSetCreator class creates the dataset based on the described method and uses images as its input. This class puts the images in proper container and keeps images with three different resolutions.
The DataSetViewer class shows the dataset made by DataSetCreator class. This class shows images in the dataset with random resolution for sample and quick demonstration of the dataset produced by DataSetCreator. It also uses other classes to implement other functionality of the proposed method.
The RLImageApplet class uses the dataset produced by DataSetCreator class to implement the selecting phase of the method. This class is a Java applet and selects containers, puts them in different resolution areas, and displays them on screen based on their proper resolution. There are three different resolution areas in the program. A rectangle simulates the screen position on dataset and the area surrounded with the rectangle to clearly demonstrate the method. The probability area has two layers. The first layer is internal layer which selects the objects that are close to viewer. The objects in this area have to be rendered with the best resolution. The second layer selects the objects to be rendered with lower resolution as they are far from the viewer. These layers also select extra objects which are not in screen area and user is not able to see them. These extra objects are cached for future use to reduce the delay for later moves. Depending on the size of probability areas, some objects that have to be shown on screen may not be selected by any layer. In this case, the objects have to be selected as a new area and to be rendered with lower resolution.
The RLColorApplet class uses three different colors to simulate the proposed method. The screen simulation and probability areas are the same as RLImageApplet class. In this class to simplify the demonstration, each color represents a specific resolution area. The three colors and their
corresponding layers are:
• For the layer with the highest resolution. • For the layer with intermediate resolution. • For the layer with the lowest resolution.
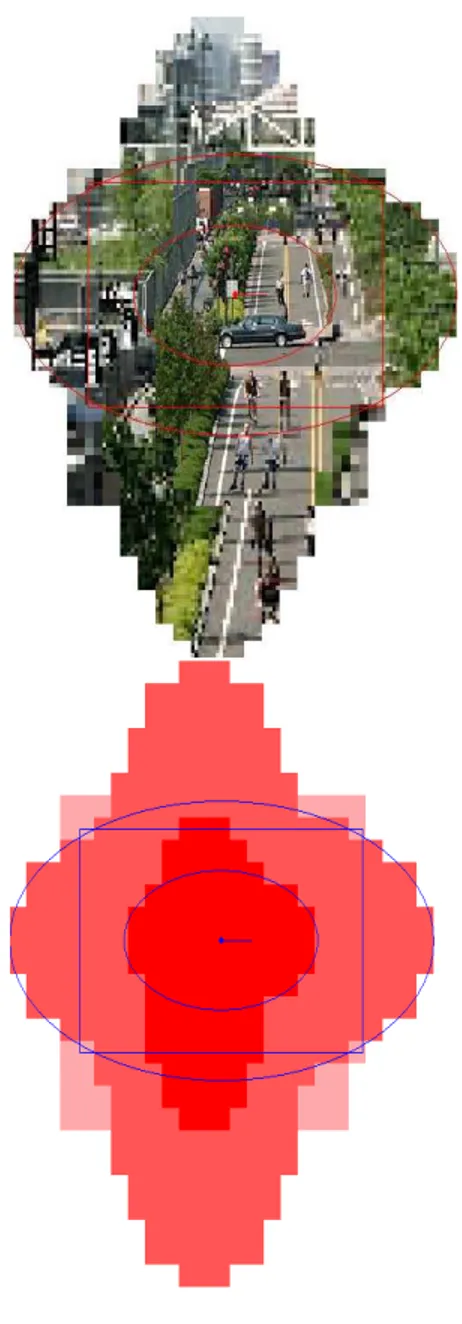
Figure 3 shows the selected areas with RLImageApplet and RLColorApplet. The objects enclosed within the internal layer are rendered with the highest resolution. The objects in second area are displayed with lower resolution. Lowest
resolution applies to the objects that are in screen rectangle but not selected by any probability area. The images in figure 3 represent the selected areas chosen by the algorithm before viewer moves.
Figure 3: Selected areas before viewer moves
Figure 4 shows the selected areas after forward move. Since most of the necessary objects had been selected and rendered for previous move, the images in this figure show there are only few objects that need to be rendered and to be shown on screen for new position of the viewer.
Figure 4: Selected areas after forward move
IV. CONCLUSIONS
A program based on a new method which utilizes proximity, level of details, and statistics from previous moves to predict next position and to select necessary objects for future use is described. This program is not dependent on the shape and distribution of objects. It does not waste storage by assigning extra space based on specific geographic
distribution over an area. In cases such as diamond-shape distribution objects, where it seems half of the containers are being wasted, memory is allocated just for the parts that contain Geo-Objects. If a container is empty, there is no storage and memory allocated for the relevant
Container-Object. In this case, Linker-Objects point to other linkers and as there is no container the pointers will be null.
ACKNOWLEDGMENT
This work was supported by NASA Langley Research Center Grant No. NOC1-03033 under the Chesapeake Information Based Aeronautic Consortium (CIBAC).
Figure 5: Selected areas after right turn
REFERENCES
[1] J. Gao, C. Wang, L. Li, and H. Shen, “A Parallel Multiresolution Volume Rendering Algorithm for Large Data Visualization,” Parallel Computing, vol. 31, no. 2, pp. 185-204, 2005.
[2] I. Boada, I. Navazo, and R. Scopigno, “Multi Resolution Volume Visualization with a Texture-Based Octree,” The Visual Computer, vol. 17, no. 3, pp. 185-197, 2001.
[3] D. Ellsworth, L. J. Chhiang, and H. W. Shen, “Accelerating Time-Varying Hardware Volume Rendering Using TSP Trees and Color-Based Error Metrics,” Proc. of the 2000 IEEE symposium on Volume visualization, Salt Lake City, UT, pp. 119-128, 2000. [4] S. Guthe, M. Wand, J. Gonser, W. Strasser, “Interactive Rendering of
Large Volume Data Sets,” Proc. of IEEE visualization, Boston, MA, pp. 53-60, 2002.
[5] T. Funkhouser and C. Sequin, “Adaptive Display Algorithm for Interactive Frame Rates During Visualization of Complex Virtual Environment,” Proc. of the 20th Annual Conference on Computer Graphics and Interactive Techniques, Anaheim, CA, pp. 247-254, 1993.
[6] R. Pajarola and C. DeCoro, “Efficient Implementation of Real-Time View-Dependent Multiresolution Meshing,” IEEE Transactions on Visualization and Computer Graphics, vol. 10, no. 3, pp. 353–368, 2004.
[7] P. Cignoni, C. Montani, and R. Scopigno, “A Comparison of Mesh Simplification Algorithms,” Computer & Graphics, vol. 22, no. 1, pp. 37-54, 1998.
[8] P. Lindstrom and G. Turk, “Evaluation of Memory-less Simplification,” IEEE Trans. Visualization and Computer Graphics, vol. 5, no. 2, pp. 98-115, 1999.
[9] C. Wang and H. Shen, “Hierarchical Navigation Interface: Leveraging Multiple Coordinated Views for Level-of-Detail Multiresolution Volume Rendering of Large Scientific Datasets,” Proc. of Ninth International Conference on Information Visualization, Greenwich, UK, pp. 259- 267, 2005.
[10] B. Shneiderman, “The Eyes Have it, A Task by Data Type and Taxonomy for Information Visualizations,” Proc. of IEEE Visual Languages, Boulder, CO, pp. 336-343, 1996.