ISSN 1553-345X
© 2009 Science Publications
Ozone Treatment of Animal Manure for Odor Control
Fahad Nasser Alkoaik
Department of Agricultural Engineering, College of Food and Agricultural Sciences,
King Saud University, Riyadh, Kingdom of Saudi Arabia
Abstract: Problem statement: The effectiveness of ozone in reducing odor emission from liquid animal manure was evaluated under batch and continuous treatment operations. Results: The results indicated that the use of ozone for the treatment of animal manure proved to be effective in reducing the odor offensiveness. A minimum 3.4 level out of 10 (66% reduction) was achieved in the continuous operation; while a minimum of 3.1 (69% reduction) was achieved in the batch operation. Increasing the level of ozone (O3) increased the level of offensiveness which was attributed to the presence of intermediate products due to the interaction between ozone and hydrogen sulfide and methylamine. Conclusion: The cost analysis indicated that the treatment is economical as a ton of manure could be treated at a cost of $ 0.23.
Key words: Manure, ozone, odor, chemical oxidation, batch, continuous
INTRODUCTION
For years, livestock operations such as animal feedlots and poultry have operated with little concern from the public. These operations were very small in nature and rural populations were quite accustomed to the low levels of the odor emitted from these operations. Currently, these operations are getting larger in size and hence producing large amounts of wastes which are causing air, water and soil pollution. In addition, non agricultural populations have their first or second residence in farming areas and are largely responsible for the air pollution complains[1-4].
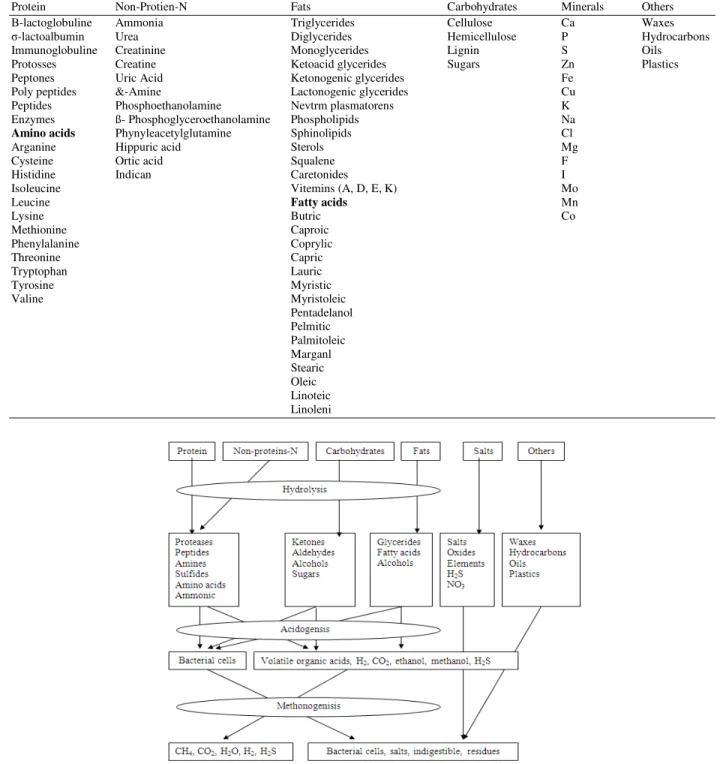
Animal manure contains various complex organic and inorganic compounds as shown in Table 1. When handling animal manure, extremely noxious odors arise. The odorous compounds originate during the anaerobic decomposition of animal waste. Anaerobic decomposition of animal waste is a complex biochemical process (Fig. 1) that involves a consortium of microorganisms including several groups of acid producing and methane forming bacteria[5]. The acid formers are the primary producer of organic acid, while the methane formers use the acids to produce methane and carbon dioxide.
The decomposition process of organic matter involves the breakdown of protein, carbohydrates and fats into a number of end products[6]. In general, the decomposition process results in the formation of several compounds including alcohols, esters,
carbonyls, sulfides, mereaptans, amines, amino acids, organic acids and different gases as shown in Table 2. The organic acids may include formic, acetic, propionic and bactric. Amino acids may also change to amines by decarboxylation. The breakdown of protein may result in sulfur related amino acids which may produce various sulfides and mercaptans[7]. The breakdown of fats is an energy releasing process that results in the formation of alcohols and fatty acids which may be broken down to acetic acid. The breakdown of carbohydrates leads to the production of alcohols, Aldehydes, ketons and organic acids[5]. Among the compound of anaerobic decomposition, hydrogen sulfide (H2S), ammonia (NH3) and methylamine (CH3NH2) are largely responsible for the animal manure odors[6].
Table 1: Compounds found in animal manure
Protein Non-Protien-N Fats Carbohydrates Minerals Others
Β-lactoglobuline Ammonia Triglycerides Cellulose Ca Waxes
σ-lactoalbumin Urea Diglycerides Hemicellulose P Hydrocarbons
Immunoglobuline Creatinine Monoglycerides Lignin S Oils
Protosses Creatine Ketoacid glycerides Sugars Zn Plastics
Peptones Uric Acid Ketonogenic glycerides Fe
Poly peptides &-Amine Lactonogenic glycerides Cu
Peptides Phosphoethanolamine Nevtrm plasmatorens K
Enzymes ß- Phosphoglyceroethanolamine Phospholipids Na
Amino acids Phynyleacetylglutamine Sphinolipids Cl
Arganine Hippuric acid Sterols Mg
Cysteine Ortic acid Squalene F
Histidine Indican Caretonides I
Isoleucine Vitemins (A, D, E, K) Mo
Leucine Fatty acids Mn
Lysine Butric Co
Methionine Caproic
Phenylalanine Coprylic
Threonine Capric
Tryptophan Lauric
Tyrosine Myristic
Valine Myristoleic
Pentadelanol Pelmitic Palmitoleic Marganl Stearic Oleic Linoteic Linoleni
Fig. 1: Anaerobic decomposition of animal waste
Chemical and biological treatments of animal wastes are used to control odors during the storage and handling. There are wide variety of products being sold to treat and/or prevent odors which include: (a) masking agents or counter actants, (b) digestive
Table 2: By products of anaerobic decomposition[13]
Group Examples
Alcohols Methanol
Ethanol 2-propanol n-propanal n-butanol iso-butanol iso-pentanol
Acids Butyric
Acetic Propionic Iso-butyric Iso-valeric
Amines Methylamine
Ethylamine Trimethylamine Triethylamine
Carbonyls Acetaldehydes
Proponaldehyde Butryoldhyde Iso-butyraldehyde Hexanol Acetone 3-pentanon Formaldehyde Heptaldehyde Valeraldehyde Octaldehyde Decaldehyde Diacetyl (2,3-Diketo-butane)
Esters Methyl formate
Methyl acetate Iso-propyl acetate Iso-butyl acetate Iso-propyl propionate Propyl acetate n-butyl acetate
Gases Carbon dioxide
Methan Ammonia Hydrogen sulfide
Sulfides Dimethyl sulfide
Diethyl sulfide Di sulfides
Heterocycles Idole
Skatole Pyrazines
Others Methyl mereaptans
Table 3: Threshold limits for various compounds
Substrate Concentration in air (10−9 g L−1)
Acetaldehyde 360
Acetic acid 25
Ammonia 35
n-butyl acetate 710
Butyl mercaptan 35
Diethylamine 75
Dimethylamine 18
Ethylamine 25
Ethylmercaptan 12
Iso-propylamine 12
Methlmercaptan 20
Triethylamine 100
*: Threshold limit refers to the airborne concentration under which the reported exposure will cause no adverse effect
Table 4: Concentration of odorous compounds measured in the vicinity of livestock production facility
NH3 Sulfides
Source (mg m−3) (mg L−3) Reference
Broiler house 2.38 1.0-15.0 Koelliker et al.[8]
Beef feedlot 0.12 5-27 Burnett[9]
Swine building 7.4-24.0 100 Cai et al.[10]
They have been used to control odor in chemical manufacturing, petroleum refining and textile facilities.
The digestive deodorants are mostly enzymes and have been found to work in some cases. The anaerobic decomposition of manure gives several offensive odors and some deodorants may only eliminate certain odors. Adsorptive materials are products with large surface areas such as activated carbon, silica gel and active aluminum. They are associated with airborne particles and adsorb odors before it is released to the environment. The feed additives are compounds added to feed to reduce odor as there is a correlation between feed ingredients and odor quality. Yeast, dry lacto and wet lacto have shown limited success. Chemical deodorants are strong oxidizing agents or germicider that alter or eliminate bacterial actions responsible for odor production. Also, oxidizing agents transform odorous compounds into less offensive ones by chemical oxidation.
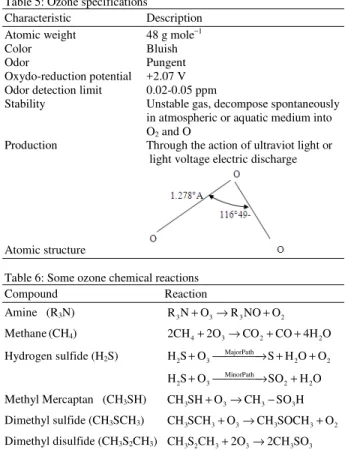
Chemical oxidation of animal manure has been reported by several authors[7,11,12]. The common denominator among the proven effective chemical compounds such as sodium hypochloride (NaOCl), potassium permanganate (KMnO4) and hydrogen proxide (H2O2) is their high cost. Ozone has been reported to be the most powerful oxidant after F2O and O2[12]. Ozone is a bluish, unstable gas with a pungent odor. It liquefies at -112°C and has an odor detection level of 0.02-0.05 ppm. Ozone decomposes spontaneously. Some specifications of ozone are shown in Table 5. Table 6 shows some chemical reactions between ozone and selected odorous compounds.
Objectives: Ozone is well known for its oxidizing properties and can be used to reduce the bacterial population responsible for production of offensive products from animal manure. The aim of this study was to evaluate the effectiveness of ozone in reducing odor emission from animal manure. The specific objectives were:
• To evaluate the effectiveness of ozone in a batch operation for treating animal manure
Table 5: Ozone specifications
Characteristic Description
Atomic weight 48 g mole−1
Color Bluish
Odor Pungent
Oxydo-reduction potential +2.07 V
Odor detection limit 0.02-0.05 ppm
Stability Unstable gas, decompose spontaneously
in atmospheric or aquatic medium into O2 and O
Production Through the action of ultraviot light or
light voltage electric discharge
Atomic structure
Table 6: Some ozone chemical reactions
Compound Reaction
Amine (R3N) R N3 +O3→R NO O3 + 2
Methane(CH4) 2CH4+2O3→CO2+CO 4H O+ 2
Hydrogen sulfide (H2S) H S O2 + 3→ +MajorPath S H O O2 + 2
MinorPath
2 3 2 2
H S O+ →SO +H O
Methyl Mercaptan (CH3SH) CH SH O3 + 3→CH3−SO H3
Dimethyl sulfide (CH3SCH3) CH SCH3 3+O3→CH SOCH3 3+O2
Dimethyl disulfide (CH3S2CH3) CH S CH3 2 3+2O3→2CH SO3 3
• To evaluate the possibility of injecting ozone into animal manure during the strong period
MATERIALS AND METHODS
Experimental setup: The experimental setup shown in Fig. 2 consisted of the ozone generator, manure treatment colum, pumping system and the manure pit. The ozone generator used in this study was OZOLab T25 (Degremont, Monteral, Quebec, Canada). The generator is capable of producing up to 16 g ozone/h from air. Ozonated air flow can be varied from 150-1500 L h−1. It can, also, produce ozone from oxygen up to 26 g ozone h−1. The flow of cooling water varies from 25-250 L h−1. Air (or O2) is injected into a desiccator at a pressure of 6-8 atmosphere. After desiccation, the pressure is reduced to 0.5 atmosphere and the air (or O2) is introduced into the ozone producing cell (long glass tube). The ozone production is monitored by a tension variation in the glass tube which can be as high as 20,000 volts.
A 550 L column was used for both batch and continuous treatment operation of liquid animal manure Ozonated air (or O2) was injected through a diffusion plate at the bottom of the column.
Table 7: Ozone application rate during continuous operation Ozonated air flow O3 application rate (O3 L−1 manure) --- ---
mg O3 L−1 LO3 h−1 425 L h−1 850 L h−1
11475 0170 27.0 13.6
13005 0510 30.6 15.3
14450 0850 34.1 17.0
15980 1190 37.6 18.8
The Nova Scotia Agriculture College dairy barn was selected as site of the experiment. The barn has a slotted floor and an underground manure collection pit. It housed 200 milking cows. The study was carried out during the month of July when the manure decomposition was particularly high and the odor was noticeable. The pit confined approximately 175 m3 of manure with an average moisture content of 79%.
Experimental procedure: For the batch operation, the column was filled with 550 L of raw manure. Ozone was then injected at the base of the column at a rate 25 mg O3 L−1 of manure (about 540 L of ozonated air h−1). A total of 5 samples were collected every hour. The experiment was repeated 5 times.
For the continuous flow operation, the column was filled with 550 L raw manure. Two manure flow rates were selected: 425 and 850 L h−1. Manure was pumped to the bottom of the column so that the application of ozonated air and manure were in the concurrent flow mod. This gave manure/ozonated air contact times of 38.8 and 79.6 min for the manure flow rates of 850 and 425 L h−1, respectively. The ozone application rate was varied from 11475-15980 mg O3 h−1 as shown in Table 7.
Odor evaluation: Suprathreshold analysis of odor offensiveness used by Sobel[15] was preferred to the dilution threshold methods designed for odor strength evaluation. The experimentation standards and odor analyses were as follow: (a) each treatment (batch or continuous) was repeated 5 times. (b) The samples collected in each treatment were judged by a 10 person panel, thus resulting in 50 values (5×10). And (c) for each set of 50 values corresponding to a particular treatment (batch or continuous), the mean and standard deviation were calculated.
Table 8: Example of odor evaluation of a batch treatment
Panelists odor score (1-10)
---
Replicate 1 2 3 4 5 6 7 8 9 10 Mean SD CV (%)
1 5 7 6 6 5 6 7 8 6 7 6.3 1.0 15.5
2 6 5 6 7 6 7 7 6 5 7 6.2 0.9 14.1
3 7 6 7 6 5 7 7 5 6 7 6.3 0.8 13.1
4 6 5 7 6 6 6 7 7 6 7 6.4 0.9 14.1
5 7 6 6 6 7 6 5 6 7 7 6.0 1.0 16.2
Average of 5 replicates 6.2
Fig. 2: Experiment set up
RESULTS
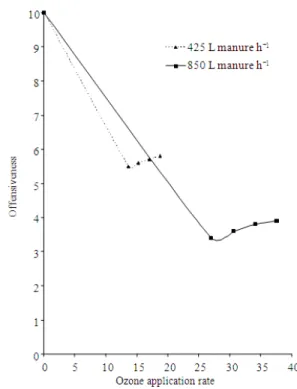
The calculations of the evaluation results were performed according to those suggested by Ghaly[16]. Table 8 shows a sample calculation for the 50 values (5 replicates × 10 panel members) of each treatment. The effect of treatment time (ozonation rate) on the odor offensiveness of batch treated animal manure is shown in Fig. 4. The effect of ozone application rate on the odor offensiveness of manure treated under continuous flow operation with different manure flow rates are shown in Fig. 5.
DISCUSSION
The odor evaluation date obtained from the panelists indicated that the test can be used with high confidence. A panel of 10 member and 5 replicates of the sample seemed very reasonable when using this type of order evaluation. The standard deviation varied
from 0.8-1.0 and the coefficient of variation was in the range of 13.1-16.2%.
The batch experiment results (Fig. 4) indicated that 1 h treatment duration can reduce the offensive nature of the odor from 10-4.6 (56% reduction). Increasing the treatment duration slightly decreased the offensive nature of the odor to 4.0, 3.6, 3.3 and 3.1 for the 2-5 h treatment, respectively. This means increasing the duration time by 100, 200, 300 and 400% slightly reduced the offensive nature of the odor by 6, 9, 13 and 15%, respectively (or 13, 22, 28 and 33% over that of 1 h treatment, respectively).
The results obtained from the manure continuous flow experiment (Fig. 5) indicated that the faster the flow of the manure, the lower the reduction in the offensive nature of the odor. At the lowest ozonation rate, when the flow of the manure was 850 L h−1, the offensiveness of the treated manure was reduced from 10 to only 5.5, while that of 425 L h−1 resulted in the reduction in the offensiveness of the treated manure from 10-3.7. The results also indicated that increasing the ozone application rate did not reduce the odor offensiveness but resulted in slight increases of the offensiveness of the treated manure. This phenomena of olfactory synergisms on both hydrogen sulfide (H2S) and methylamine (CH3 NH2) interaction with ozone (O3) was first reported by Gills[14]. The release of these chemical intermediate compounds into the manure resulted in an increase in the offensiveness of the treated manure.
Fig. 3: Odor evaluation sheet
Table 9: Cost analysis
Item Unit Value
Number of animals 200.00
Amount of manure produced t day−1 92.00
t year−1 33580.00
L year−1 33580000.00
Amount of ozone required (kg year−1)1 3962.00
(kg day −1)2 22.00
Total equipment cost3 88000.00
$/t4 0.13
$/t5 0.18
Total cost of treatment6 $/t 0.23
1: Estimated at 0.000118 kg O
3 L−1 manure; 2: Estimated at 180 treatments per year; 3: Estimated at 4000 $/ kg O
3; 4: Estimated over 20 years amortization period; 5: Estimated on the basis of 12%
interest over 20 years using the formula 0.12 20
1 (1 0.12)−
− +
;
6:
Including the capital cost and the operation cost of the equipment
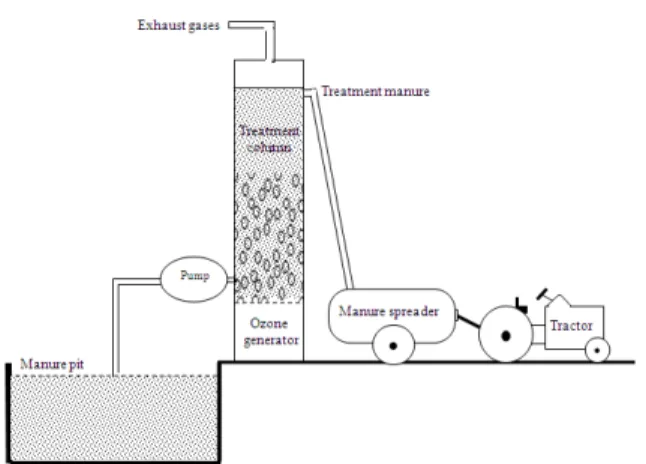
These results give a quantitative insight into the affect of ozone treatment on the level of offensiveness of animal manure and can be used in the design of a mobile apparatus for the treatment of manure before pumping for land application (Fig. 6).
The cost of ozone generator equipment can be calculated in $ kg−1 O3 produced. An installation producing 10 kg O3 day−1 costs $ 40000 or 4000 $/kg O3. the electricity consumption of the equipment was measured during the operation and found to be 1.5 kWh per ton of manure which represent a cost of ¢ 5/ton of manure. An estimate of the cost of buying and running ozone treatment for 200 cows is shown in Table 9.
Fig. 4: Effect of treatment time on odor offensiveness during batch operation
Fig. 6: Proposed mobile O3 manure treatment during pumping for land application
CONCLUSION
The use of ozone for the treatment of animal manure proved to be effective in reducing the odor offensiveness. A minimum 3.4 level out of 10 (66% reduction) was achieved in the continuous operation, while a minimum of 3.1 (69% reduction) was achieved in the batch operation. The results indicated that mixing is very important. Increasing the amount of O3 increased the level of offensiveness which was attributed to the presence of intermediate products due to the interaction of ozone with some chemicals, especially hydrogen sulfide (H2S) and methylamine (CH3 NH2). The cost analysis indicated that the treatment is economical as a ton of manure could be treated at a cost of $0.23.
REFERENCES
1. Amon, B., V. Kryvoruchko, T. Amon and S. Zech Meister-Boltenstem, 2006. Methane, nitrous oxide and ammonia emissions during storage and after application of dairy cattle slurry and influence of slurry treatment agriculture. Ecosyst. Environ., 12: 153-162.
2. Fares, F., A. Albalkhi, J. Dec, M.A. Burns and J. Bollage, 2005. Physicochemical characteristics of animal and municipal wastes decomposed in arid soils. J. Environ. Qual., 34: 1392-1403.
3. Pierson, S.T., M.L. Cabrrva, G.K. Evanylo, H.A. Kuykendalland C.S. HoveLand et al., 2001. Phosphorus and ammonia concentrations in surface runoff from grasslands fertilized with broiler litter. J. Environ. Qual., 30: 1784-1789.
4. Martin, S.A. and M.A. McCann, 1998. Microbiological survey of Georgia poultry litter. J. Applied Poul. Res., 7: 90-98.
5. Merkel, J.A., T.E. Hazen and J.K. Miner, 1969. Identification of gases in confinement swine building atmosphere. Trans. ASAE., 12: 221-228. 6. Burnett, W.E. and W.C. Dondero, 1970. Control of
odors from animal wastes. Trans. Anim. Sci., 13: 221-224.
7. Koelliker, J. K., J. R. Minner, M. L. Hellickson and H. S. Nakaue. A zoelite packed air scrubber to improve poultry house environment. Trans. ASAE, 23: 157-161.
8. Burnett, W.E., 1969. Air pollution from animal wastes: determination of malodors by gas chromatographic and organoleptic techniques. Environ. Sci. Technol., 3:744-749.
9. Cai, L., J. A. Koziel, Y. C. Lo and S. J. Hoff, 2006. Characterization of volatile organic compounds and odrants associated with swine particulate matter usin solid pase extraction and gas chromatography-mass spectrometry-plfactometry. J. Chromatogr. Anal., A1102: 60-72.
10. Ritter, W.F., M.E. Collins and R.K. Eastburn, 1975. Chemical treatment of liquid dairy manure to reduce malodors. Proceeding of the 3rd International Symposium on Livestock Wastes, ASAE Publication, St. Joseph, MI.
11. Muehliy, A., 1979. Odor control products prove ineffective. Hog Farm Manage., 16: 76-78.
12. Rice, R.G. and M.E. Browning, 1976. Ozone Analytical Aspects and Odor Control. The International Ozone Institute inc., Jamesville, NY., pp: 240.
13. Miner, J.R. and R.J. Smith, 1975. Livestock Waste Management with Pollution Control. Midwest Plan Service, Ames, Iowa, pp: 88.
14. Gill, A.E., 1975. Models of Equatorial Current. In: Numerical Models of Ocean Circulation, Durham, N.A. (Ed.). National Academy of Science, Washington, pp: 181-203.
15. Sobel, A.T., 1970. Olfactory measurement of Animal manure odor. American Society Agricultural Engineering, Paper No. 70: 417. 16. Ghaly, A.E., 1982. Minimal aeration of swine