Futsch
,
Tau
, and
MESK2
Homologues in the Brain of the
European Honeybee (
Apis mellifera
L.)
Kumi Kaneko1, Sayaka Hori1., Mai M. Morimoto1., Takayoshi Nakaoka1
, Rajib Kumar Paul1, Tomoko
Fujiyuki1, Kenichi Shirai1, Akiko Wakamoto2, Satomi Tsuboko1, Hideaki Takeuchi1, Takeo Kubo1*
1Department of Biological Sciences, Graduate School of Science, The University of Tokyo, Bunkyo-ku, Tokyo, Japan,2DNA Chip Research Inc., Tsurumi-ku, Yokohama, Kanagawa, Japan
Abstract
Background: The importance of visual sense in Hymenopteran social behavior is suggested by the existence of a Hymenopteran insect-specific neural circuit related to visual processing and the fact that worker honeybee brain changes morphologically according to its foraging experience. To analyze molecular and neural bases that underlie the visual abilities of the honeybees, we used a cDNA microarray to search for gene(s) expressed in a neural cell-type preferential manner in a visual center of the honeybee brain, the optic lobes (OLs).
Methodology/Principal Findings:Expression analysis of candidate genes using in situhybridization revealed two genes expressed in a neural cell-type preferential manner in the OLs. One is a homologue ofDrosophila futsch, which encodes a microtubule-associated protein and is preferentially expressed in the monopolar cells in the lamina of the OLs. The gene for another microtubule-associated protein,tau, which functionally overlaps withfutsch, was also preferentially expressed in the monopolar cells, strongly suggesting the functional importance of these two microtubule-associated proteins in monopolar cells. The other gene encoded a homologue of Misexpression Suppressor of Dominant-negative Kinase Suppressor of Ras 2 (MESK2), which might activate Ras/MAPK-signaling inDrosophila.MESK2was expressed preferentially in a subclass of neurons located in the ventral region between the lamina and medulla neuropil in the OLs, suggesting that this subclass is a novel OL neuron type characterized byMESK2-expression. These three genes exhibited similar expression patterns in the worker, drone, and queen brains, suggesting that they function similarly irrespective of the honeybee sex or caste.
Conclusions:Here we identified genes that are expressed in a monopolar cell (AmfutschandAmtau) or ventral medulla-preferential manner (AmMESK2) in insect OLs. These genes may aid in visualizing neurites of monopolar cells and ventral medulla cells, as well as in analyzing the function of these neurons.
Citation:Kaneko K, Hori S, Morimoto MM, Nakaoka T, Paul RK, et al. (2010)In SituHybridization Analysis of the Expression ofFutsch,Tau, andMESK2Homologues in the Brain of the European Honeybee (Apis melliferaL.). PLoS ONE 5(2): e9213. doi:10.1371/journal.pone.0009213
Editor:Paul A. Bartell, Pennsylvania State University, United States of America
ReceivedOctober 22, 2009;AcceptedJanuary 25, 2010;PublishedFebruary 16, 2010
Copyright:ß2010 Kaneko et al. This is an open-access article distributed under the terms of the Creative Commons Attribution License, which permits unrestricted use, distribution, and reproduction in any medium, provided the original author and source are credited.
Funding:This work was supported in part by the Program for Promotion of Basic Research Activities for Innovative Bioscience (PROBRAIN) and the Grant-in-Aid for Scientific Research on Innovative Areas ‘‘Systems Molecular Ethology’’ from the Ministry of Education, Culture, Sports, Science and Technology (MEXT) of Japan. These funders had no role in study design, data collection and analysis, decision to publish, or preparation of the manuscript.
Competing Interests:Ms. Akiko Wakamoto, a co-author of this article, is employed by a company, DNA Chip Research Incorporation (JAPAN). The other authors collaborated with Ms. Wakamoto to construct cDNA microarray and perform hybridization. Actually, she printed cDNA subclones that we sent to her on the chips, and hybridized the cDNA microarray chips to labeled cDNA target that we sent to her, at the cost price. She sent back all the hybridization data and microarrays to our lab, after the experiments. There is no consultancy, patents, products in development, or marketed products etc, that the company has related to our article. The authors hereby confirm that the Ms. Wakamoto’s employment does not alter at all our adherence to all the PLoS ONE policies on sharing data and materials, as detailed online in the ‘guide for authors’.
* E-mail: [email protected]
.These authors contributed equally to this work.
Introduction
Some insect species possess a highly developed visual sense that is essential for adaptation to the environment [1,2]. The European honeybee (Apis melliferaL.) is a social insect, and its colony consists of three types of adults: queens (female reproductive caste), workers (female labor caste), and drones (reproductive males) [3]. In addition, the workers shift their labors from nursing their brood (nurse bees) to foraging (foragers), according to their age after adult emergence [3]. Highly developed visual ability is especially important for social Hymenopteran insects, because they must
insect brain, and is then projected to other brain areas, such as the mushroom bodies (MBs), a higher-order integration center of the insect brain [7–11]. The OLs are composed of three layers of neuropil: the lamina, which directly contacts the retina; the medulla; and the lobula [7]. Electrophysiologic studies suggest that the proportion of neurons involved in the detection of light wavelength, location, and motion direction differs in each of the three neuropil layers [12–19]. Anatomically, neurons in the OLs comprise groups termed ‘cartridges’ in the lamina, and groups termed ‘columns’ in the medulla and lobula. Neurons in these cartridges and columns are classified into subtypes based on their morphology or projection patterns [7,20–23]. The ability of honeybees to discriminate various colors, shapes, patterns, and motion direction have been studied in both free-flying [4,24] and harnessed bees [25–27]. Due to the small and rather simple honeybee brain and their high visual abilities, the honeybee represents an excellent model for analyzing visual information processing in the brain.
The importance of visual ability in the honeybee might be reflected in their brain structures. The MB structure changes depending on the division of labor of the workers from nursing to foraging, and correlates with the foraging experience of the foragers [28,29]. It is thus plausible that visual experience affects patterns or densities of axonal projections of OL neurons to the MBs. In addition, in Hymenopteran insects, visual information processed in the OLs is projected directly to the MBs [7,9,30,31], whereas in many other insect species, such as the fruit fly, the MBs are important for olfactory processing and there are few or no direct neuronal connections between the OLs and MBs [7,10,32]. Some OL cell types might be responsible for gauging the optic flow, which would help to make foraging behavior possible. In addition, OL neurons might have specific neural plasticity that underlies the changes in the MB structure depending on the division of labor and/or foraging experiences. The molecular and neural bases that underlie the honeybee visual abilities essential for their social behaviors, however, remain largely unknown.
Recent studies revealed that many genes are expressed in a MB-preferential manner in the adult honeybee brain [33–40], suggesting that functional specialization of the MB depends on the distinct gene expression profiles. Functional analysis of these genes by manipulating their expression using reverse genetic methods will provide important clues for understanding the MB-dependent brain functions. In addition, these genes might be used as reporter genes to aid in visualizing the MB neural circuits that express the genes by introducing fluorescent protein genes ligated downstream of their promoters, a method that has been applied in other animal species [41,42]. Therefore, ‘molecular dissection’, in which genes expressed in a brain region-preferential manner are systematically identified, could be a promising methodology for analyzing the molecular and neural bases of honeybee brain functions. Although transcriptomic profiling of central nervous system regions in three honeybee species has also be reported [43], specific gene(s) that may be useful markers for labeling the OL neural circuits in insect brains have not been identified in insects, including honeybees.
The present study aimed to identify gene(s) with various expression patterns in the OLs in the honeybee brain. A cDNA microarray was used to screen genes that are expressed strongly in the OLs in the honeybee brain, and then expression analyses of the candidate genes were performed to reveal their expression patterns in the OLs. Here, we report the identification of two genes expressed in a neural cell type-preferential manner in the OLs of the honeybee: The first was a homologue ofDrosophila futsch, which encodes a microtubule-associated protein [44,45], and is
prefer-entially expressed in the monopolar cells in the lamina of the OLs. In addition, the gene for another microtubule-associated protein,
tau[46,47], was also preferentially expressed in the monopolar cells. The second gene encoded a homologue of Misexpression Suppressor of Dominant-negative Kinase Suppressor of Ras 2 (MESK2) [48]. These genes exhibited similar expression patterns irrespective of the sex or caste of the honeybees.
Results
Gene Structure of Amfutsch, Which Was Identified by Screening of Genes Strongly Expressed in the OLs in the Honeybee Brain
To obtain useful marker genes for labeling specific neurons in the honeybee OLs, we first searched for genes that were expressed more strongly in the OLs than in the other brain regions, based on the supposition that such genes would be more suitable for discriminating OL neurons that express the genes. We used a cDNA microarray with over 5000 cDNA subclones that represent various genes expressed in the adult honeybee brains to screen gene(s) that are expressed more strongly in the OLs than in the other regions of the honeybee brain (for details of the screening, see the Materials and Methods section) [35,39].In situ hybridiza-tion of the candidate clones led to the identificahybridiza-tion of two clones (Clone#1 and#2).
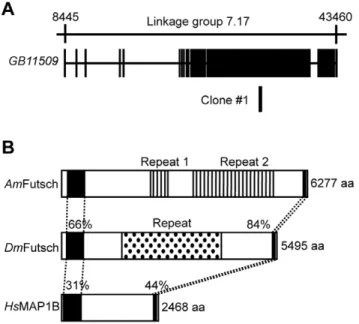
An NCBI database (http://www.ncbi.nlm.nih.gov/) search revealed that Clone#1 corresponded to a part of the exon of a predicted honeybee gene,GB11509, which is located at Linkage group 7 in the honeybee genome and spans approximately 35 kbp (Fig. 1A).GB11509[honeybee (Am)futsch] encodes a homologue of
Drosophila Futsch (DmFutsch) and a mammalian Microtubule Associated Protein 1 (MAP1), such as human MAP1B (HsMAP1B). These two proteins form a protein family: a class of microtubule-binding proteins with conserved structures [44,45].
DmFutsch andHsMAP1B have two highly conserved domains in both the N- and C-terminal regions, and their sequence identities with honeybee Futsch (AmFutsch) were 66% and 31% (N-terminal region), and 84% and 44% (C-terminal region), respectively (Fig. 1B). The proteins had distinct intervening amino acid sequences between the highly conserved domains. DmFutsch contained a 66x tandem repeat of approximately 37 amino acids, SVAEKSPLASKEASRPASVAESVKDEAEKSKEESRRE [44], whereas AmFutsch contained two kinds of repeats in the intervening region (Fig. 1B; Repeat 1 and 2, respectively). Both sequences differed from those ofDmFutsch: Repeat 1 represented an approximately 25x tandem repeat of 18 amino acid sequences, KKEEKKPV/EEEEKEL/IKVEE, whereas Repeat 2 represent-ed an approximately 50x tandem repeat of 42 amino acids, EKSRSPSVTSVTAETKEPSDKSKSPSVAGEV/KPELKDVDT -KEI, where the highly frequent amino acid residues are aligned, respectively (Fig. 1B). A database search revealed thatAmFutsch had the highest sequence similarity with DmFutsch, and there was no other complete gene that had sequence similarities withDmFutsch. Thus, we concluded that Clone#1 corresponded toAmfutsch. Clone
#1 was located at the most N-terminal of Repeat 2 (Fig. 1B).
Amfutsch Expression Analysis in the Honeybee Brain
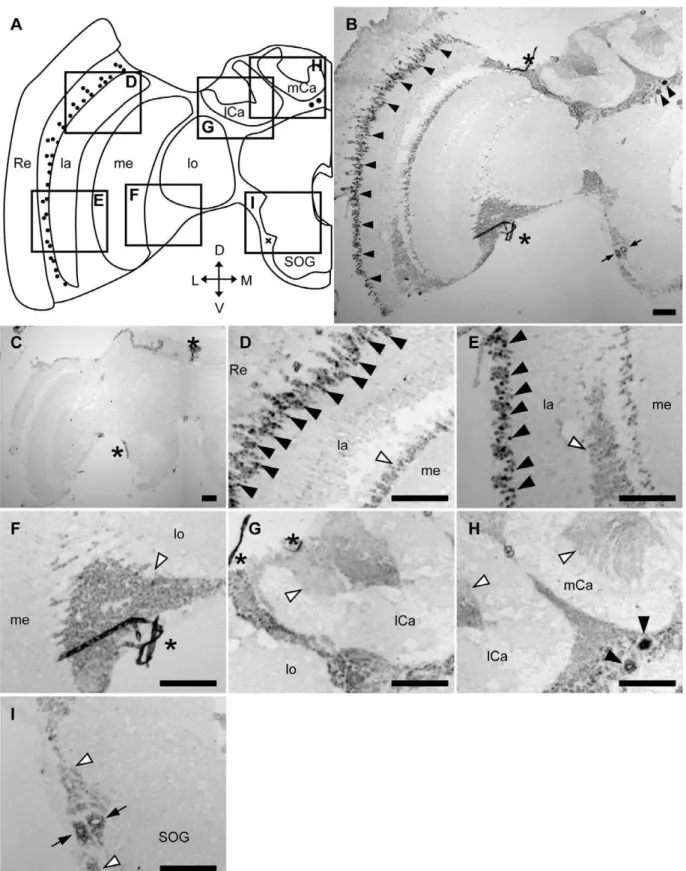
with large somata located beneath the calyces of the MBs (black arrowheads in Fig. 2H). In addition, intermediate signals were sometimes detected in two other brain regions: 1) a few cells with large somata located in the lateral area of the subesophageal ganglion (SOG; arrows in Fig. 2I); and 2) some cells located between the OLs and MBs (arrows in Figs. S2G and S3F, for queen and drone brains, respectively). Frequent, but not constant, detection of these two signals may depend on the individual experiment or the depths of the sections used. In contrast, there were no intense signals in the other brain regions, including the inside of the calyces of the MBs (white arrowheads in Fig. 2G, H), cells between the lamina and medulla (white arrowheads in Fig. 2D, E), cells between the medulla and lobula (white arrowhead in Fig. 2F), or cells located around SOG (white arrowheads in Fig. 2I). These signals were not detected in sections hybridized with sense probe (Fig. 2C), indicating that the signals were due to the expression of Amfutsch. Although Amfutsch was expressed weakly in the whole brain cortex, it was expressed preferentially in restricted neural cell types, suggesting the importance of this gene product in these cells (Fig. 2B, C). Essentially the same expression profile was detected in all forager (Fig. S1), queen (Fig. S2) and drone brains (Fig. S3), suggesting that
Amfutsch functions similarly in these neural cell types in the honeybee brain, irrespective of the sex, caste, and worker age-polyethism.
Analysis of Co-Expression of Amfutsch and Amtau in the OLs of the Honeybee Brain
We next examined the possible co-expression ofAmfutschwith honeybeetau(Amtau) in the lamina. The genetaualso encodes a microtubule-associated protein, which functionally overlaps with
Futsch/MAP1, and Tau works cooperatively with Futsch/MAP1 in the neurons of various animal species [44–47]. Therefore, we hypothesized that Amfutsch and Amtau are co-expressed in the honeybee brain. To test this possibility, we first searched fortau
homologue in the honeybee genome using the NCBI database. Two predicted genes,hmm14986 and hmm75911were identified.
Hmm14986 is located at the Linkage group 12 (Fig. 3A) and encodes a protein with five microtubule-binding domain (MTBD) repeats, each of which have high (83, 63, 78, 79 and 94%, respectively) sequence identities with the corresponding MTBD repeats ofDrosophilaTau (DmTau) (Fig. 3B, C). On the other hand,
hmm75911is located at the genomic contig, Un.3121, and encodes a partial amino acid sequence with three MTBD repeats (data not shown). These two genes have almost (approximately 99%) the same nucleotide sequences, which may indicate that they represent the same gene.
InDrosophila, although Tau-immunoreactive cells were detected in the adult photoreceptor neurons [46],in situhybridization of
Dmtauin the adult brain has not been performed. We analyzed
Amtau-expression in the honeybee brain by in situ hybridization using brain sections of foragers and nurse bees and a probe that corresponds to a region including the most N-terminal MTBD repeat of the predicted AmTau (Fig. 3A). Essentially the same
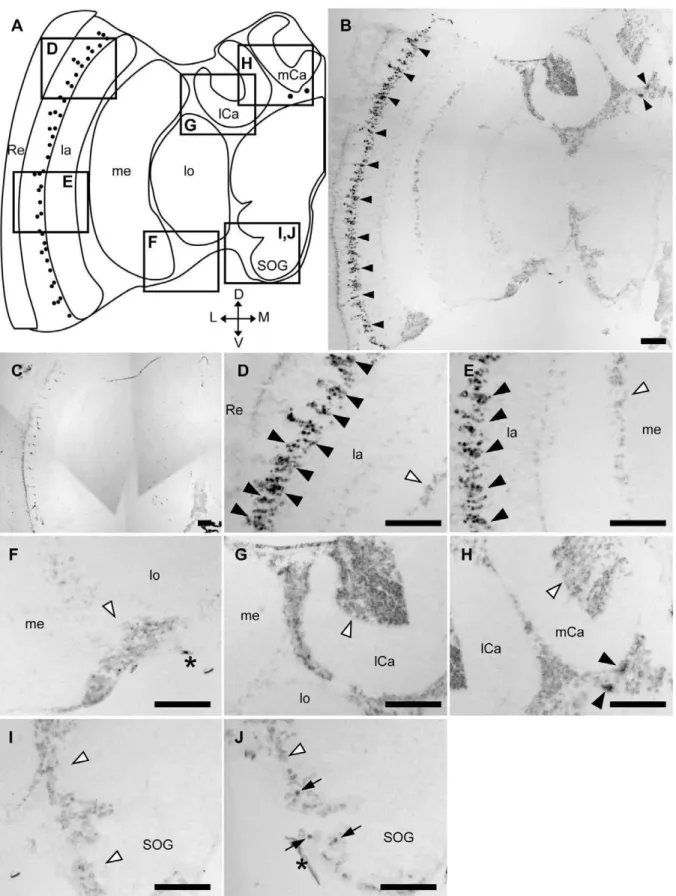
Amtau-expression profile was observed in both nurse bee (Fig. S4) and forager brains (Fig. 4). Furthermore,Amtau-expression in the honeybee brain resembled that ofAmfutsch. Although weak signals were detected in the whole brain cortex (Fig. 4A, B), stronger signals were detected in two restricted brain regions in the forager brain: 1) in a part of the lamina cells (black arrowheads in Fig. 4D, E); and 2) a few cells with large somata and are located beneath the MBs (black arrowheads in Fig. 4H). In addition, intermediate signals were sometimes detected in two other brain regions: 1) a few cells with large somata located in the lateral area of the SOG (arrows in Fig. 4J); and 2) some cells located between the OLs and MBs (data not shown). In contrast, there were no intense signals in other brain regions (white arrowheads in Fig. 4D–J). These signals were not detected in sections hybridized with sense probe (Fig. 4C), indicating that the signals represented Amtau-expression. These results indicated that Amfutsch and Amtau were expressed in the similar brain regions. Similar to Amfutsch, although Amtau is expressed weakly in the whole brain cortex, it is expressed preferentially in restricted neural cell types, suggesting the importance of this gene product in these cells (Fig. 4B, C).
Next, to identify the cell types that expressAmfutschandAmtauas well as to further confirm the co-expression ofAmfutschandAmtau
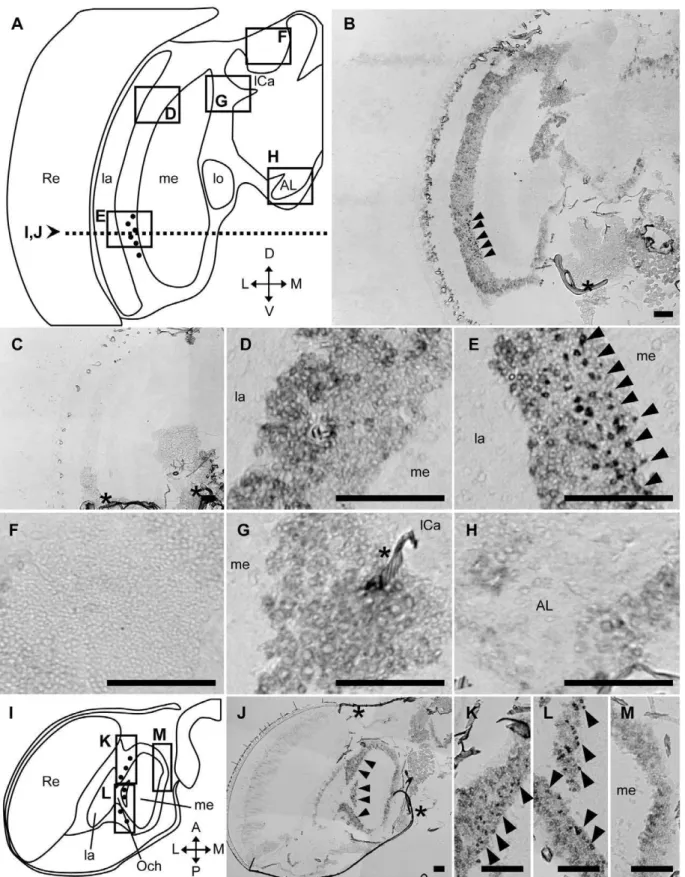
in the lamina, we performed double fluorescentin situ hybridiza-tion usingAmfutsch- andAmtau-specific antisense RNA probes and horizontal sections of the forager brain, followed by nuclear staining with DAPI (Fig. 5). Expression of bothAmfutschandAmtau
was detected preferentially in a subclass of lamina cells located between the retina and lamina (blue arrowheads in Fig. 5D–G). The neurons and glial cells exhibit unique distribution patterns in the lamina of the OLs [20]. Comparison of theAmfutsch/Amtau -expressing cells by staining the nuclei with DAPI suggested that these cells were monopolar cells (blue arrowheads in Fig. 5H–K) and not glial cells (white arrowheads in Fig. 5H–K), whose cell bodies are located at the inner and outer parts of the cortex between the retina and lamina, respectively [20], although we could not definitely conclude that they are neurons but not glial cells, without staining with glial markers. The signals for both
Amfutsch- andAmtau-expression were detected in monopolar cells, and they overlapped at least in some monopolar cells (Fig. 5H–K), indicating that lamina monopolar cells preferentially expressed bothAmfutschandAmtauin the OLs.
Figure 1. Gene structure of the predicted gene corresponding to Clone #1. Genomic organization of the predicted gene corre-sponding to Clone#1(A) and comparison of the domain structure of Futsch/MAP1B (B). (A) Exon (closed boxes) and intron (lines) structures of the predicted gene and the location of Clone#1 are indicated below the corresponding linkage group (upper line). (B) The two closed boxes inAmFutsch,DmFutsch andHsMAP1B indicate the N-terminal and C-terminal conserved regions, respectively. The two striped boxes in
AmFutsch and the dotted box inDmFutsch indicate tandem Repeat 1 and 2, and Repeat, respectively. The numbers above the conserved regions indicate sequence identities withAmFutsch.
Figure 2.In situhybridization ofAmfutschin the nurse bee brain.In situhybridization using DIG-labeled RNA antisense (B, D–I) and sense (C)
Amfutschprobes with nurse bee brain sections. (A) Schematic representation of the signals detected in the left-brain hemisphere of the nurse bee brain. Black circles and a black check mark indicate stronger or intermediate signals, respectively. (D–I) Magnified views of parts of (B) corresponding to the boxes shown in (A). The stronger signals detected in the lamina (D, E) and in the other region (H) are indicated by black arrowheads. White arrowheads indicate the regions with no significant signals (D–I). Black arrows indicated intermediate signals near the SOG (I). Scale bars = 100mm. Asterisks indicate non-specific staining. D, dorsal; L, lateral; la, lamina; lCa, lateral calyx; lo, lobula; M, medial; me, medulla; mCa, medial calyx; Re, retina; SOG, subesophageal ganglion; V, ventral. Note that each panel (panels D–I) shows repeated views of the same section rather than multiple sections from multiple brains.
To obtain evidence thatAmFutsch andAmTau also function as ‘microtubule-associated proteins’ in the honeybee brain, we used
in situ hybridization to examine the expression of Amfutsch and
Amtau in the developing pupal brains, based on the assumption
that these genes are expressed in the differentiating neurons in the developing pupal brains. As expected, both Amfutsch and Amtau
were expressed in the developing pupal brains (Supporting Information S1, Fig. S5 and S6). Unexpectedly, however, these genes were differentially expressed in the pupal brains: Amfutsch
was expressed in the whole brain cortex except for the mushroom bodies (MBs), whereasAmtauwas expressed around the prolifer-ating MB cells, suggesting that these genes function in a brain-region dependent manner in developing pupal brains (Supporting Information S1, Fig. S5 and S6). We could not identify differentiating monopolar cells and thus examine the expression of these genes in these cells.
Gene Structure of Honeybee MESK2
Clone #2 corresponded to the putative intron region of a deduced gene, GB18470, which is located at Linkage group 6 (Fig. 6A). NCBI database search revealed thatGB18470encodes a protein that has the highest sequence similarity with Drosophila
Misexpression Suppressor of dominant-negative KSR (Kinase Suppressor of Ras) 2 (MESK2). TheDrosophilaMESK2 isoform I (GenBank accession No. AAS64904.1) consists of 485 amino acid residues and contains an Ndr domain, which is the domain conserved among proteins encoded by the N-myc downstream regulated gene family (Fig. 6B) [48] (http://www.ncbi.nlm.nih. gov/Structure/cdd/wrpsb.cgi). The predicted protein encoded by
GB18470consists of 383 amino acid residues and contains an Ndr domain that also has sequence identity (74%) with that of
DmMESK2 (Fig. 6B). Because there were no genes other than
GB18470similar toDmMESK2in the honeybee genome, and the protein encoded byGB18470had the highest sequence similarity with DmMESK2 in the honeybee genome, we concluded that
GB18470is theDmMESK2homologue (AmMESK2).
To confirm that Clone#2 actually corresponded to the intron region ofAmMESK2, we intended to examine whether Clone#2 is connected with the predicted 6th exon on a precursorAmMESK2
mRNA, by amplifying partial cDNA that contained both Clone
#2 and the predicted 6th exon region of AmMESK2by reverse transcription-polymerase chain reaction (RT-PCR) (Supporting Information S1, Fig. S7). A cDNA fragment of approximately 700 bp, which is consistent with the predicted size (678 bp), was obtained, supporting our notion that Clone#2 corresponds to an intron of AmMESK2. We can’t exclude the possibility, however, that there are some alternative splice variants and that Clone#2 partly includes sequences for these splice variants.
Expression Analysis of AmMESK2 in the Honeybee Brain
DmMESK2 was originally identified by screening genes with the potential to modulate RAS-signaling when misexpressed [49], and its actual functions and expression profile have not been analyzed. Therefore, we performedin situhybridization ofAmMESK2using the forager brain sections and an ‘intron probe’ that corresponded to the sequence (Clone#2) obtained by the cDNA microarray analysis. Significant signals were detected in only a single brain region: a few dozen neurons whose somata were located at the ventral part of the cortex between the lamina and medulla of the OLs (Fig. 7A, B, E). No significant signals were detected in the other brain regions including the OL (Fig. 7D, G), the inside of the calyces of the MBs (Fig. 7F), and cells around the SOG (Fig. 7H). These signals were not detected in sections hybridized with sense probe (Fig. 7C), indicating that the signals representedAmMESK2 -expression. Interestingly, AmMESK2 was not expressed in the dorsal or middle part of the OLs (Fig. 7D), indicating that
AmMESK2 was expressed preferentially in the ventral part of the Figure 3. Gene structure of the predicted geneAmtau.Genomic
organization of the predicted gene Amtau (A), comparison of the domain structures of Tau (B) and alignment of amino acid sequences of MTBD repeats (C). (A) Exon (closed boxes) and intron (lines) structures of the deduced gene and the location of the probe used forin situ
hybridization are indicated below the corresponding linkage group (upper line). Closed boxes in (B) indicate microtubule-binding regions of AmTau andDmTau. The numbers above these regions of AmTau indicate sequence identities with corresponding regions inDmTau. (C) The amino acid sequences of MTBD Repeat 1–5 ofDmTau (upper amino acid sequence) andAmTau (lower amino acid sequence) are aligned, where the gray background indicate the identical amino acid residues. The numbers on the left and right of each sequence indicate amino acid positions in each protein.
Figure 4.In situhybridization ofAmtauin the forager brain.In situhybridization using DIG-labeled RNA antisense (B, D–I) sense (C)Amtau
probes and the forager brain sections. (A) Schematic representation of signals detected in the left-brain hemisphere of the forager brain. Black circles indicate stronger signals. (D–I) Magnified views of parts of (B) corresponding to the boxes shown in (A). (J) Magnified view of the same part as (I) of another section, which includes intermediate signals. The stronger signals detected in the lamina (D and E) and the other region (H) are indicated by black arrowheads. White arrowheads indicate regions with no significant signals (D–J). Black arrows indicated intermediate signals near the SOG (J). Scale bars = 100mm. Asterisks indicate non-specific staining. D, dorsal; L, lateral; la, lamina; lCa, lateral calyx; lo, lobula; M, medial; me, medulla; mCa, medial calyx; Re, retina; SOG, subesophageal ganglion; V, ventral.
Figure 5. Doublein situhybridization ofAmfutschandAmtauin the OLs of the forager brain.Fluorescent doublein situhybridization using DIG-labeled RNA antisenseAmfutschandAmtauprobe and horizontal sections of forager brains, followed by DAPI staining. (A) Schematic representation of the structure in the vertical brain sections. White regions correspond to neuropil, whereas gray regions indicate cortex. (B) Schematic representation of the structure in the horizontal brain section corresponding to the dotted line in (A). (C) Schematic representation of the structure in the horizontal brain section corresponding to the box shown in (B). Black circles indicate monopolar cells with signals, and white circles indicate glial cells with no signals. (D–G)In situhybridization of the box shown in (B): (D) with antisenseAmfutschprobe, (E) with antisenseAmtau
probe, (F) nuclear staining with DAPI, and (G) merged images in (D–F). Red, green, and blue signals in (G) indicateAmfutsch- andAmtau-expression and nuclear staining with DAPI, respectively. (H–K) Magnified views corresponding to the boxes shown in (D–G), respectively. The stronger signals detected in the lamina monopolar cells are indicated by blue arrowheads, and regions with no significant signals are indicated by white arrowheads. Scale bars = 100mm. Asterisks indicate non-specific staining. D, dorsal; Ich, inner chiasma; L, lateral; la, lamina; lo, lobula; M, medial; me, medulla; MB, mushroom body; Och, outer chiasma; Re, retina; V, ventral.
OLs (Fig. 7E). Essentially the same expression profiles were detected with nurse bee brain sections (Fig. S8).
We then analyzedAmMESK2-expression byin situhybridization using an ‘exon probe’ designed to correspond to most of the putative exon regions, including those coding the Ndr domain, based on the supposition that stronger expression can be detected with the ‘exon probe’. The results revealed that, although weak signals were detected in most brain cortex, stronger signals were detected in the same ventral regions between the lamina and medulla in the OLs in forager (Fig. 8), nurse bee (Fig. S9), and queen brains (Fig. S10). Stronger signals were detected with the ‘exon probe’ than with the ‘intron probe’, consistent with the predicted the properties of theAmMESK2gene structure. Similar
AmMESK2-expression pattern was also observed in the brains of drones, which have larger compound eyes and OLs than those of workers or queens (Fig. 9). In the drone brain, while weak signals were detected in most of the brain cortex except the MBs (Fig. 9B), the strongest signals were detected in some dozens of cells in the ventral part of the cortex between the lamina and medulla (Fig. 9E). No significant signals were detected in the other brain regions, including the MB (Fig. 9B, F), cells located surrounded by the OL, MB and SOG (Fig. 9B, G), and cells around the antennal lobes (Fig. 9B, H). These signals were not detected in sections hybridized with a sense probe (Fig. 9C), indicating that the signals represented AmMESK2-expression. Weaker signals were also detected in the dorsal part of the OLs, suggesting thatAmMESK2
is expressed preferentially, but not specifically, in the ventral region between the lamina and medulla of the OLs in the drone brain. Therefore, althoughAmMESK2is weakly expressed in most of the brain cortex, it is expressed preferentially in restricted neural cell types, suggesting the importance of this gene product in these cells (Fig. 9B, C).
AmMESK2was expressed differentially between the ventral and dorsal parts of the OLs, therefore we also examined whether
AmMESK2 is expressed differentially between the anterior and proximal parts of the OLs by in situ hybridization with the horizontal drone brain sections. The AmMESK2-expressing cells were located ubiquitously along the anterior-posterior axis and around the outer chasm (Fig. 9I–L). The signals were not detected between the medulla and lobula, confirming thatAmMESK2was expressed preferentially in neurons located between the lamina and medulla in the honeybee brain.
Finally, we performed real-time RT-PCR to compare the amount ofAmfutsch-, Amtau-andAmMESK2transcripts between the brains of nurse bees and foragers, in which the MB structure changes depending on the division of labor of the workers and correlates with the foraging experience of the foragers [28,29]. The amount of Amfutsch- and Amtau-transcripts did not differ significantly between the brains of nurse bees and foragers, whereas the amount ofAmMESK2-transcript was 1.5-fold higher in the forager brain then in the nurse bee brain (Supporting Information S1, Fig. S11).
Discussion
The present study is the first to identify genes whose expression was more enriched in the OLs than in the other regions in the honeybee brain. The findings indicated three genes with neural cell type-preferential gene expression profiles in the OLs. To our knowledge, this is the first identification of genes that are expressed in a monopolar cell- (Amfutsch and Amtau) or ventral medulla-preferential manner (AmMESK2) in insect OLs.
One of these genes was a homologue of a gene for microtubule-associated protein, futsch/map1. Both mammalian MAP1 and
DrosophilaFutsch function to stabilize axon structures by binding to microtubules at axons or axon terminals [45,50]. Although the MAP1 family contains several genes in mammals, in Drosophila, MAP1 function appears to be fulfilled by a single gene,futsch[44]. Similarly, Amfutsch was a single copy gene in the honeybee genome. InDrosophila,Dmfutschencodes the 22C10 antigen, which has been widely used as a neuronal marker [51]. In adult brain, 22C10-immunoreactivity is detected in some central nervous systems, such as chiasmas or antennal nerves, as well as in most peripheral neurons [52], whereas Amfutschwas expressed prefer-entially in the monopolar cells in the lamina of the adult honeybee brain. In addition, doublein situhybridization showed that futsch
and tau, which functionally overlap in mice and flies, are co-expressed in the monopolar cells in the lamina. Similar to the situation forAmfutsch, although the Tau family contains several genes in mammals, tau represents a single copy gene in both
Drosophila and the honeybee. Furthermore, although Dmtau is expressed in photoreceptors inDrosophilaadults and as well as in brain and most peripheral neurons inDrosophilalarvae [46],Amtau
was expressed preferentially in the monopolar cells in the lamina of the adult honeybee brain. These results suggested thatAmfutsch
and Amtau are involved in the monopolar cell-specific cell characteristics or structures. Furthermore, the expression profiles ofDmfutschandDmtauin the adult brain seem distinct from those of Amfutsch and Amtau, suggesting that both futsch- and tau -expression might be differently regulated among these insect species. Considering that monopolar cells may be involved in detection of contrast of visual objects, and project axons into the medulla as well as into the lobula,AmFutsch andAmTau might play important roles in stabilizing axon structures, which is essential for neural functions of monopolar cells.
In situ hybridization of Amfutsch and Amtau using developing pupal brain sections indicated that, although both genes were expressed in the pupal brains, they were differentially expressed in Figure 6. Gene structure of the predicted gene AmMESK2.
Genomic organization of the predicted gene AmMESK2 (A) and comparison of the domain structures ofAmMESK2 andDmMESK2 (B). (A) Exon (closed boxes) and intron (lines) structures of the predicted gene and the location of the Clone #2 and the probe for in situ
hybridization are indicated below the corresponding linkage group (upperline). (B) Closed boxes in AmMESK2 and DmMESK2 isoform I indicate Ndr domains. The number below the Ndr domain ofAmMESk2 indicates sequence identities with that ofDmMESK2.
the pupal brains, suggesting that these genes function in a brain-region dependent manner during pupal stages (Supporting Information S1, Fig. S5 and S6). Considering that expression of bothAmfutschandAmtauis enriched in monopolar cells, it might be
that the axons of monopolar cells are solid or undergo remodeling under certain circumstances, which requires more abundant
AmFutsch and AmTau than the other brain regions. Because essentially the sameAmfutsch- and Amtau-expression profiles were Figure 7.In situhybridization with the intron probe ofAmMESK2in the forager brain.In situhybridization using DIG-labeled RNA antisense (B, D–H) and sense (C)AmMESK2probes with forager brain sections. (A) Schematic representation of signals detected in the left-brain hemisphere of the forager brain. Black circles indicate the stronger signals. (D–H) Magnified views of parts of (B) corresponding to the boxes shown in (A). The signals detected in the cortex between the lamina and medulla are indicated by black arrowheads. Scale bars = 100mm. Asterisks indicate non-specific staining. D, dorsal; L, lateral; la, lamina; lCa, lateral calyx; lo, lobula; M, medial; me, medulla; mCa, medial calyx; Re, retina; SOG, subesophageal ganglion; V, ventral. Note that stronger signals detected in magnified view (E) are scarcely detected in low magnification micrograph (B), and so the signals need to be examined closely with magnified views. This is also the case for Figs. 8, 9, S5, S6 and S7.
detected in all forager, nurse bee, queen, and drone brains, it is likely thatAmfutschandAmtaufunction similarly in monopolar cells irrespective of the sex, caste, or division of labor of workers.
The function ofAmfutschandAmtauin the cells with large somata that are located beneath the MB calyces remains unknown. Based
on the location of these cells, they might be neurosecretory cells. Axonal stabilization might also be required in these cell types. In the honeybee, immunoreactivity for pigment dispersing hormone, which is involved in insect circadian clock, is detected in neurons located at the medial margin of medulla as well as in large neurons Figure 8.In situhybridization with the exon probe ofAmMESK2in the forager brain.In situhybridization using DIG-labeled RNA antisense (B, D–H) and sense (C)AmMESK2probes with forager brain sections. (A) Schematic representation of signals detected in the left-brain hemisphere of the forager brain. Black circles indicate the stronger signals. (D–H) Magnified views of parts of (B) corresponding to the boxes shown in (A). The stronger signals detected between the lamina and medulla are indicated by black arrowheads. Scale bars = 100mm. Asterisks indicate non-specific staining. D, dorsal; L, lateral; la, lamina; lCa, lateral calyx; lo, lobula; M, medial; me, medulla; mCa, medial calyx; Re, retina; SOG, subesophageal ganglion; V, ventral.
Figure 9.In situhybridization with the exon probe ofAmMESK2in the drone brain.In situhybridization using DIG-labeled RNA antisense (vertical sections;B, D–H, horizontal sections;J–M) and sense (vertical sections;C)AmMESK2probes with drone brain sections. (A, I) Schematic representation of signals detected in the vertical (A) and horizontal section (I) of the left-brain hemisphere of drones, respectively. Black circles indicate stronger signals. The dotted line in (A) indicates the position of the horizontal sections for (I–J). (D–H) Magnified views of parts of (B) corresponding to the boxes shown in (A). (K–M) Magnified views of parts of (J) corresponding to the boxes shown in (I). The stronger signals detected in the cortex between the lamina and medulla are indicated by black arrowheads. Scale bars = 100mm. Asterisks indicate non-specific staining. A, anterior; AL, antennal lobe; D, dorsal; L, lateral; la, lamina; lCa, lateral calyx; lo, lobula; M, medial; me, medulla; mCa, medial calyx; Och, outer chiasma; P, posterior; Re, retina; V, ventral.
located beneath the MBs [53]. Although the latter cells resemble to those expressingAmfutschand Amtau, the former cells differ from the monopolar cells, Thus, the relationship between the circadian clock and the Amfutsch- and Amtau-expressing cells is unclear, at present. Finally,Amtauwas not identified in our cDNA microarray screening as a gene whose expression was more enriched in the OLs than in the other brain regions, possibly because our cDNA microarray contained only 5000 cDNA subclones corresponding to the differential display-positive bands, and thus the variety of genes printed on the cDNA microarray was restricted.
The second gene was a homologue ofMESK2.DmMESK2was originally identified while screening for genes that have potentials to modulate RAS-signaling [44]: this gene enhances KSR-signaling, which functions downstream of RAS1, when mis-expressed in the Drosophila retina. Its actual function and expression profile in the adult brain has not been analyzed in
Drosophila. Because there was only a single gene for MESK2 in both honeybee andDrosophila, we concluded thatAmMESK2is a homologue of DmMESK2. The conserved Ndr domain of
AmMESK2 suggests that AmMESK2 has molecular functions similar to those of DmMESK2. Interestingly, AmMESK2 was expressed strongly in only a few dozen cells located in the ventral region between the lamina and medulla in the OLs. Analysis of
AmMESK2 expression revealed that the AmMESK2-expressing cells form a zone at the ventral part that spans from the anterior to the posterior regions of the OLs, close to the outer chiasm. It might be that these cells are important for detecting visual cues, e.g., optic flow, present on the ground rather than in the air. Although the function of neurons expressing AmMESK2 is currently unknown, AmMESK2 may be involved in some kind of neural plasticity by modulating RAS-signaling. These findings indicate that the medulla contains a new subclass of cells characterized by AmMESK2-expression, which has not been identified by previous anatomic or electrophysiologic studies. Neurons in the lamina and medulla form ‘cartridges’ and ‘columns’, each of which comprise several types of neurons [7,20–23]. Thus, it is possible that theAmMESK2-expressing cells comprise a part of the ‘cartridges’ or ‘columns’, and that these ‘cartridges’ or ‘columns’ represent a considerable part of the ventral region between the lamina and medulla in the OLs.
Whether monopolar cell-preferentialAmfutsch/Amtau-expression and ventral medulla-preferential AmMESK2-expression are re-stricted to honeybees, are conserved among a part of social Hymenopteran insects, or are conserved among various Hyme-nopteran insects, requires further investigation. From the view of ‘molecular dissection’ of the honeybee brain,Amfutsch/Amtauand
AmMESK2may be useful tools for detecting axons of the cells that express these genes: these genes aid in visualizing axons of monopolar cells and ventral medulla cells that expressAmMESK2, for example, by immunochemical staining or by using reporter genes in future experiments. Considering that the MB structure changes depending on the division of labor of the workers and correlates with the foraging experience of the foragers [51,52], it is plausible that visual experience affects patterns or densities of axonal projections of OL neurons to the MBs. In fact, the amount ofAmMESK2-transcript was 1.5-fold higher in the forager brains than in the nurse bee brains, raising the possibility that the function ofAmMEKS2 is more necessary in the forager brain than in the nurse bee brain (Supporting Information S1, Fig. S11). Further studies to examine whether projection patterns of the monopolar cells and ventral medulla neurons expressingAmfutsch/
AmtauandAmMESK2depend on the foraging flight of workers can be performed usingAmfutsch/Amtau and AmMESK2 as cell type-preferential markers.
Materials and Methods
Animals
European honeybees (Apis mellifera L.) were purchased from a local dealer and maintained at the University of Tokyo. Foragers with pollen loads were captured at the hive entrance. Nurse bees were collected when they were feeding their brood in honeycombs [26,54]. Drones were collected in the hive. Queens were purchased from the same local dealer.
cDNA Microarray Analysis
A cDNA microarray was performed as described previously [39] with some modifications. We previously prepared a cDNA microarray with over 5000 cDNA subclones representing various genes expressed in the adult honeybee brains: the subclones were cloned from gel portions corresponding to the positive bands in the differential display method used to identify genes expressed in honeybee brain in a brain region- or role-preferential manner [35]. In the present study, we used this cDNA microarray to compare gene expression profiles between the OLs and the other brain regions. Total RNA was extracted from the OLs and the remaining brain regions dissected from the heads of 79 foragers using TRIzol (Invitrogen). Total RNA (500 ng) from the OLs and the remaining brain regions were amplified using an Amino Allyl MessageAmp aRNA Amplification kit (Ambion). Total RNA from the OLs and the other brain regions was divided into 4 groups and two groups were labeled with fluorescent dye Cy5, while the other two groups were labeled with Cy3 (Amersham Bioscience), to prepare two sets of Cy5- or Cy3-labeled RNA from the OLs and two sets of Cy5- or Cy3-labeled RNA from the other brain regions. Hybridization was performed twice using a pair of ‘Cy5-labeled OL RNA and Cy3-labeled the other brain region RNA’, and a pair of ‘Cy3-labeled OL RNA and Cy5-labeled the other brain region RNA’. Data analyses were performed using Genespring software (Silicon Genetics). Hybridization was performed twice by exchanging the dyes, Cy5 or Cy3, that were used to label the RNAs, and this hybridization process was repeated to confirm the results.
We calculated the ratio of the expression level of each clone in the OLs relative to that in the remaining brain regions and looked for clones whose ratios were greater than 1.4-fold. Sequencing the positive clones revealed many redundant clones, and 45 independent clones were identified as candidate genes whose expression was more enriched in the OLs than in the other brain regions. An expression analysis of 19 clones selected arbitrarily from the 45 identified candidate clones performed using in situ
hybridization with a DIG-labeled RNA probe led to the identification of two clones, Clones #1 and #2 (GenBank accession Nos. BP538943 and BP539264), that were strongly expressed in the OLs compared with the other brain regions. Expression of 15 of the remaining 17 candidates was not clearly detected in any brain region by in situ hybridization, possibly because their expression levels were below the detection threshold, whereas the expression of the remaining 2 candidates was detected in both the OLs and other brain regions in the honeybee brain, suggesting that these genes represented ‘false positive clones’.
In Situ Hybridization Analysis
template cDNAs containing the fragment cDNA for Clone #1 (BP538943, which corresponds to+9883 to+10283 ofGB11509/ Amfutsch), Amtau (+2689 to +3103 of hmm14986), Clone #2 (BP539264, which corresponds to+213115 to+212462 of LG6/ putative intron ofAmMESK2), and ‘exon probe’ ofAmMESK2(+44 to+1052 ofGB18470), respectively. After stringent washes, DIG-labeled riboprobes were detected immunocytochemically with alkaline phosphatase-conjugated anti-DIG antibody using a DIG Nucleic Acid Detection Kit (Roche). To examine the monopolar cell-preferential expression or co-expression ofAmfutschwithAmtau
in monopolar cells, theAmfutschriboprobe was labeled with DIG and the Amtau riboprobe was labeled with biotin. DIG-labeled
Amfutsch riboprobes were detected with the HNPP Fluorescent Detection Set (Roche), and biotin-labeledAmtauriboprobes were detected with the TSA plus System (Perkin Elmer). As a negative control, sections were hybridized with sense probes and the antisense probe-specific signals were confirmed in every experi-ment. Micrographs of fluorescentin situhybridization were taken using a fluorescent microscope (Axio Imager Z1, Carl Zeiss). 49 ,6-Diamino-2-phenylindole, dihydrochloride (DAPI, Invitrogen) was used to stain the nuclear DNA [55,56]. Intensity and brightness of the micrographs were processed with Photoshop software (Adobe Systems).
Supporting Information
Supporting Information S1
Found at: doi:10.1371/journal.pone.0009213.s001 (0.06 MB DOC)
Figure S1 In situhybridization ofAmfutschin the forager brains.
In situhybridization using DIG-labeled RNA antisense (B, D–I) and sense (C) Amfutsch probes with forager brain sections. (A) Schematic representation of the signals detected in the left-brain hemisphere of the forager brain. Black circles indicate the stronger signals. (D–I) Magnified views of parts of (B) corresponding to the boxes shown in (A). The stronger signals detected in the lamina (D, E) and in another region (H) are indicated by black arrowheads. White arrowheads indicate regions with no signals (E–I). Black arrows indicated intermediate signals near the SOG (I). Scale bars = 100 Aˆmm. Asterisks indicate non-specific staining. D, dorsal; L, lateral; la, lamina; lCa, lateral calyx; lo, lobula; M, medial; me, medulla; mCa, medial calyx; Re, retina; SOG, subesophageal ganglion; V, ventral.
Found at: doi:10.1371/journal.pone.0009213.s002 (5.45 MB TIF)
Figure S2 In situhybridization ofAmfutschin the queen brains.In situhybridization using DIG-labeled RNA antisense (B, D–I) and sense (C) Amfutsch probes and the queen brain sections. (A) Schematic representation of the signals detected in the left-brain hemisphere of the queen brain. Black circles and black check marks indicate the stronger and intermediate signals, respectively. (D–I) Magnified views of parts of (B) corresponding to the boxes shown in (A). The stronger signals detected in the lamina (D, E) and in another region (H) are indicated by black arrowheads. White arrowheads indicated the regions with no signals (D–I). Black arrows indicate intermediate signals near the MBs (G) and the SOG (I). Scale bars = 100 Aˆmm. Asterisks indicate non-specific staining. D, dorsal; L, lateral; la, lamina; lCa, lateral calyx; lo, lobula; M, medial; me, medulla; mCa, medial calyx; Re, retina; SOG, subesophageal ganglion; V, ventral.
Found at: doi:10.1371/journal.pone.0009213.s003 (5.49 MB TIF)
Figure S3 In situhybridization ofAmfutschin the drone brains.In situhybridization using DIG-labeled RNA antisense (B, D–I) and sense (C)Amfutschprobes with drone brain sections. (A) Schematic
representation of the signals detected in the left-brain hemisphere of the drone brain. Black circles and black check marks indicate the stronger and intermediate signals, respectively. (D–G) Magnified views of parts of (B) corresponding to the boxes shown in (A). The stronger signals detected in the lamina (D, E) and in another region (F) are indicated by black arrowheads. White arrowheads indicate the regions with no signals (D–F). Black arrows indicate intermediate signals in regions near the MBs (F) and SOG (G). Scale bars = 100 Aˆmm. Asterisks indicate
non-specific staining. AL, antennal lobe; D, dorsal; L, lateral; la, lamina; lCa, lateral calyx; lo, lobula; M, medial; me, medulla; mCa, medial calyx; Re, retina; V, ventral.
Found at: doi:10.1371/journal.pone.0009213.s004 (4.55 MB TIF)
Figure S4 In situhybridization ofAmtauin the nurse bee brains.
In situhybridization using DIG-labeled RNA antisense (B, D–I) and sense (C) Amtau probes with nurse bee brain sections. (A) Schematic representation of signals detected in the left-brain hemisphere of the forager brain. Black circles indicate stronger signals. (D–I) Magnified views of parts of (B) corresponding to the boxes shown in (A). (J) Magnified view of the same part as (I) of another section, which includes intermediate signals. The stronger signals detected in the lamina (D, E) and the other region (H) are indicated by black arrowheads. White arrowheads indicate the regions with no signals (E–J). Black arrows indicated intermediate signals near the SOG (J). Scale bars = 100 Aˆmm. Asterisks indicate
non-specific staining. D, dorsal; L, lateral; la, lamina; lCa, lateral calyx; lo, lobula; M, medial; me, medulla; mCa, medial calyx; Re, retina; SOG, subesophageal ganglion; V, ventral.
Found at: doi:10.1371/journal.pone.0009213.s005 (5.54 MB TIF)
Figure S5 Expression analysis of Amfutsch in the developing pupal brain.In situhybridization using DIG-labeled RNAAmfutsch
antisense probes with developing pupal brain sections (Stage P2, P4, and P5). (A) Schematic representation of signals detected in the left hemisphere of the developing pupal brain. Grey regions indicate the part of the brain cortex with stronger signals. (B–D) Results of in situ hybridization using developing pupal brain sections at the P2, P4, and P5 stages [S1], respectively (for staging, also see legend for Fig. S6). Note that relatively strong signals were detected in almost the whole brain cortex, whereas only weak signals were detected in the developing MB regions surrounded by dotted lines [S1, 3, 4]. We could not identify the monopolar cells undergoing differentiation in these developing pupal brain sections. Scale bars = 100 Aˆmm. D: dorsal, L: lateral, M: medial,
MB: mushroom body, OL: optic lobe, V: ventral.
Found at: doi:10.1371/journal.pone.0009213.s006 (3.75 MB TIF)
Figure S6 Expression analysis ofAmtauin the developing pupal brain. In situ hybridization using DIG-labeled RNA antisense
D: dorsal, L: lateral, M: medial, MB: mushroom body, OL: optic lobe, Pe: peduncle, V: ventral.
Found at: doi:10.1371/journal.pone.0009213.s007 (3.75 MB TIF)
Figure S7 Amplification of the cDNA fragment that contained both Clone#2 and the predicted exon region ofAmMESK2. (A) The predicted gene structure ofAmMESK2(GB18470, middle line) is indicated below the Linkage group 6.13 (upperline), where the putative exons ofAmMESK2are indicated with vertical solid boxes. Numbers above the Linkage group indicate nucleotide positions. Positions of Clone #2 and primers used to amplify the cDNA fragment that contained both Clone #2 and the predicted 6th exon region ofAmMESK2are indicated with arrowheads and solid box, respectively. Their structure of the ‘exon probe’ is indicated below theAmMESK2gene structure (lower panel). (B) Agarose gel electrophoresis of the cDNA fragment that contained both Clone
#2 and the putative 6th exon of AmMESK2, amplified by RT-PCR using the honeybee total brain RNA and the primer set described in panel (A). The detected band position (approximately 700 bp), which coincides with the predicted size (678 bp), is indicated by an arrowhead at the left of the panel. The numbers at the right of the panel indicate sizes of the molecular mass makers in bp. Note that a band of the predicted size was detected in the RT+lane, but not in the RT- lane.
Found at: doi:10.1371/journal.pone.0009213.s008 (1.30 MB TIF)
Figure S8 In situ hybridization with the intron probe of
AmMESK2 in the nurse bee brains. In situ hybridization using DIG-labeled RNA antisense (B, D–H) and sense (C) AmMESK2
probes with nurse bee brain sections. (A) Schematic representation of signals detected in the left-brain hemisphere of the nurse bee brain. Black circles indicate stronger signals. (D–H) Magnified views of pars of (B) corresponding to the boxes shown in (A). The signals detected in the cortex between the lamina and medulla are indicated by black arrowheads. Scale bars = 100mm. D, dorsal; L,
lateral; AL, antennal lobe; lCa, lateral calyx; M, medial; me, medulla; mCa, medial calyx; Re, retina; V, ventral.
Found at: doi:10.1371/journal.pone.0009213.s009 (4.23 MB TIF)
Figure S9 In situhybridization with the exon probe ofAmMESK2
in the nurse bee brains. In situ hybridization using DIG-labeled
RNA antisense (B, D–H) and sense (C) AmMESK2 probes with nurse bee brain sections. (A) Schematic representation of signals detected in the left-brain hemisphere of the nurse bee brain. Black circles indicate stronger signals. (D–H) Magnified views of parts of (B) corresponding to the boxes shown in (A). The stronger signals detected between the lamina and medulla are indicated by black arrowheads. Scale bars = 100mm. Asterisks indicate non-specific
staining. AL, antennal lobe; D, dorsal; L, lateral; la, lamina; lCa, lateral calyx; M, medial; me, medulla; mCa, medial calyx; OL, optic lobe; Re, retina; V, ventral.
Found at: doi:10.1371/journal.pone.0009213.s010 (4.52 MB TIF)
Figure S10 In situ hybridization with the exon probe of
AmMESK2in the queen brains.In situ hybridization using DIG-labeled RNA antisense (B, D–H) and sense (C)AmMESK2probes with queen brain sections. (A) Schematic representation of signals detected in the left-brain hemisphere of the queen brain. Black circles indicate stronger signals. (D–H) Magnified views of parts of (B) corresponding to the boxes shown in (A). The stronger signals detected between the lamina and medulla are indicated by black arrowheads. Scale bars = 100mm. Asterisks indicate non-specific
staining. AL, antennal lobe; D, dorsal; L, lateral; la, lamina; lCa, lateral calyx; M, medial; me, medulla; mCa, medial calyx; OL, optic lobe; Re, retina; V, ventral.
Found at: doi:10.1371/journal.pone.0009213.s011 (4.14 MB TIF)
Figure S11 Comparison of the amounts ofAmfutsch-,Amtau-, and
AmMESK2-transcripts in the whole brains of queens, nurse bees, and foragers. Real-time RT-PCR was performed to compare the amounts of Amfutsch-, Amtau-, and AmMESK2-transcripts in the whole brains of nurse bees and foragers. N: nurse bee, F: forager. The amount ofAmfutsch-,Amtau-, andAmMESK2-transcripts were normalized with that ofactin defining the average of normalized mRNA levels in the nurse bee as 1. An asterisk indicates a significant difference between nurse bees and foragers (P,0.05; Welch’s t-test).
Found at: doi:10.1371/journal.pone.0009213.s012 (1.90 MB TIF)
Author Contributions
Conceived and designed the experiments: KK SH MMM. Performed the experiments: KK SH MMM TN AW ST. Analyzed the data: KK SH MMM TN ST. Contributed reagents/materials/analysis tools: KK SH MMM TN RKP TF KS AW ST. Wrote the paper: KK HT TK.
References
1. Collett TS, Collett M (2002) Memory use in insect visual navigation. Nat Rev Neurosci 3: 542–552.
2. Harris RA, Graham P, Collett TS (2007) Visual cues for the retrieval of landmark memories by navigating wood ants. Curr Biol 17: 93–102. 3. Winston ML (1987) The biology of the honeybee. Cambridge, MA: Harvard
University Press.
4. von Frisch K (1967) The dance language and orientation of bees. Cambridge, MA: Harvard University Press.
5. Srinivasan MV, Zhang S, Altwein M, Tautz J (2000) Honeybee navigation: nature and calibration of the ‘‘odometer’’. Science 287: 851–853.
6. Esch HE, Zhang S, Srinivasan MV, Tautz J (2001) Honeybee dances communicate distances measured by optic flow. Nature 411: 581–583. 7. Mobbs PG (1985) Brain structure. In: Kerkut G, Gilbert L, eds. Comprehensive
Insect Physiology, Biochemistry and Pharmacology. Oxford, UK: Pergamon Press. pp 299–370.
8. Heisenberg M (1998) What do the mushroom bodies do for the insect brain? an introduction. Learn Mem 5: 1–10.
9. Strausfeld NJ (2002) Organization of the honey bee mushroom body: representation of the calyx within the vertical and gamma lobes. J Comp Neurol 450: 4–33.
10. Strausfeld NJ, Hansen L, Li Y, Gomez RS, Ito K (1998) Evolution, discovery, and interpretations of arthropod mushroom bodies. Learn Mem 5: 11–37. 11. Rybak J, Menzel R (1998) Integrative properties of the Pe1 neuron, a unique
mushroom body output neuron. Learn Mem 5: 133–145.
12. Kien J, Menzel R (1977) Chromatic properties of interneurons in the optic lobes of the bee. I. Broad band neurons. J Comp Physiol A Neuroethol Sens Neural Behav Physiol 113: 17–34.
13. Kien J, Menzel R (1977) Chromatic properties of interneurons in the optic lobes of the bee. II. Narrow band and colour opponent neurons J Comp Physiol A Neuroethol Sens Neural Behav Physiol 113: 35–53.
14. Hertel H (1980) Chromatic properties of identified interneurons in the optic lobes of the bee. J Comp Physiol A Neuroethol Sens Neural Behav Physiol 137: 215–231.
15. Hertel H, Maronde U (1987) The physiology and morphology of centrally projecting visual interneurones in the honeybee brain. J Exp Biol 133: 301– 315.
16. Hertel H, Scha¨fer S, Maronde U (1987) The physiology and morphology of visual commissures in the honeybee brain. J Exp Biol 133: 283–300. 17. Souza JM, Hertel H, Menzel R, Ventura DF (1987) Marking and recording of
monopolar cells in the bee lamina. Braz J Med Biol Res 20: 851–855. 18. Souza JM, Hertel H, Ventura DF, Menzel R (1992) Response properties of
stained monopolar cells in the honeybee lamina. J Comp Physiol A Neuroethol Sens Neural Behav Physiol 170: 267–274.
19. Yang EC, Lin HC, Hung YS (2004) Patterns of chromatic information processing in the lobula of the honeybee,Apis melliferaL. J Insect Physiol 50: 913–925.
21. Ribi WA (1976) The first optic ganglion of the bee. II. Topographical relationships of the monopolar cells within and between cartridges. Cell Tissue Res 171: 359–373.
22. Ribi WA (1981) The first optic ganglion of the bee. IV. Synaptic fine structure and connectivity patterns of receptor cell axons and first order interneurones. Cell Tissue Res 215: 443–464.
23. Ribi WA, Scheel M (1981) The second and third optic ganglia of the worker bee: Golgi studies of the neuronal elements in the medulla and lobula. Cell Tissue Res 221: 17–43.
24. Giurfa M, Zhang S, Jenett A, Menzel R, Srinivasan MV (2001) The concepts of ‘sameness’ and ‘difference’ in an insect. Nature 410: 930–933.
25. Kuwabara M (1957) Bildung des bedingten reflexes von Pavlovs Typus bei der Honigbiene,Apis mellifica. J Fac Sci Hokkaido Univ Zool 13: 458–464. 26. Hori S, Takeuchi H, Arikawa K, Kinoshita M, Ichikawa N, et al. (2006)
Associative visual learning, color discrimination, and chromatic adaptation in the harnessed honeybeeApis melliferaL. J Comp Physiol A Neuroethol Sens Neural Behav Physiol 192: 691–700.
27. Hori S, Takeuchi H, Kubo T (2007) Associative learning and discrimination of motion cues in the harnessed honeybee Apis mellifera L. J Comp Physiol A Neuroethol Sens Neural Behav Physiol 193: 825–833.
28. Withers GS, Fahrbach SE, Robinson GE (1993) Selective neuroanatomical plasticity and division of labour in the honeybee. Nature 364: 238–240. 29. Farris SM, Robinson GE, Fahrbach SE (2001) Experience- and age-related
outgrowth of intrinsic neurons in the mushroom bodies of the adult worker honeybee. J Neurosci 21: 6395–6404.
30. Gronenberg W (1986) Physiological and anatomical properties of optical input-fibres to the mushroom body in the bee brain. J Insect Physiol 32: 695–704. 31. Ehmer B, Gronenberg W (2002) Segregation of visual input to the mushroom
bodies in the honeybee (Apis mellifera). J Comp Neurol 451: 362–373. 32. Fahrbach SE (2006) Structure of the mushroom bodies of the insect brain. Annu
Rev Entomol 51: 209–232.
33. Kamikouchi A, Takeuchi H, Sawata M, Natori S, Kubo T (2000) Concentrated expression of Ca2+
/calmodulin-dependent protein kinase II and protein kinase C in the mushroom bodies of the brain of the honeybeeApis melliferaL. J Comp Neurol 417: 501–510.
34. Kamikouchi A, Takeuchi H, Sawata M, Ohashi K, Natori S, et al. (1998) Preferential expression of the gene for a putative inositol 1,4,5-trisphosphate receptor homologue in the mushroom bodies of the brain of the worker honeybeeApis melliferaL. Biochem Biophys Res Commun 242: 181–186. 35. Takeuchi H, Fujiyuki T, Shirai K, Matsuo Y, Kamikouchi A, et al. (2002)
Identification of genes expressed preferentially in the honeybee mushroom bodies by combination of differential display and cDNA microarray. FEBS Lett 513: 230–234.
36. Takeuchi H, Kage E, Sawata M, Kamikouchi A, Ohashi K, et al. (2001) Identification of a novel gene, Mblk-1, that encodes a putative transcription factor expressed preferentially in the large-type Kenyon cells of the honeybee brain. Insect Mol Biol 10: 487–494.
37. Kubo T (2003) Molecular analysis of the honeybee sociality. In: Kikuchi T, Azuma N, Higashi S, eds. Genes, Behaviors and Evolution of Social Insects Hokkaido University Press. pp 3–20.
38. Paul RK, Takeuchi H, Kubo T (2006) Expression of two ecdysteroid-regulated genes,Broad-ComplexandE75, in the brain and ovary of the honeybee (Apis melliferaL.). Zoolog Sci 23: 1085–1092.
39. Yamazaki Y, Shirai K, Paul RK, Fujiyuki T, Wakamoto A, et al. (2006) Differential expression of HR38 in the mushroom bodies of the honeybee brain depends on the caste and division of labor. FEBS Lett 580: 2667–2670. 40. Uno Y, Fujiyuki T, Morioka M, Takeuchi H, Kubo T (2007) Identification of
proteins whose expression is up- or down-regulated in the mushroom bodies in the honeybee brain using proteomics. FEBS Lett 581: 97–101.
41. Schwaerzel M, Monastirioti M, Scholz H, Friggi-Grelin F, Birman S, et al. (2003) Dopamine and octopamine differentiate between aversive and appetitive olfactory memories inDrosophila. J Neurosci 23: 10495–10502.
42. Vosshall LB, Stocker RF (2007) Molecular architecture of smell and taste in Drosophila. Annu Rev Neurosci 30: 505–533.
43. Sen Sarma M, Rodriguez-Zas SL, Hong F, Zhong S, Robinson GE (2009) Transcriptomic profiling of central nervous system regions in three species of honey bee during dance communication behavior. PLoS One 4: e6408. 44. Hummel T, Krukkert K, Roos J, Davis G, Klambt C (2000)DrosophilaFutsch/
22C10 is a MAP1B-like protein required for dendritic and axonal development. Neuron 26: 357–370.
45. Halpain S, Dehmelt L (2006) The MAP1 family of microtubule-associated proteins. Genome Biol 7: 224.
46. Heidary G, Fortini ME (2001) Identification and characterization of the Drosophilatau homolog. Mech Dev 108: 171–178.
47. Dehmelt L, Halpain S (2005) The MAP2/Tau family of microtubule-associated proteins. Genome Biol 6: 204.
48. Wang W, Li Y, Hong A, Wang J, Lin B, et al. (2009) NDRG3 is an androgen regulated and prostate enriched gene that promotes in vitro and in vivo prostate cancer cell growth. Int J Cancer 124: 521–530.
49. Huang AM, Rubin GM (2000) A misexpression screen identifies genes that can modulate RAS1 pathway signaling in Drosophila melanogaster. Genetics 156: 1219–1230.
50. Chang Q, Balice-Gordon RJ (2000) Highwire, rpm-1, and futsch: balancing synaptic growth and stability. Neuron 26: 287–290.
51. Zipursky SL, Venkatesh TR, Teplow DB, Benzer S (1984) Neuronal development in the Drosophila retina: monoclonal antibodies as molecular probes. Cell 36: 15–26.
52. Castella C, Amichot M, Berge JB, Pauron D (2001) DSC1 channels are expressed in both the central and the peripheral nervous system of adult Drosophila melanogaster. Invert Neurosci 4: 85–94.
53. Bloch G, Solomon SM, Robinson GE, Fahrbach SE (2003) Patterns of PERIOD and pigment-dispersing hormone immunoreactivity in the brain of the European honeybee (Apis mellifera): age- and time-related plasticity. J Comp Neurol 464: 264–284.
54. Kubo T, Sasaki M, Nakamura J, Sasagawa H, Ohashi K, et al. (1996) Change in the expression of hypopharyngeal-gland proteins of the worker honeybees (Apis melliferaL.) with age and/or role. J Biochem 119: 291–295.
55. Sawata M, Yoshino D, Takeuchi H, Kamikouchi A, Ohashi K, et al. (2002) Identification and punctate nuclear localization of a novel noncoding RNA, Ks-1, from the honeybee brain. RNA 8: 772–785.