Understanding the influence of roadway configuration on traffic flows through a
conventional traffic-assignment model
Abhijit Paul
School of Planning and Architecture, Vijayawada, India
Article Info Abstract
Keywords: Urban movement Roadway configuration Space syntax
Traffic assignment Capacity-restrained analysis
Space syntax researchers have found that the role of roadway configuration itself is apparent in influencing urban movement. Despite this important finding, conventional traffic-assignment models are not seen to take the configurational measures into account for modeling urban movement networks. The argument is where exactly is the short fall in understanding the influence of roadway configuration on the urban phenomena of trip-making and route choice from the conventional traffic-assignment stance? This paper throws deeper insights into this question and reports the progress in the area of transportation planning research by producing theoretical evidence showing that configurational influence on urban movement gets captured through the capacity-restrained-analysis model—one of the prevalent traffic-assignment models adopted by the transportation planning community. The conclusion reinforces the syntax research finding explaining that topological complexities of urban textures significantly get involved in modeling urban movement networks much of which has not been addressed before in the conventional traffic-assignment models.
Submitted 20 Dec 2014; received in revised form 6 Jan 2015; accepted 9 Jan 2015.
Licensed under Creative Commons CC-BY 3.0 BR.
+ Corresponding author. School of Planning and Architecture, Vijayawada. Sy. No. 71/1, NH-5, Nidamanuru, Vijayawada – 521104, Dist. Krishna, A.P., India. E-mail address: [email protected].
Introduction
In the study of cities, space syntax researchers have found that topological complexities of urban textures have a strong effect on the phenomenon of how people navigate urban grids (Hillier & Iida 2005, Penn et al. 1998, Figueiredo & Amorim 2007). Despite this important finding, much of the topological analysis of urban grids or roadway configurations has been kept aside while developing conventional traffic-assignment models. The goal of this paper is to comprehend how roadway configuration itself influences the urban phenomena of trip-making and route choice from the conventional traffic-assignment stance.
)n Network effects and psychological effects: a theory of urban movement, (illier and )ida , have pointed out
that with the kinds of exceptions noted in Hillier et al. (1987), Hillier et al. (1993), Chang & Penn (1998) and Penn et al.
, the configuration of the urban street network is in itself a major determinant of movement flows. Several space
syntax studies in the past have also shown positive correlations between configurational measures of urban textures and both pedestrian and vehicular movements.
The syntax analysis of an urban street network is primarily driven by the natural phenomenon of street accessibility (Hillier & Hanson 1984, Hillier et al. 1993, Haggett & Chorley 1969). The higher the accessibility a street gains, the greater the potential the street bears in receiving movements. Nonetheless, this configurational understanding of modeling movement networks still remains segregated from the conventional travel demand modeling techniques adopted by the
transportation planning community Turner , . )n the words of Penn , : This is no criticism of traffic
modeling. Where science uses data to test hypotheses that are assumed to be false, and thus to increase our understanding, modeling uses data to calibrate models based on theories that are assumed to be correct. The aims of syntax are exactly to understand and explain certain aspects of human behavior and their relation to the environments that people build. Traffic modeling has never had that aim and has been explicitly developed as an approach to modeling the effects of policy change and design intervention in a world in which a good explanatory theoretical framework is lacking but in which we must
continue to intervene.
How a conventional traffic-assignment model itself can otherwise be used to strengthen the argument of configurational understanding of modeling movement networks is the intervention that this paper discusses. The discussion starts by reviewing the basics of conventional traffic-assignment models. It then takes the capacity-restrained-analysis model—one of the prevalent conventional traffic-assignment models in the transportation planning community—in order to develop a case example for the purpose of explaining how and to what extent an urban texture or roadway configuration itself becomes responsible for traffic assignment. The findings bring out the evidence showing that traffic flows of alternative routes between an origin and a destination change considerably under specific conditions when the configuration describing the connections between the origin and the destination changes.
1. Basics of traffic-assignment models
Conventional traffic-assignment models are typically used to determine traffic flows of settlement roads by analyzing the trip-makers general understanding of route choice between trip-origins and trip-destinations. These origins and destinations are known as traffic analysis zones. Then by using generation information (production and trip-attraction) of these zones, how many trips will move from a specific origin to a specific destination is determined. These trips are commonly known as origin-destination trips or OD trips.
As appeared in Fricker & Whitford (2004, 207), before 1920, the Gravity Model was used for the purpose of determining OD trip distributions by using trip-generation information and origin-destination travel distance. Later, Pallin modified the Gravity Model by introducing the notion of travel time in the place of travel distance. However, in practice, surveyed OD trip data are found to be useful for determining reasonably accurate trip-distribution results. These OD trips are further distinguished by different modes of transportation, such as privately-operated vehicles, busses, rail transit, etc. Finally, travel times of origin-destination routes are calibrated to determine which route will carry how many trips while using a specified mode of transportation.
2. Capacity-restrained-analysis model
One of the conventional models of traffic assignment, perhaps the most popular in the transportation planning community, is the capacity-restrained-analysis model. Its algorithm describing the operational travel times of origin-destination trips is comprised by two distinct components: (1) static component and (2) dynamic component. According to the model, when two or more routes become available between a specific origin and a specific destination, the static component of the model determines which particular route will take how much of time to transfer the trips by comparing the free-flow travel times of all available routes. The free-flow travel time of a route is the ratio of the route's metric length and free-flow travel speed; while, the free-flow speed of the route (according to Highway Capacity Manual 2000, 5-6) is the theoretical speed of traffic when the trip-density is considered nil (that is, when no vehicles—that might cause flow congestion—are present in the route). On the other hand, the dynamic component of the model captures the trip delay caused by flow congestion. The flow congestion of a route is determined by the route's operational flow volume to capacity ratio (V/C) reflecting the route s performance, which is also described through the notion of level of service or LOS.
The LOS of a route is a qualitative measure of flow congestion, and it is understood through six distinct conditions starting from LOS A through LOS F. LOS A is considered an excellent travel condition, under which vehicles travel nearly with free-flow speeds (V/C ranges from 0.00 to 0.60). However, the level of service of a route reduces as its operational flow speed decreases due to flow congestion. LOS C is considered the practical capacity condition, under which maneuvering is observed to be restricted. LOS E is the extreme or full capacity condition, under which flow volume is considered close to the route capacity (V/C ranges from 0.91 to 1.00). LOS F is considered the failure condition, under which the flow volume exceeds the capacity of a route.
The congestion delay of a route is the proportional delay of its free-flow travel time due to congestion (Fricker & Whitford 2004). However, in reality, the total travel time of a route increases slowly at low congestion and abruptly when the route's flow approaches the capacity (Fricker & Whitford 2004). That is, congestion delay can be considered a non-linear function of flow congestion. Now, by comprising both, the free-flow travel time and the congestion delay, the operational travel time of the route can be determined (see equation 1).
(1)
where:
t = operational travel time
t0 = free-flow travel time
V = traffic volume
C = route capacity
As pointed out before, flow congestion is considered a dynamic parameter of the link performance function of a route
simply because it varies with the route s operational flow conditions. This implies that, in reality, even if a route is designed
to maintain a desired condition (say LOS C), the route may not be found to operate under same condition always. Furthermore, when the level of service of a route reduces, the alternative routes start becoming attractive, and then the question of route choice becomes prominent. In this scenario, however, an equilibrium is established with the total flow volumes that get distributed in all possible routes. This equilibrium is known as user equilibrium (Fricker & Whitford 2004, 232). Under user equilibrium, changing trip-route does not change travel time.
3. Case example
Figure 1 - Routes A, B, and C
Further, let us understand how trips get distributed in these three routes under a specified condition of flow distribution. Suppose the total flow distribution from the origin to the destination is 3,800 veh./hr. (data obtained from Fricker & Whitford 2004). Now, because route A has the maximum free-flow travel time amongst all three routes (8.8 minutes), route A will only be used by the additional trip-makers of route B and route C when the operational travel times of the latter routes will exceed 8.8 minutes. These additional trips can be determined by adding the flow volumes of route B and route C at t = 8.8 minutes (that is, when tA = tB = 8.8 minutes).
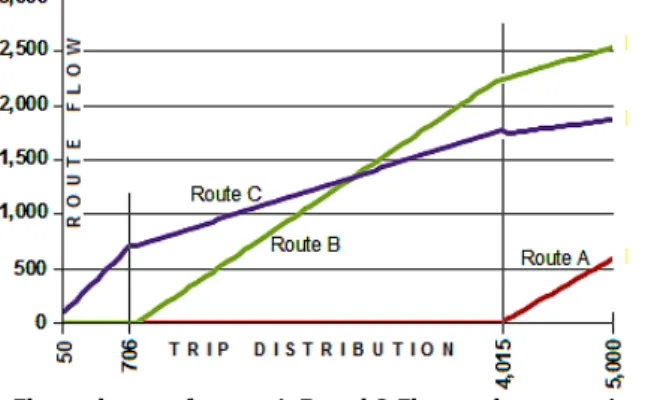
The flow volumes of route B and route C (that is, VB and VC in the link performance functions) are found 2,250 and 1,765 veh./hr. And by adding up these two, it can also be found that route B and route C together are capable of maintaining a cumulative flow distribution of 4,015 veh./hr. by themselves. Now, because this flow distribution is higher than what has been presumed (that is, 3,800 veh./hr.), all trips will be consumed by route B and route C by themselves before their individual operational travel times even reach 8.8 minutes. As a result, neither route A will received trips nor will route A be considered to establish the equilibrium.
Similarly, within the set of route B and route C, the former can be found to have a higher free-flow travel time (7.0 minutes) than the latter. And for this reason, route B will only be used by the additional trip-makers of route C when the operational travel time of route C will reach 7.0 minutes. Under this condition (that is, when tC = 7.0 minutes), the maximum flow volume of route C can be found 706 veh./hr. Now, because this flow volume is much lesser than the total flow distribution, route B will become competitive very quickly (refer to Figure 2), and eventually an equilibrium will be established. This means that, under the equilibrium (that is, when tB = tC), route B and route C will carry the total flow distribution (VB + VC = 3,800 veh./hr.). Now, by equating these two conditions, the flow volumes of route B and route C can be determined 2,104 and 1,696 veh./hr., respectively, and the equilibrium can be found established at 8.68 minutes.
4. Analysis and findings
While determining the travel demands of route B and route C in the previous section, it has been found that they together can maintain an utmost flow volume of 4,015 veh./hr. by themselves even before their individual operational travel times reach the free-flow travel time of route A. Now, because the total flow volume has been considered lesser than 4,015 veh./hr., it is apparent that route A will turn out to be redundant (Figure 2).
Figure 2 - Flow volumes of routes A, B, and C. Flows volumes are in veh./hr.
Notably, for a fixed number of flow distribution (that is, 3,800 veh./hr. in the case example), all routes are seen to compete with one another based on their free-flow travel times. This is because an alternative route only becomes competent when its own free-flow travel time becomes equal to the operational travel time of the one that originally has a low free-flow travel time. In Figure 1, the free-flow travel time of route B is considered higher than that of route C, and for this reason, route B becomes competent when the operational travel time of route C becomes equal to the free-flow travel time of route B (that is, 7.0 minutes). This, as appeared in Paul (2011, 267), also supports a critical argument of flow distribution, which says: … theoretically, congestion is the result of trip-makers route choice. Penn et al. , also
identified that the knowledge of congestion of the route options ahead of the driver is assumed so that drivers make a
rational choice of route . Therefore, the relationship between congestion and route choice appears to be somewhat
interdependent, and quantification of traffic congestion through the link performance functions of OD routes is only an empirical representation of specific real traffic conditions that, theoretically, seems to be a probabilistic approach to traffic
forecasting.
the layout shown in Figure 1 is reconfigured in three ways by blocking each route individually (refer to Figure 3). Table 1 reports the flow volumes of the individual routes described in each of the three modified cases.
Table 1 - Flow volumes of routes under three specified conditions
Note: Travel demands are in veh./hr.
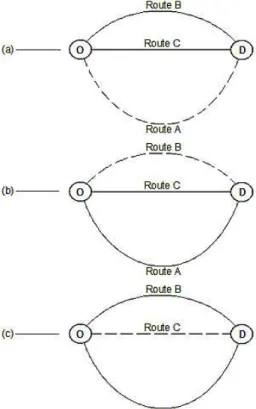
The results of Table 1 implies that the travel demands of the routes change only under certain alterations of the layout, but not always. This is because the travel demands of route B and route C do not change when route A is blocked. On the contrary, the demands of alternative routes change when route B or route C are blocked. While blocking route A [Figure 3(a)], it has been found that the total flow distribution gets consumed by route B and route C together alone before their individual operational travel times even reach the free-flow travel time of route A. As a result, route A is explained to be redundant, and therefore, the blockage of route A practically does not change the travel demands of the other routes in the configuration.
Figure 3 - Layout alteration. (a) Case 1 showing route A is blocked; (b) Case 2 showing route B is blocked; (c) Case 3 showing route C is blocked.
On the contrary, when route B and route C are blocked individually [refer to Figure 3 (b) and (c)], each of the operational travel times under equilibrium is found to be higher than the free-flow travel times of the routes blocked. Consequently, the travel demands of the alternative routes that are left unblocked change. This substantiates the central proposition of this discussion that configuration—along with others, such as trip-distribution, flow congestion, etc.—act as an important parameter in modeling movement networks.
Conclusion
It has been found in several space syntax studies that urban texture or roadway configuration itself plays a key role in influencing urban movement (Hillier & Iida 2005, Penn at al. 1998, Turner 2007, Paul 2012, and so on). Despite this crucial finding, conventional traffic-assignment models are not seen to address configuration as a key parameters (Penn et al. 1998). Instead, these models significantly rely on localized parameters, such as trip-generation and trip-distribution information, distance or time of cost of travel, flow congestion, and so on.
By using the capacity-restrained-analysis model, this discussion has shown that roadway configuration leaves a strong influence on urban movement, and in this context, the parameter of free-flow travel time acts as a primary factor in determining (1) which route is more competent in terms of to be chosen by the trip makers in the first place than the others, and (2) how long the route will remain competent. In the case example, the competency of the route with the lowest free-flow travel time is found to be the highest among all three, and it remains competent until its total travel time becomes equal to the free-flow travel times of the other routes.
It is, therefore, revealing in this discussion that topological complexities of urban textures significantly get involved in modeling movement networks much of which has not been addressed in the conventional traffic-assignment models thus far. This opens up new avenues for further research in the area of transportation planning for the purpose of developing a clear understanding of how configurational measures can be used to determine route competency, and therefore, to make the conventional traffic-assignment models comprehensive.
Case Route A Route B Route C User Equilibrium
1 Blocked 2,104 1,696 tB = tC = 8.68 minutes
2 1,648 Blocked 2,152 tA = tC = 9.46 minutes
Acknowledgements
This paper has been developed from the Ph.D. thesis of the author entitled: An integrated approach to modeling vehicular movement networks: trip assignment and space syntax, which was completed at Texas Tech University in 2009. The author is grateful to many people who supported the thesis with their review comments. In particular, the author is thankful to Saif Haq, Paul Goebel, Perry Carter, Hong Chao Liu, Carlo Ratti, Bill Hillier, Alan Penn, Glenn Hill, Jere Hart, and Darrell Westmoreland.
References
Figueiredo, L. & Amorim, L. (2007). Decoding the urban grid: or why cities are neither trees nor perfect grids. Proceedings of 6th International Space Syntax Symposium. Istanbul, 6, 1-16.
Fricker, J. & Whitford, R. (2004). Modeling Transportation Demand and Supply. Fundamentals of Transportation Engineering: a multimodal system approach. London: Pearson Education, Inc.
(aggett, P. & Chorley, R. . Network Analysis in Geography. NY: St. Martin s Press.
Hillier, B. & Iida, S. (2005). Network effects and psychological effects: a theory of urban movement. In A.G. Cohn and D.M. Mark (Eds.), COSIT, LNCS 3693 (pp. 475–490). Germany: Springer-Verlag Berlin Heidelberg.
Hillier, B., Penn, A., Hanson, J., Grajewski, T., & Xu, J. (1993). Natural movement: or, configuration and attraction in urban pedestrian movement. Environment and Planning B: Planning and Design, 20(1), 29-66.
Hillier, B., Peponis, J., & Hanson, J. (1987). Syntactic analysis of settlements. Arch. & Comport./Arch. Behav. 3, 217-231. Hillier, B. & Hanson, J. (1984). The Social logic of space. Cambridge: Cambridge University Press.
Paul, A. (2009). An integrated approach to modeling vehicular movement networks: trip assignment and space syntax (doctoral dissertation), Texas Tech University, Lubbock, United States.
Paul, A. (2011). A critical review of the equilibrium approach to vehicular traffic estimation. Traffic Engineering and Control, 52(6A), 265-268.
Paul, A. (2012). Creating Awareness of an Evidence-Based Approach to Urban Design, Journal of Environmental Sciences and Engineering, 54(1), 175-180.
Transportation Research Board. (2000). Highway Capacity Manual. Washington DC: NRC.