*e-mail: [email protected]
Thermogravimetric Analyses and Mineralogical Study of
Polymer Modified Mortar with Silica Fume
Alessandra Etuko Feuzicana de Souza Almeida*, Eduvaldo Paulo Sichieri
School of Engineering of São Carlos, University of São Paulo,
Av. Trabalhador São Carlense, 400, 13566-590 São Carlos - SP, Brazil
Received: March 3, 2006; Revised: June 26, 2006
Mineral and organic additions are often used in mortars to improve their properties. Microstructural investigation concerning the effects of styrene acrylic polymer and silica fume on the mineralogical composition of high-early-strength portland cement pastes after 28 days of hydration are presented in this paper. Thermogravimetry and derivative thermogravimetry were used to study the interaction between polymers and cement, as well as the extent of pozzolanic reaction of the mortars with silica fume. Differential scanning calorimetry and X ray diffraction were used to investigate the cement hydration and the effect of the additions. The results showed that the addition of silica fume and polymer reduces the portlandite formation due to delaying of Portland cement hydration and pozzolanic reaction.
Keywords: silica fume, polymer, thermal analysis, X ray diffraction
1. Introduction
Nowadays polymer modiication of cementitious materials is fre-quently used in speciic situations, where high performance towards durability, adhesion with substrates, or waterprooing properties is required. Pozzolanic materials can partially substitute Portland ce-ment in order to enhance the properties of concrete and mortars such as durability and mechanical properties.
Polymer modiied mortars are known as a popular construction ma-terial because of their excellent performance. The fundamentals about polymer modiication for cement mortar and concrete have been stud-ied for the past 80 years or more. Cement mortar and concrete made by adding polymer-based admixtures are called polymer-modiied mortar (PMM) and polymer-modiied concrete (PMC), respectively1,2.
Polymeric admixture, or cement modiier, is deined as an ad-mixture which consists of a polymeric compound that acts as a main ingredient in modifying or improving properties such as strength, deformation, adhesion, waterprooing and durability of mortars and concretes. Polymer latex is a colloidal dispersion of small polymer particles in water, which is obtained by emulsion polymerization of monomers with emulsiiers3,4.
The literature agrees that the properties of polymer-modiied mortar and concrete depend signiicantly on the polymer content or polymer-cement ratio, that is, the mass ratio of the amount of polymer solids in a polymer-based admixture to the amount of cement in a polymer-modiied mortar or concrete1,2,5.
There are two proposed theories of action for polymer in con-crete6,7. According to the irst theory, there is no interaction between the polymer and cement, therefore during hydration the hydrophilic part of the polymer is oriented towards the water phase whereas the hydrophobic part head towards the air phase. The water is dried out in the setting phase, the polymer particles coalesce and build up a mono-lithic matrix phase with a network structure in which the hydrated cement phase and polymer phase interpenetrate into each other. The second theory is that the polymer interacts with the Portland cement hydration products and forms complexes.
The action of the saturated Ca(OH)2 solution on the surface of the set styrene-acrylate dispersion was studied6,8,9. On the other
hand, the behavior of individual Portland cement components with polymers was found to be different when they are present together in cement. However, the mechanism of the interaction considering all the components of Portland cement acting simultaneously and polymers is not clear yet and discrepancies still exist6.
Silica fume or microsilica is an industrial by-product from an electric arc furnace producing silicon and ferrosilicon alloys. It has been widely used as a concrete and mortar mixture, mainly to improve the mechanical properties and reduce porosity, due to poz-zolanic activity10,11.
Finely ground material such as silica fume can increase the water required for a given degree of workability at low water-cement ratio, thus water reducing admixture (or superplasticizer) is often used to improve the workability of mortars with silica fume10.
Taking this into account, the correct combination of silica fume, superplasticizer and polymeric additions may have the synergistic effects of these three admixtures, resulting in the construction ma-terial performing well in speciic applications, for example, high quality repairing and overlaying materials when applying concrete structures12-14.
In previous work, the authors studied the effects of silica fume and acrylic polymer on mortar properties, speciically to install porcelain tiles14. The mentioned work showed the improvement of adherence strength of mortars using such additions. Therefore, the aim of this work is to investigate the inluence of such admixtures concerning the hydration of Portland cement by means of the mineralogical study of pastes with the same composition used in the work14.
The interaction between additions and cement portland can be investigated by various techniques such as thermal analysis and X ray diffraction. Thermogravimetry (TG), derivative thermogravimetry (DTG) and differential scanning calorimetry (DSC) are considered important tools to evaluate the nature of hydrated products according to different stages of cement hydration, in addition to quantifying the different phases15-18.
portlandite. The hydration can be evaluated by measuring the mass loss of hydrated compounds up to 900 °C. The following peaks and temperature ranges have been studied when hydrated cement is heated in thermobalance16,17.
This study reports the results of investigations in which methods of thermal analysis, TG, DTG and DSC were applied to investigate the effects of polymer modiication on the process of hydration of Portland cement by estimating Ca(OH)2 content and C-S-H content. X ray diffraction was carried out to study the hydrate products of cement19.
2. Materials
2.1. Cement and silica fume
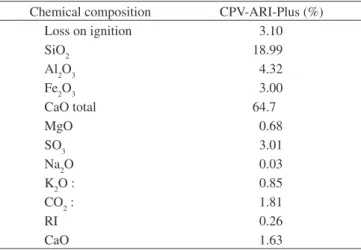
The mortars were prepared using high-early-strength Portland cement (CPV-ARI Plus) according to NBR 5733; and Type III ce-ment according to ASTM C150). Chemical and physical properties of cement are shown in Tables 1 and 2, respectively, according to the manufacturer. The silica fume used was provided by Microssilica Brazil, with a speciic surface area of 27.74 m2/g obtained by the BET test, and 94.3% SiO2 content. Table 3 shows the chemical properties of silica fume, according to the manufacturer.
2.2. Superplasticizer
The superplasticizer, provided by MBT Brazil I. C., was used presenting chemical base sulfonated melamine, liquid aspect, density 1.11 g/cm³ (± 0.02), pH: 8.5 ± 16.49% solids content.
2.3. Polymer latex
• Aqueous dispersion of styrene-acrylate copolymer with 49% to 51% total solid content; Viscosity Brookield (RVT 415 °C): 1000-2000 mPas; Density: 1.02 g/cm3; pH value: 4.5 a 6.5; • Minimum ilm-forming temperature: 20 °C;
• Mean size of particles: 0.1 µm;
• Film properties: Clear and transparent; and • Stability to ageing: good.
3. Experimental Program
Six mixtures were prepared as described in Table 4, which are the pastes with the same proportions used in the previous work14. The materials were weighed and mixed in a planetary-type mortar mixer. The total quantity of water was maintained, taking into account the water from the latex. The superplasticizer was also added in the ratio of 1% of the weight of cement.
The preparation of the samples for TG, DSC and X ray diffrac-tion was carried out using an agate mortar and pestle, in which the paste was manually ground until the size of particles was lower than 0.063 mm. To prevent carbonation and maintenance of relative humidity, all specimens were stored in the vacuum up to the time of when the test started.
The analyses were performed at the Institute of Chemistry of São Carlos, University of São Paulo, using TGA 2050 Thermogravimetric Analyzer V5.1A equipment. The experimental conditions were: N2 gas dynamic atmosphere (40 ml.min-1); heating rate (10 °C.min-1) and a platinum top-opened crucible. The samples were heated in the range of 20 to 900 °C at a constant rate. The Ca(OH)2 was estimated from the weight loss measured in the TG curve between the initial and inal temperature of the corresponding DTG peak.
Differential scanning calorimetry (DSC) was used to investigate the combined effect of silica fume and polymer on heat development in the pastes. A DSC 2010 Differential Scanning Calorimeter was
Table 3. The chemical compositions of silica fume.
Chemical composition %
SiO2 94.3
Al2O3 0.09
Fe2O3 0.10
CaO 0.30
MgO 0.43
SO3
-K2O 0.83
Na2O 0.27
Table 1. The chemical composition of cement.
Chemical composition CPV-ARI-Plus (%)
Loss on ignition 3.10
SiO2 18.99
Al2O3 4.32
Fe2O3 3.00
CaO total 64.7
MgO 0.68
SO3 3.01
Na2O 0.03
K2O : 0.85
CO2 : 1.81
RI 0.26
CaO 1.63
Table 2. Physical properties of cement. Setting time
(min)
Blaine surface
Compressive strength (MPa) NBR 7215
Initial Final area m2/kg 1 day 3 days 7 days 28 days
150.78 226.25 467.9 27.87 43.57 48.69 56.16
used. The experimental conditions were: N2 gas dynamic atmosphere (40 ml.min-1); heating rate (10 °C.min-1) and platinum top-opened crucible. The samples were heated in the range of 25 °C to 500 °C at a constant rate.
XRD was used to identify the polycrystalline phases of cement and hardened cement paste. The qualitative XRD investigation was performed in a Carl Zeiss-Jena Universal Diffractometer, URD6 model at the Institute of Chemistry of São Carlos, University of São Paulo.
4. Results and Discussion
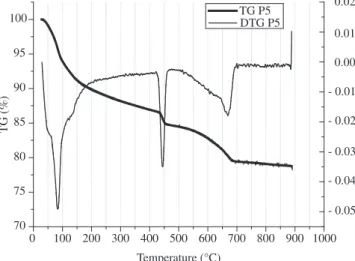
Table 4 shows the mixture proportions investigated. Figures 1 and 2 show the TG curves of pastes with silica fume content of 5% and 10% respectively (P5 and P6). It can be seen that TG curves for these pastes consist of four zones:
• ~ 25-123.3 °C: dehydration of pore water;
• ~ 123.3-420 °C: dehydration of calcium silicate hydrates; • ~ 420-480 °C: dehydroxylation of calcium hydroxide; and • ~ 480-730 °C: decarbonation of CaCO3.
Table 4. Mixture proportion of the mortars.
Designation of paste Silica fume content (%)*
Polymer Latex content (%)*
Solids of polymer content (%)*
Water/cement ratio
P1 5 10 5.2 0.36
P2 5 20 10.4 0.31
P3 10 10 5.2 0.36
P4 10 20 10.4 0.31
P5 5 0 0 0.36
P6 10 0 0 0.36
*by weight of cement.
0 100 200 300 400 500 600 700 800 900 1000 70
75 80 85 90 95 100
TG (%)
Temperature (°C)
- 0.05 - 0.04 - 0.03 - 0.02 - 0.01 0.00 0.01 0.02 TG P5
DTG P5
Figure 1. TG curve of the paste without polymer and 5% of silica fume P5.
0 100 200 300 400 500 600 700 800 900 1000 70
75 80 85 90 95 100
TG (%)
Temperature (°C)
- 0.14 - 0.12 - 0.10 - 0.08 - 0.06 - 0.04 - 0.02 0.00 0.02 TG P6
DTG P6
Figure 2. TG curve of the paste without polymer and 10% of silica fume P6.
silica fume and polymer addition of 5.2% and 10.4% (polymeric solids), respectively. The TG curves obtained in these tests are typical of hydrated cement pastes containing carbonate phases and polymeric admixtures. The curves can be divided into ive major parts, according to different reactions:
• ~ 25-123.3 °C: dehydration of pore water;
• ~ 123.3-345 °C: dehydration of calcium silicate hydrates; • ~ 345-427 °C: weight loss due to polymer pyrolysis and
dehy-dration of part of silicate hydrates;
0 100 200 300 400 500 600 700 800 900 1000 75
80 85 90 95 100
TG (%)
Temperature (°C)
- 0.12 - 0.10 - 0.08 - 0.06 - 0.04 - 0.02 0.00 0.02 TG P1
DTG P1
Figure 3. TG curve of the paste P1.
0 100 200 300 400 500 600 700 800 900 1000 70
75 80 85 90 95 100
TG (%)
Temperature (°C)
- 0.12 - 0.10 - 0.08 - 0.06 - 0.04 - 0.02 0.00 0.02 TG P2
DTG P2
Figure 4. TG curve of the paste P2.
• ~ 427-475 °C: dehydroxylation of calcium hydroxide; and • ~ 475-711 °C: decarbonation of CaCO3.
The weight loss for each temperature range can be seen in Table 5. Regarding pastes with polymer addition, the weight loss related to the dehydroxylation of calcium hydroxide is lower than pastes with silica fume addition alone.
Table 5. Weight loss of the pastes according to the temperature. Temperature range (°C) Weight loss (%)
P5 28.3 a 123.3 7.487
123.3 a 416.2 5.75
416.7 a 472.1 2.056
472.1 a 702.3 5.258
Residue above 850 °C 78.9
P6 25.2 a 123.3 8.43
123.3 a 420.6 5.238
420.6 a 478.8 1.876
478.8 a 729.2 8.436
Residue above 850 °C 75.23
P1 25.9 a 123.3 5.922
123.3 a 337.9 5.037
337.9 a 429.6 2.665
429.6 a 481 2.095
481 a 711.3 7.412
Residue above 850 °C 75.04
P2 26.1 a 123.3 5.236
123.3 a 333.4 4.767
333.4 a 422.9 5.175
422.9 a 478.8 2.301
478.8 a 713.5 7.357
Residue above 850 °C 74.12
P3 25.2 a 123.3 5.695
123.3 a 344.6 4.949
344.6 a 427.3 2.53
427.3 a 474.3 1.912
474.3 a 711.3 6.308
Residue above 850 °C 77.89
P4 24.6 a 123.3 6.544
123.3 a 344.6 5.175
344.6 a 429.6 4.663
429.6 a 476.5 1.707
476.5 a 713.5 6.289
Residue above 850 °C 74.88
0 100 200 300 400 500 600 700 800 900 1000 70
75 80 85 90 95 100
TG (%)
Temperature (°C)
- 0.12 - 0.10 - 0.08 - 0.06 - 0.04 - 0.02 0.00 0.02 TG P3
DTG P3
Figure 5. TG curve of the paste P3.
0 100 200 300 400 500 600 700 800 900 1000 70
75 80 85 90 95 100
TG (%)
Temperature (°C)
- 0.04 - 0.03 - 0.02 - 0.01 0.00 0.01 TG P4
DTG P4
Figure 6. TG curve of the paste P4.
show an endothermic peak around 480 °C, but they are more intense for pastes with silica fume alone because of the higher Ca(OH)2 content. Pastes with silica fume and polymer present an exothermic peak around 350 °C, indicating polymer pyrolysis, as was found from the TG/DTG analyses. The pastes modiied with polymer presented higher heat absorption between 100 °C and 200 °C, suggesting that these pastes contain more free water resulting from the hydration being delayed, and that these have a higher amount of calcium silicate hydrates.
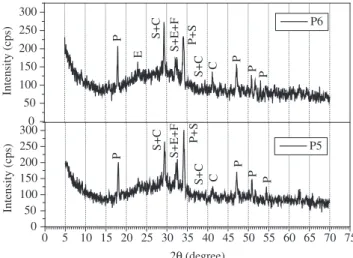
The XRD results show some qualitative differences in the hydra-tion rate due to the incorporahydra-tion of silica and polymer. Figures 8, 9 and 10 show the X ray patterns of the pastes with 5%, 10% of silica fume, and pastes with polymer. The main compounds observed are Ca(OH)2 in the form of portlandite, a small amount of CaCO3 result-ing from carbonation of Ca(OH)2 which occurred during hydration and anhydrous calcium silicate. The peak intensity in the region of 2θ= 18° has been considered as a measurement of the intensity of Ca(OH)2 for the comparison between the samples19. Therefore, - 50 0 50 100 150 200 250 300 350 400 450 500 550
- 1.3 - 1.2 - 1.1 - 1.0 - 0.9 - 0.8 - 0.7 - 0.6 - 0.5 - 0.4 - 0.3 - 0.2 - 0.1 0.0 0.1
Heat flux (mW/mg)
Temperature (°C)
P1 P4 P5 P6
0 5 10 15 20 25 30 35 40 45 50 55 60 65 70 75 0 50 100 150 200 250 300 P P P C S+C P+S S+E+F S+C P P P3 Intensity (cps)
2Q (degree) 50 100 150 200 250 300 350 P P P P C S+C P+S S+E+F S+C P Intensity (cps) P4
Figure 9. XRD patterns of the P3 and P4 pastes after 28 days of hydration.
P. portlandite (Ca(OH)2); CC. Calcium carbonate (CaCO3); E. ettringite
(Ca6[Al(OH)6]2(SO4)3.26H2O); S. silicates; F. ferrite.
Figure 8. XRD patterns of the P1 and P2 pastes after 28 days of hydration.
P. portlandite (Ca(OH)2); CC. Calcium carbonate (CaCO3); E. ettringite
(Ca6[Al(OH)6]2(SO4)3.26H2O); S. silicates; F. ferrite.
0 5 10 15 20 25 30 35 40 45 50 55 60 65 70 75 0 50 100 150 200 250 300
CP P P
P C S+C P+S S+E+F S+C P P P1 Intensity (cps)
2Q (degrees) 0 50 100 150 200 250 300
C P P P
P C S+C S+E+F P+S P S+C P Intensity (cps) P2
0 5 10 15 20 25 30 35 40 45 50 55 60 65 70 75 0 50 100 150 200 250 300 P P+S S+E+F S+C
S+C C P
P
P P5
Intensity (cps)
2Q (degree) 0 50 100 150 200 250 300 P E P P C S+C P+S S+E+F S+C P Intensity (cps) P6
Figure 10. XRD patterns of the P5 and P6 pastes after 28 days of hydration.
P. portlandite (Ca(OH)2); CC. Calcium carbonate (CaCO3); E. ettringite
(Ca6[Al(OH)6]2(SO4)3.26H2O); S. silicates; F. ferrite.
Figures 8, 9 and 10 show that 10% of silica fume replacement and polymer addition resulted in the lowest peak intensity for the port-landite (Ca(OH)2).
5. Conclusions
The qualitative XRD investigation revealed that a lower intensity of Ca(OH)2 (in the region of 2θ = 18°) was obtained in the presence of latex, compared to pastes without polymer. Similarly, we found a decrease in the Ca(OH)2 content in the TG analyses for pastes with polymer addition. As can be seen, pastes with polymer and 10% silica fume content presented the lowest Ca(OH)2 compared to the other pastes. From the thermogravimetric investigations performed, shown in the TG and DSC curves, it can be concluded that mineral admixtures and polymeric additions have inluenced cement hydra-tion, mainly when added simultaneously.
It can be concluded from the data reported in this paper and within the limits of the experimental conditions adopted that the additions studied resulted in the decrease of the portlandite content. Both the pozzolanic reaction, that transforms the weak calcium hydroxide crystals into the strong calcium silicate hydrate gel, and the delay of hydration due to polymer addition appear to cause a decrease in the portlandite content, contributing to the improvement of the mortars´ performance studied earlier by the authors.
Acknowledgments
The authors gratefully acknowledge the financial support from Fundação de Amparo a Pesquisa do Estado de São Paulo (FAPESP).
References
1. Ohama Y. Polymer based admixtures. Cement and Concrete Composites.
1998; 20:189-220.
2. Fowler DW. Polymers in concrete: a vision for the 21st century. Cement
and Concrete Composite. 1999; 21:449-452.
3. Walters DG. What are latexes? Concrete International. 1987;
9(12):44-47.
4. Lavelle JA. Acrylic latex-modiied Portland cement. ACI Materials
Journal. 1998; 85(1):41-48.
5. Ohama Y. Recent progress in concrete-polymer composites. Advanced
Cement Based Materials. 1997; 5:31-40.
6. Chandra S, Flodin P. Interactions of polymers and organic admixtures
on Portland cement hydration. Cement and Concrete Research. 1987;
17:875-890.
7. Ohama Y. Principle of latex modiication and some typical properties
of latex modiied mortar and concretes. American Concrete Institute
- Materials Journal. 1987. p. 511-518.
8. Larbi JA, Bijen JM. Interaction of polymers with Portland cement during hydration: A study of the chemistry of the pore solution of
poly-mer-modiied cement systems. Cement and Concrete Research. 1990;
20:139-147.
9. Janotka I, Mandejova J, Stevula L, Frt´Alova DM. Behavior of Ca(OH)2 in
the presence of the set styrene-acrylate dispersion. Cement and Concrete
Research. 1996; 26(11):1727-1735.
10. Aïtcin Pierre-Claude. Concreto de Alto Desempenho. São Paulo: Ed. Pini;
2000.
11. Male P. Properties of microssilica. Concrete. 1989; 23(8):31-34.
12. Chakraborty AK, Dutta SC, Sen P, Ray I. Improved performance of silica
fume modiied mortar due to addition of polymer emulsions. Journal of
Polymer Materials. 2000; 17(1):53-62.
13. Gao JM, Qian CX, Wang B, Morino K. Experimental study on
proper-ties of polymer-modiied cement mortars with silica fume. Cement and
14. Almeida AEF de S, Sichieri EP. Study of the adherence between
poly-mer-modiied mortars and porcelain stoneware tiles. Materials Research.
2005; 8(3):245-249.
15. Dweck J, Buchler P, Coelho A, Cartledge F. Hydration of a Portland
cement blended with calcium carbonate. Thermochimica Acta. 2000;
346:105-113.
16. Fordham CJ, Smalley IJ. A simple thermogravimetric study of hydrated
cement. Cement and Concrete Research. 1985; 15:141-144.
17. Tisivilis S, Kakali G, Chaniotakis E, Souravidou A. A study on the
hydra-tion of Portland limestone cement by means of TG. Journal of Thermal
Analysis. 1998; 52:863-870.
18. Vedalakshmi R, Raj A, Srinivasan S, Babu K. Quantiication of hydrated cement products of blended cements in low and medium strength concrete
using TG and DTA technique. Thermochimica Acta. 2003; 407:49-60.
19. Afridi MUK, Ohama Y, Iqbal MZ, Demura K. Behavior of Ca(OH)2 in
polymer-modiied mortars. The International Journal of Cement