Photo Interpretation and GIS as a support tool
for Archaeology:
The use of satellite Images for creating
interpretation keys for dolmens
Ariele Câmara University of Évora, Portugal
Teresa Batista University of Évora, Portugal
Abstract—This work presents photo interpretation integration techniques of high resolution aerial pho- tographs and satellite images. Through the use of this methodology, it is possible to identify Dolmens located in the Center Alentejo - Portugal, and recover archae- ological information. From the observation of dolmens it was perceived the shape of these objects visualised in vertical images. The use of Remote Sensing techniques in conjunction with ArcGIS allowed to conftrm and to know the interpretation keys of these monuments. This feature keys allow to identify and recognise sites already identifted as well as new buildings.
Index Terms—Aerial Archaeology , Photo interpre- tation , GIS , Dolmens , Portugal.
I. INTRODUCTION
This the historiography of the photo interpretation goes back to the time of Aristóteles, as it was him that developed the first theories about photography. How- ever, the first aerial images were obtained in 1842, when the Paris Observatory director, Francis Amaro, made the first image acquisition from the air, to assist the topo- graphic surveys at his time [1]. Despite its precursors, the development of the photo interpretation is taken as a recent technique. Its progress was driven mainly over the two World Wars and the Cold War [2]. Photo interpreta- tion is a methodology that is connected to technological development and material evolution to obtain images, being necessary instruments such as cameras and aircrafts. With the new developments occurred in the 20th century this Remote Sensing (RS) technique became more used [2]. Since the 20th century, the use of images has been obtaining more attention, allowing for developments and improvements in landscape understanding. From this, keys of interpretation have been developed, that is, a list of aspects or elements drawn and described that aid the understanding of the objects in a photograph, giving them a meaning and dimension in the terrain through the calculation of heights and areas of occupation.
Nowadays, these images can are used in several areas. In Archeology, the photo interpretation serves as a means of indirect exploration that allows locating monuments of patrimonial interest. These pictures are no longer only present on paper but can be analysed in digital format. Satellite imagery, thanks to its collection speed and the fact that many of these are available online with quality, and with the possibility of being managed together with other systems integrated with a GPS, end up indicating the exact sites location in the orthophoto. This visualisa- tion method allows the realisation of a greater approxima- tion, individualising photographed elements, and
allowing to work with several proximity scales, depending on the photo resolution. These possibilities integrate us into a digital world, which allows the observer archaeologist the chance to discover new locations before heading to the field.
In this way, first, is presented a brief about the photo interpretation and the techniques and use of Geographic Information Systems (GIS) that helped the development of this research. In a second moment, are presented some techniques for visualising dolmens. From this point on we show the standard features of the architecture of these sites and the environmental characteristics of the zone of insertion of these locations.
II. GIS AND AERIALS/SATELLITES IMAGES IN
AERIAL ARCHAEOLOGY
Aerial archaeology allows the viewing of monuments from images, which can be analysed on a computer, through online softwares or in desktop applications. This new methodology allows the researcher the ability to work with the obtained information more quickly.
In the archaeological field, the geography is essential, because it is in the environment that the buildings are constructed. Due this, it is necessary to know the geogra- phy, the geology and the landscape of the studied location. This knowledge is needed to understand the places and possible reasons of the constructions made by the man over time. All information obtained from an area can usually be entered into a database to be in a GIS.
By working with geographic data within ArcGIS, it is possible to deal with all the knowledge simultaneously 1. These systems allow to view the information, analyse and create plans and blueprints, also, observe and insert site spots using location systems, which allows the researcher to perceive areas, understand the landscape, and see the place remotely. These systems are an access point for various data sources, which are data tools or services that allow indirect prospecting through the use of geo-portals. It should be noted that with constant innovations in information technologies and the ongoing environmental concerns, they have led to a growing interest in remote sensing and any technology that allows images and other types of data to be obtained from the Earth’s surface without physical contact with it. This technique also aims to contribute protecting the archaeological heritage [3].
In general, GIS are currently a tool for image obser- vation and analysis, allowing the visualisation, besides facilitating the management and the perception of the present environment [4]. ArcGIS allows to analyse the orthophoto maps available in a
database, allowing the recognition and interpretation of study sites at different scales, as well as providing a detailed analysis of dolmens location.
Geographic information systems have great potential when applied in archaeology. This systems allows archae- ological sites georeferencing, and also to span all the information with several spatial and descriptive variables.
A. Photo Interpretation
Photo interpretation is an empiric task, although there are two forms of analysis: direct photo interpretation, which presents visible objects and correlative photo inter- pretation, with non-visible objects [2].
The objects above the surface have standard features that help to perceive the elements and their properties, and these patterns can be considered their interpretation keys. These keys are valuable when the objects are visible in the image. However, when objects are not usually visible because they are overlapped, the techniques involved in image interpretation are limited.
In a vertical image, it is possible to perceive character- istics that might not be visible when at the ground [5]. An example is the case of the Outeiro do Circo-Beja complex, where, through the visualisation of aerial images, it was discovered the absence of a second wall that encircles the whole village as previously supposed [6].
Another example of the use of this methodology in Portugal is the case of the village of Perdigões 2, which was discovered in 1983 by Francisco Serpa, through the use of IPPAR 3 aerial images. These images also allowed to perceive the changes in this enclosure after its discovery [7]. We can also mention the Lindoso’s case, where Luís Fontes applied this methodology to understand the evolution of the landscape to identify archaeological sites, identifying archaeological sites from different time periods [8]. Aerial images record what exists in an individual space of earth’s surface at the time of its attainment, making no distinction of time or space, recording all that exists on the surface, whence structures of the most different temporal periods.
To understand the current environment, that is, to analyse an image, it is necessary to have a group of images so that, we can visualise the objects within it. The analysis of these images is done with unaided eye, whether they are in physical or digital way. It is worth mentioning that the phases of photo interpretation are defined mainly in 6 stages: detection, recognition, analysis, deduction, classification and idealisation [2]. These characteristics allows to visualise the actions of man on Earth, making it possible to better understand the natural and anthropic structures, since the archaeological layers differ from the natural ones.
It is necessary to analyse the object, to take into account the existing patterns since they represent the outline of what is being observed. It also needs to understand the shape of the terrain, erosive aspects, existing vegetation, presence of hydrography, relief and rock outcrops and human-made structures. However, the perception of the existence of any element in the soil is closely linked to the quality of the image and the capacity of the observer.
B. Google Earth x Bing Maps
Google Earth provides some high-resolution images from DigitalGlobe (Company that owns and operates high-resolution satellites such as WorldView-1, GeoEye-1, WorldView-2 and WorldView-3) [10].
Google allows a geographical and temporal view of the
same place, as well as the interaction with them. There is a few information on the origin of the images provided by Google, other than those obtained by DigitalGlobe. In SZTUTMAN (2014)[4], this came to the conclusion that the origins of some pictures are:
• Medium resolution satellites images: Landsat 7 (spatial resolution of 15 meters) and SPOT 2 and 4 (10 meters resolution);
• High-resolution satellites images: as SPOT 5 (5 and 2.5 meters resolution); The Ikonos (1 meter of spatial resolution) and GeoEye (0.5-meter resolution).
• Aerial Photographs with a resolution of 0.5 meters or less.
• Google also has an initiative that encourages users to donate images to be part of their system database. On the other hand, Bing Maps is a system that was de- veloped by Microsoft, and ArcGIS provides in its database the orthophoto maps from this platform. Bing Maps, like Google, obtains images from several satellites [4].
Both map systems present a photograph mosaic, where the image quality varies according to the photographic availability in each region [4]. This difference causes a deterioration of quality in some areas, while in another, the objects can be better visualised.
The working environment of these systems are desktop applications installed on computers (being both desktop or laptops); The internet is available using a browse and the respective plugin for each of the system; And mobile environments (mobile and tablets) are accessible through the individual application in the desired system (iOS or Android). The Application Programming Interface (APIs) allows to work in conjunction with global positioning systems (GPS), thus locating already georeferenced mon- uments as well as inserting new locations from hitherto undetected areas.
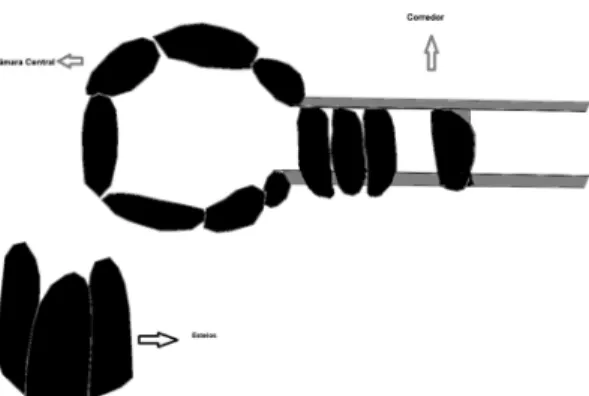
Fig. 1. A schematic plant of a dolmen. With camera and corridor.
III. DOLMENS
Dolmens are small megalithic funerary monuments. These structures were created more than 4,000 years ago. These enclosures were the first constructions of man, being essential for the cultural and social development during the Neolithic. Dolmens are large stone structures, which were inserted side by side composing a geometric ”cham- ber”, mainly circular, semi-circular or quadrangular. The origin of the name dolmen is of Breton provenance, where Dól means table and Men mean stone (stone). These me- galithic monuments are disseminated across the Western Europe, but with a greater incidence in Portugal, Spain, England and Ireland. In Portugal, the Central Alentejo is a pole of high relevance of megalithic monuments [11].
Ariele Câmara et al (p. 116 - 120)
These tombs can be found isolated, being at great distances from other monuments. However, they appear mostly in proximity to other megalithic enclosures, and there may be more than one dolmen on the same hill. These monuments usually consist of a hat-covered cham- ber and a corridor. In the same monument, it may have galleries and a tumulus appearance. In figure 1 one can be seen an illustrative plan of a dolmen with chamber and corridor.
Fig. 2. Mora and Arraiolos with indication of the dolmens visualised
These monuments have reduced dimensions when com- pared with other elements present on the surface, like the trees, houses and high rocky natural complexes. However, it is mainly because of its geometric plant that it is possible to identify them.
A. Dolmens from Mora and Arraiolos
The area covered by this study refers precisely Mora and Arraiolos, two of the 14 municipalities in the Évora district, Portugal. Both areas have a high rate of neolithic heritage. In figure 2, can be seen a representation of these two regions with indicative of the zones that present dolmens [13][14].
This area is predominantly flattened, although it presents a great diversity in geological and landscape, where the relief, when present, is more elongated, with the presence of water line with small slopes, mainly near the streams, as well as small bolls and spurs [15]. So that, the visualisation of the soils may be difficult to access due the pastures and lands addressed to agriculture [16].
Specifically, Mora region is subdivided into four parishes: Mora, Brotas, Cabeção and Pavia. While Arraio- los is a municipality divided into five parishes: Arraiolos; Gafanhoeira (São Pedro) and Sabugueiro; Igrejinha; São Gregório and Santa Justa and Vimieiro. These two lo- calities manifested several archaeological megalithic mon- uments. Being the dolmens one of the more significant peculiarities of this terrain, since they appear in great abundance, as can be observed in image 2.
Among Mora and Arraiolos municipalities, were counted a total of 196 monuments designated as dolmens. These monuments, exert great importance for social and cultural development during the megalithic period, and also in later times. Some of these evolved as new cultures ap- peared, as the example occurred in the 17th century with the Anta Chapel of S. Diniz, which became a Christian temple, present nowadays in the centre of the city of Pavia. The use of these enclosures is not only focused at the time of its construction. In particular cases, typically used and modified as a new society and culture came in contact with them [17] [13].
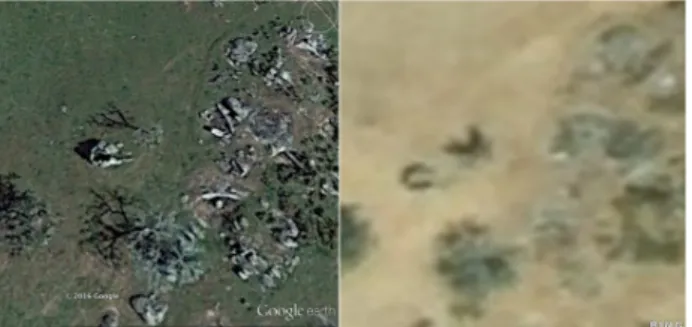
Fig. 3. Pictures of Matalote 1 Dolmen. Both images were taken with 1:20 m resolution. The first image were obtained in Google Earth and the second image in BING.
IV. METHODOLOGY
Archaeological research involves a set methods for dis- covering and mapping archaeological remains. In this con- text, ArcGIS allowed working simultaneously with images and maps. The images were gathered in Google Earth and BING maps. The orthophotos of BING maps were seen into ArcGIS.
In some cases, Bing images (In GIS environment) did not allow an approximation in a scale of 1: 20m without a quality loss. However, Google Earth picture provided an excellent approximation. Some examples can be seen in the figure 3; we can observe two examples of Anta de Matalote 1, where the first one corresponds to a picture from Google Earth, and the second one from Bing both are on the same scale.
For visualisation, is necessary more than one image, since these vary both in quality and in the gathering period. In this way, this integration produced a better perception of the monuments.
Orthophotos seen here refer mostly to rural areas at the Portuguese Alentejo, and the few of the dolmens within urban context, in both systems present a greater quality when compared to rural ones. The images of Google Earth show better quality in low-scale visualisation of the dolmens between Mora and Arraiolos regions.
Were located 196 dolmens between Mora and Arraiolos. These locations were obtained in Archaeological Letters from respective regions worked here (the coordinates pro- vided were in the Lisboa Hayford Gauss Igeoe coordinate system). For the analysis of the surrounding environ- ment was used, topographic cartography (Military Map of Portugal of the Geographical Institute of the Army - Igeoe), geological cartography at scale 1:25,000 and the Land Use and Occupation Map of the Évora District and Sousel Municipality of Intermunicipal Community of Cen- tral Alentejo published under the Otalex (Observatório Territorial e Ambiental Alentejo Extremadura) [18] [20] [13].
Fig. 4. Analysis model.
Ariele Câmara et al (p. 116 - 120)
Within ArcGIS was created an ESRI Geodatabase (GDB) with the geographical indications for the data obtained. The coordinates in the current study were later transformed into a global coordinate model (WGS 84).
The created models allowed to perceive the monuments location and the type of surrounding landscape. On the other hand, for a better understanding of the dolmens architectural structure, a bibliographical analysis was done on these enclosures. As well as the study of photo in- terpretation techniques, aiming at the development of interpretation keys. In the image, is visible a flow chart indicating the process used for the analysis of the pictures referred to in the present study.
V. RESULTS
Of the 196 dolmens already identified and georeferenced, only 74 were visualised in the vertical images (In Tables 1 and 2, we can see the names of the dolmens analysed here). The nonvisualization occurred for a variety of reasons such as presence of tumulus, dense vegetation or trees above the monuments, shades, poor image quality or because the dolmens were entirely or partially destroyed. These six characteristics were the main reasons for non- visualization. However, these features can be overcome by obtaining different images from other sources and at differ- ent time periods, as the landscape may change, depending on the season of the year and, the quality depends on the acquirement model. Regarding the conservation state of the monument, the visualisation can’t be achieved when the monument is much damaged. For the visualisation, the dolmens usually appear in four forms, being these: with the camera and hat in situ or not; with camera without a hat; with incomplete chamber without a hat and with stalks aligned; with incomplete camera without a hat and with markings in the ground [19]. In diagram 1, we can observe the main features for the identification of these monuments in each case.
Fig. 5. Dolmens identified in Mora. In highlight, the dolmens that were visualized in orthophotomaps.
Although a dolmen can present a corridor, tumulus and other galleries, the chamber is the defining element visualised in a vertical image. The Chamber is, therefore, the largest aisle, presenting around 2 to 5m in diameter. The scale is a key factor for spatial unit differentiation and, as regards how the classification process is concerned. There are several methodological
approaches to objects and geological variables that generate different informa- tion according to the nature and objectives in question [18]. The scale tends to be a methodological problem to be overcome, and when we talk about objects with about 2 m in size, as sometimes occurs with dolmens, it is necessary to make an approximation with a scale close to 1: 40m / 1: 20m.
Fig. 6. Dolmens identified in Arraiolos. In highlight, the dolmens that were visualized in orthophotomaps.
The monuments are mainly characterised by the form, that is, by their architecture, and their visualisation de- pends on their conservation state and location, since these monuments needs to be positive (being above the surface). Picture 3 show six examples of dolmens, 3 with a hat: such as Anta de Adua 1, Anta das Cabeças, Anta da Cabeça Gorda 1 and three without a hat: Anta da Vila de Arraiolos, Anta da Santa Cruz 2, Matalote 1.
When a dolmen presents tumulus, it becomes difficult to see in an image. The tumulus is a pile of earth that covers the monument, an example is Anta de Santa Cruz 1 and 3 (located in Brotas), with Anta da Santa Cruz 3 already excavated and studied. This feature tends to protect mon- uments from the action of time and destruction by men or animals. However, if the place is not visible, it can´t be destroyed, but as a consequence, it cannot be known and protected from other destructive problems, such as soil erosion. From ancient times, there was already a trend towards the choice of more durable rocks. Although there is a diversity of the stone materials present in the lithosphere, the granites stand out, as well as rocks of silicate composition and as sedimentary and metamorphic carbonate rocks, such as marble and limestone [21].
In general, dolmens are located in dominant points, although these do not always seem relevant, they are reg- ularly positioned in areas that allow a good visualisation of the surrounding site [22]. These are monuments that hardly appear alone, existing dolmens between distances that vary from 100m to 1k of distance from each other. In the Figure is possible to observe dolmen examples for Pardais 1, 2, 3 and 4 and Entre Aguas 1, 2,
Ariele Câmara et al (p. 116 - 120)
3 and 4 where each of these sites are relatively near. Thus, when a monument is found, the region has to be analysed with more carefully due the possibility of finding another dolmen nearly is considerable.
Fig. 9. Aerial view of the proximity of the Dolmen de Pardais 1,2,3 and 4 and Entre Águas 1,2,3 and 4.
In a simplified way, dolmen visualisation is connected with its conservation state and location, and it is essential to realise its size and shape.
The landscape works as a component that allows or pre- vents the analysis, since the megalithic monuments have been integrated in the nature for thousands of years, being liable to changes in conjunction with the environment itself.
Regarding the monuments state, they are shown in varied forms, so that, the present work uses five classes to identify their structures. The features match with the actual dolmen condition and which parameter allow its visualisation: its shape, structure and dimension. These features allow to classify and distinguish these locations. Diagram 1 shows the created keys for dolmens identifica- tion as well their main visualisation features.
These properties were identified from the dolmens’ blueprints visualisation from vertical images. Within this context, were found 74 dolmens from the 196 analysed. Further, were identified more 31 possible structures that may correspond to dolmens. However, it is necessary a in place confirmation, since it may be false positives.
VI. CONCLUSION
From the analysis of the dolmens inserted in the Mora region, it was perceived that the landscape and the object must be studied together, aiming at an excellent analysis to understand the monument and the environment.
Technological resources for image capture are of great importance for the following phases after gathering the images. These phases are: visualisation, analysis and per- ception of the surface and existing objects. Although an image is not a fundamental concept, the need to perceive and read the current landscape information guarantees relevant importance.
Within the landscape, for an excellent analysis, it is necessary to distinguish natural elements such as hydrog- raphy, relief, vegetation and the presence of rock outcrops, features that end up indicating areas that are more likely to have megalithic monuments. These items can be ob- served in orthophoto maps and recorded within a GIS for a better understanding of the collected information.
REFERENCES
[1] A. Carvalho (2001-2002). A Fotografia Aérea na Arqueologia in Angulo Repositório Didático. Tomar: Instituto politécnica de Tomar, nº1. [2] P. S. Anderson (1982). Fundamentos para
fotointerpretação. Sociedade Brasileira de Cartografia. (s.l). [3] M. G. Tait (2005) ”Implementing geoportals:
applications of distributed GIS.” Computers, Environment and Urban Systems 29.1 p.33-47. [4] P. Sztutman (2014). Análise da qualidade posicional das
bases do Google Maps, Bing Maps e da Esri para referência espacial em projetos em SIG: aplicação para o município de São Paulo. Universidade de São Paulo: Doctoral dissertation. [5] D. R. Wilson (1982). Air photo interpretation
for archaeologists. London: Batsford. [6] M. Serra and E. Porfirio (2013). O povoado do Bronze Final
do Outeiro do Circo (Mombeja/Beringel, Beja): resultados das campanhas de 2008 e 2009. Vipasca, (4), p. 19-32. [7] J. Albergaria, A. F. Carvalho, C. Duarte, A. C. Valera, F. Almeida and
M. Lago (1998). Povoado dos Perdigões (Reguengos de Monsaraz): dados preliminares dos trabalhos arqueológicos realizados em 1997. Revista Portuguesa de Arqueologia, 1(1), p. 45-102. [8] L. F. O. Fontes (2012). Arqueologia, povoamento e construção de
paisagens serranas: o termo de Lindoso, na Serra Amarela. (s.l). [9] A. Jan (1972). Fundamentals of
photointerpretation and pho- togrammetry. (s.I) [10] R. K. L. da Silva (2016). Avaliação das imagens do Google
Earth® de alta resolução espacial em relação às ortofotos para o mapeamento de áreas de preservação permanente (APP). Tra- balho de Conclusão de Curso de Engenharia Florestal, Setor de Ciências Agrárias, Universidade Federal do Paraná. [11] T. Pereira (2012). Megalitismo e Desenvolvimento
Regional. Instituto Politécnico de Tomar. Universidade de Trás-os-Montes e Alto Douro: Doctoral dissertation. [12] M. Diniz (2000). Neolitização e megalitismo: arquitecturas do
tempo no espaço. Muitas Antas, pouca gente. Portugal: p.105- 116. [13] M. Calado, L. Rocha, and P. Alvim (2012). O Tempo
das Pedras. Carta Arqueológica de Mora. Mora. [14] L. Rocha (2015). Espaços de necrópoles das primeras sociedades
camponesas no concelho de Arraiolos: um ponto da situação. Portugal. [15] G. Zbyszewski, O. Da Veiga Ferreira and A. Barros and Car-
valhosa (1979). Carta Geologica de Portugal na escala 1/50 000, Folha 35-B (Mora) e respectiva noticia explicativa. Lisboa: Direccao Geral de Geologia e Minas Servicosos Geologicos de Portugal. [16] L. Rocha and M. Calado (2006). Megalitismo de
Mora: nas fronteiras do Alentejo Central. Portugal. [17] C. Oliveira, L. Rocha and C. Da Silva (2007). O
megalitismo fu- nerário no Alentejo Central–arquitectura e orientações: o estado da questão em Montemor-o-Novo. [18] N. Guiomar, T. Batista, J. P. Fernandes and C. Souto
Cruz (2009) Corine Land Cover Nível 5. Contribuição para a Carta de Uso do Solo em Portugal Continental. AMDE Edt. Évora. 226 pp. ISBN 989-95985. [19] A. Camara and T. Batista (2017). Fotointerpretação e Sistemas de
Informação Geográfica: Contributo para a Identificação de Dólmens em Portugal: O Caso de Mora e Arraiolos. In 12 Confer- ência Ibérica de Sistemas e Tecnologias da Informação (CISTI). Lisboa. [20] T. Batista (2011) Carta de ocupação e uso do solo do Distrito de Évora e
Município de Sousel – Legenda Corine Land Cover Nível 5. CIMAC Edt. Évora. Publicação acoplada ao livro com ISBN 989-95985. [21] A. Dionísio, L. Aires-Barros and M. J. Basto (2004). A
degradação das rochas do património cultural construído: o caso das rochas carbonatadas. 50 ANOS DE SIMULAÇAO. [22] L. Rocha (1999). O megalitismo funerário da
área de Pavia, Mora (Portugal): estado actual da investigaçâo. SAGVNTVM Extra, 2, 421-428. [23] H. Rua (2005). Sintese dos Metodos de Levantamento
Arquite- tonico no Dominio da Arqueologia.
Ariele Câmara et al (p. 116 - 120)