A Work Project, presented as part of the requirements for the Award of a Masters Degree in Finance from the NOVA – School of Business and Economics.
“The Role of Deposit Insurance and Bank’s Asset Size in the 2008 financial crisis”
Hetal Rajesh Kanji, #428
A Project carried out on the MSc Finance, under the supervision of:
Professor Miguel Ferreira
Abstract:
In this paper we analyze the role of deposit insurance in providing the market with liquidity in times of financial turmoil. To do so, we look at the variation in insured and uninsured deposits between 2005Q3 and 2011Q3, controlling for liquidity, solvency and capital adequacy indicators, and find evidence that deposit insurance does provide some confidence in keeping funds in banks in times of turmoil. Additionally we follow an event study methodology to assess the impact of deposit insurance oriented policies on bank holding companies stock market returns, and find a TBTF effect.
"This temporary increase in deposit insurance coverage should go far to help consumers maintain confidence in the banking system and the marketplace; and clearly the public's confidence is key to a healthy and stable economy", Sheila C. Bair, former FDIC
Chairman
I- Introduction
The role of deposit insurance has been a topic of great debate since its inception. Advocates believe that Deposit insurance protects individual financial institutions from the instability in the financial intermediation process, removing the incentives to “run” on banks and hence providing stability to the financial system as a whole.
Deposit insurance was created in response to the bank failures of the Great Depression, when 9,000 banks in the US failed between 1930 and 1933. It was believed that with the introduction of these measurements, the problem of bank runs had been resolved, until the recent financial crisis, where banks saw themselves at the center of the financial turmoil and the FDIC had to intervene in over 400 financial institutions between 2007 and 2011. Banks were exposed to great losses and suffered from the increase in aggregate risk, affecting their ability to diversify shocks across businesses and depositors. Fearing a loss of confidence in the banking system, in the context of Diamond and Dybvig’s bank run scenario definition, as a period of “extreme crisis that have played a prominent role in monetary history”, where depositors withdraw their funds as they expect the bank to fail, which would lead to the “disruption of the monetary system and a reduction in production”, the increase of the deposit insurance limit was included in the policymaker’s agenda.
It is interesting to note how major pieces of financial legislation are enacted in tumultuous periods. One main example was the New Deal policies that reshaped the
American Banking system. Similarly the severity of the current economic crisis has provided the incentives for new, fast and dramatic lawmaking activity. One big example is the Emergency Economic Stabilization Act (EESA), at the beginning of the 2008 financial crisis, and the Dodd-Frank in 2010, which brought about measures for tighter discipline and monitoring of financial institutions. One measure that has been central to both the Great Depression and the EESA, is that of deposit insurance. In spite of always being a measure subject to great debate, evidenced through the initial rejection of the bill both in 1933 and 2008, it was always brought to the discussion again and approved. In 2008 the bill to increase the deposit insurance limit was rejected on September 29th and then approved on October 3rd.
In this project we analyze the role of deposit insurance in providing confidence and liquidity to the banking system. We want to look at how depositors react to changes in a bank’s profitability through an indicator that is more easily observed by depositors, such as net income. More specifically we want to look at the changes in the flows of deposits for commercial banks, differentiating between insured and uninsured deposits, to assess banks’ roles as a safe haven; additionally, we will analyze the impact of deposit insurance oriented policy announcements on bank holding companies’ stock market returns, following an event study method. In our analysis we could evidence a 1,26% increase in flows of deposits between July 2007 and the two weeks after the failure of Lehman Brothers, given the increased perceived riskiness of money market funds and the additional government-backed guarantees for deposits. We also evidence that size matters as smaller banks were subject to greater withdrawals of insured and uninsured deposits between 2008Q3 and 2009Q3.
Our paper is organized as follows: Section II looks at the research that has been done on the effects of deposit insurance and its importance in times of market tightening; Section III explains some of the major pieces of reform regarding deposit insurance; Section IV explains the methodology and the analyses performed on the deposit insurance flows; Section V presents the Event Study Methodology and Analysis, Section VI concludes.
II- Literature Review
Diamond and Dybvig (1983) were instrumental to our understanding of the rationale for banks to exist, by offering deposits that are more liquid than the assets they hold, they are providing liquidity to the market. However, the authors also explain that this arrangement is subject to a bank run, if too many people withdraw their funds early, out of fear of early withdrawals from other depositors, even when the bank is in fact, solvent. Deposit insurance constitutes one of the measures explored in this paper to prevent bank runs, explaining that government-backed deposit insurance works as the Government has taxation authority that can provide a guarantee against large losses. Another reason supporting the existence of deposit insurance is related to moral hazard and adverse selection problems, resulting from the separation of ownership from management and depositors’ inability to monitor banks. Given the lack of appropriate information and incentives for depositors to control and monitor the bank’s activities, these tasks should fall under the regulator’s role, as explained by Dewatripont and Tirole (1984).
A paper by Pennacchi (2006) showed that during times of tight market liquidity deposit insurance has played a major role in the inflow of deposits in the financial crisis. Contrary to the recent financial crisis or the S&L crisis, the author analyses the flows of
deposits between 1920 and 1933 see no increases in bank deposits and observes that liquidity shocks brought along declines in bank loans and investments. This suggests that government guarantees play an important role on the liquidity insurance function that deposit funding provides to banks.
Acharya and Mora (2008) study the role of bank’s dual liquidity provision role, where banks constitute active seekers of deposits as opposed to the role of a passive recipient of deposits. To understand this, the authors look at the flows of deposits for banks, relative to solvency, liquidity and capital measures and evidence that those that have a weaker balance sheet are more exposed to liquidity shocks. The authors conclude that these banks were the ones offering higher rates for deposits.
In the Santos (2012) paper the author explores banks deposit taking activity with credit line provision as a means to save on liquidity costs to meet its consumers and corporations’ requirements, but exposes them to a risk of concurrent runs on both their liabilities and assets. One main idea is that when subject to losses, clients will find it advantageous to draw down on their credit lines. At the same time, as a reaction to bank losses, measured by the bank’s net charge offs, depositors have incentives to withdraw their deposits from banks. These results were analysed for the 1990/91, 2001 and 2007/2008 crisis, and were statistically significant for the 2008 crisis.
In an attempt to understand if deposit insurance affects bank stability, Lambert, Noth and Schuwer (2013) tests if the increase in the deposit insurance limit from $100,000 to $250,000 causes a bank to become more risky. The paper looks at the Emergency Economic Stabilization Act (EESA) and assesses its impact on the increase in deposits, dividing its results between a group of affected banks that saw their deposits increase significantly versus those that did not see a great change. The paper concludes that there
is a change in the composition of their loans after the introduction of EESA, with a greater exposure to Real Estate Loans, Consumer Loans, regarded as risky investments. III- The Emergency Economic Stabilization Act
Deposit inflows did not increase greatly in the first period of the crisis, in spite of the low federal funds rate and 3-month t-bill rates. However, after the Lehman failure deposit flows began to increase sharply, reinforcing banks’ role of save haven. At the time of increased uncertainty by investors as can be evidenced by the VIX ratio below, we expect an increase in the flow of deposits into banks, as can be visualized in the graph below.
Source: Acharya, Viral & Mora, Nada. 2012. “Are Banks Passive Liquidity Backstops? Deposit Rates and Flows During the 2007-2009 Crisis
Congress and the Administration enacted the Emergency Economic Stabilization Act on October 3rd 2008, in an attempt to provide liquidity to the US financial system and increase confidence in markets. One major piece of reform was the increase in the deposit insurance limit from $100,000 to $250,000. The boost in this form of deposit guarantee, led to an increase of deposits, as shown on the graph above. Further on May 20th 2009, the Helping Families Save their Homes Act, extended the deposit insurance limit increase through the end of 2013. Finally, on July 21st, the signing of the
Dodd-Frank Act, made the deposit insurance limit of $250,000 a permanent measure. Given its initial temporary character, the reporting of bank’s insured and uninsured deposits under the new limit only became effective from 2009Q3 onwards. To add, the TARP program was put in place in 2008 in the EESA framework for a number of institutions that qualified to participate in this program that consisted in the purchase of troubled companies’ assets and equity. Alongside other implicit guarantees in the market these measures signaled that the economy would hold up, leading to an inflow of deposits into banks.
IV - Data and Methodology: 1. Data:
To examine deposit flows, we use the quarterly data available on the FDIC’s website including detailed balance sheet and income statement data for all FDIC-insured banks in the United States. We have obtained data from Q3-2005 to Q3-2011, and identify three moments in the recent financial crisis, following Acharya and Mora (2012) – crisis1 as the period between 2007Q3 and 2008Q2, crisis2 between 2008Q3 and 2009Q2 to which we added a third moment crisis3, going from 2009Q3 to 2011Q3. This sub-division throughout the event sample has the objective of better analyzing the changes in the flows of deposits, amongst the different stages of the 2007-2009 crisis. The first part of the crisis was characterized by a freeze in the ABCP market that started around the beginning of August 2007, as documented in Acharya, Schnabl and Suarez (2009) and went on until the Lehman Brothers failure on September 15th 2008. The second part looks at the crisis centered in banks and encompasses measures taken to restore confidence in financial market. Our third sub-period, accounts for the change in the FFIEC 031 and FRY9C reports for the new deposit insurance limit.
Following Lambert, Noth and Schuwer (2013), we can understand that previous studies that have also used FDIC data found that some of the data is erroneous or includes banks that are not “viable”. In this context, we will apply the methodology adopted by Berger and Bowman (2009) and exclude banks that: i) have no commercial real estate or commercial and industry loans; ii) have zero or negative capital; iii) hold assets below $25m and iv) hold consumer loans that are greater than 50% of gross total assets. In order to exclude biases from newly founded banks, we eliminate banks that were created after 2003Q3. In this context we can note that banks such as Goldman Sachs and Morgan Stanley have been excluded from the sample as they only gained the commercial bank status in 2008q3.
Whenever possible we aggregate banks by their top holder identifier, treated as a single banking organization. Our panel set is composed of 5460 banks.
2. Methodology
Uninsured Deposits Runs and Bank Profitability
At times of uncertainty and increased risk, that characterize financial crisis, investors react by moving their investments out of risky assets into safer assets. We would first like to look at the effect of bank profitability on uninsured deposits and then analyze the changes in insured deposits for the same measure and the financial crisis.
In an attempt to evaluate whether bank’s financial performance affects uninsured and insured depositor’s incentives to withdraw the funds they have with the bank we will use the following model:
UinsuredRun= c + αNetIncomet, y-1 + βCrisist + χNetIncomet*Crisist + γBankFixed
Effectst +ηSize + εt,y ,
to the other.
We repeat the same analysis for the share of insured and uninsured deposits scaled by the previous year assets, controlling for a set of bank variables, also scaling them at previous year assets to isolate it from the changes that may have happened to the bank’s assets throughout the year.
To measure bank profitability we use variation in net income from one period to the other, scaled by the total assets from the previous year, in an attempt to come up with a measure of bank loss/profit that is more easily observed by depositors. In this model we also distinguish the crisis periods with a dummy variable for the three periods – Crisis1,
Crisis2 and Crisis3, as defined above. Further we add the interaction of these two
variables, NetIncomet*Crisist, and instigate whether bank losses lead to runs by
uninsured depositors by controlling for a set of bank-specific variables that we will use throughout our analysis.
We have incorporated other variables that may also affect the bank’s ability to meet its liquidity requirements, selecting a set of variables to analyze bank’s liquidity, solvency and capital. Alongside the changes in net income, we also consider the bank’s net charge offs, as an indicator of bank losses, to capture the bank’s role in credit provision. We also consider banks’ sources of funding such as deposits, commercial paper - asset-backed commercial paper, in particular - the repo market and other borrowed funds. We expect banks with higher deposits to meet its liquidity requirements more easily, since insured deposits are not expected to be subject to the same uncertainty as uninsured deposits. Further, banks that fund themselves in the repo market, or the commercial paper market, should also be able to meet their liquidity needs more quickly, as in spite of the greater instability of their funding, they tend to benefit from additional
confidence. We will also look at bank’s interest expense relative to total deposits, as rates offered by banks sensitive to its liquidity and solvency risk, constituting a good indicator of bank’s cost of deposit funding.
In order to proxy liquidity demand, we consider unused commitments, as the higher the amount of commitments a bank has outstanding, the more exposed the bank will be to a drawdown in times of financial distress. However, it can have the opposite side effect as research suggests that more exposed banks are not in fact more fragile, but work as liquidity backstops, seeing an inflow from its credit lines into deposit accounts, in times of market tightening.
We have also accounted for liquidity as the bank’s holdings of cash and marketable securities, such as federal funds sold and securities, given that banks with a greater liquidity buffer are less vulnerable to runs and potential failure. Considering the sudden illiquidity of Mortgage-Backed-Securities and other structured securities, such as Asset-Backed Securities, these variables have been excluded from the Liquidity indicator and will be analyzed separately in the context of the recent financial turmoil. Solvency and capital adequacy measures can be captured by the bank’s capital-to-assets ratio or other measures such as Basel-risk capital (Tier1 and Tier2) and leverage ratios, such as the core capital leverage ratio. Another variable to account for bank risk is the size of the bank’s assets, such as the log of assets. Larger and well-capitalized banks may be better diversified or have access to a broader pool of funding, and therefore we expect this group to experience a smaller draw-downs on their credit lines and losses. Additionally we have defined a variable for Larger Banks and Smaller Banks, where the first includes the largest 25 banks by asset size from the previous period; to look at the opposite effect, we have defined a group for Smaller Banks that accounts for the banks
with an asset size between $25m and $100m, using the $100m cutoff from Acharya and Mora (2012) bank sample exclusion criteria. We would like to see the impact of the changes in flows of deposits for these banks, as the increase in deposit insurance limit was intended to protect these smaller banks that were being subject to deposit withdrawals that fled into larger banks, and “avoid having to close otherwise viable banks because of deposit withdrawals”, but believe that when dealing with market sentiment, the bank’s size will greatly matter.
We complement this set of controls, with a dummy variable for the Bank’s Federal Reserve District, to ensure that the identified differences are bank specific and not attributable to differences across banks. The 12 federal districts work as the operating arms of the nation’s central banking system, accumulating tasks such as holding cash reserves of depository institutions and making loans to them, participating in the setting of the monetary policy, amongst others. We created 11 dummies, for the Boston, New York, Philadelphia, Cleveland, Richmond, Atlanta, Chicago, St. Louis, Minneapolis, Kansas City, Dallas Banks, leaving out San Francisco.
Further, we will repeat our analysis to investigate if the share of uninsured deposits in the bank’s assets at the end of the previous year, declines as a result of bank losses. To evidence the importance of deposit insurance in the stability of deposit funding and its role in the provision of liquidity and confidence in the market, we will repeat our analysis to see how bank losses affected insured deposit flows throughout the recent financial crisis.
Aggregate Evidence from the 2007-2009 financial crisis
One particular characteristic of the financial crisis is that risks were more concentrated in the banking system than in previous financial crisis. The banking system’s
profitability fell as the aggregate return on assets dropped throughout this period. Secondly, commercial banks were greatly affected in this crisis as a result of their holdings of real estate loans and mortgage related securities that saw a sharp decrease in its value, making it difficult to sell these assets, as explained by Brunnemeier (2009). We will account for these variables - Share of Real Estate loans and holdings of Mortgage-Backed Securities (MBS) to see if bank’s with greater exposure to this variable saw a variation in their deposits. We will also consider Asset-Backed Commercial Paper (ABCP), as a proxy for commercial paper as in July 2007 it accounted for over 50% of the $2.2 trillion market. We believe that in times of market tightening investors will withdraw their funds from these markets and into the banking system. We will include a respective interaction variable for the different crisis periods defined in our analysis.
3. Uninsured Deposits
In this section we will examine the impact of bank losses and depositor’s reaction to changes in bank’s profitability. We will focus firstly on uninsured deposits and then assess the importance of deposit insurance in providing some stability in times of uncertainty.
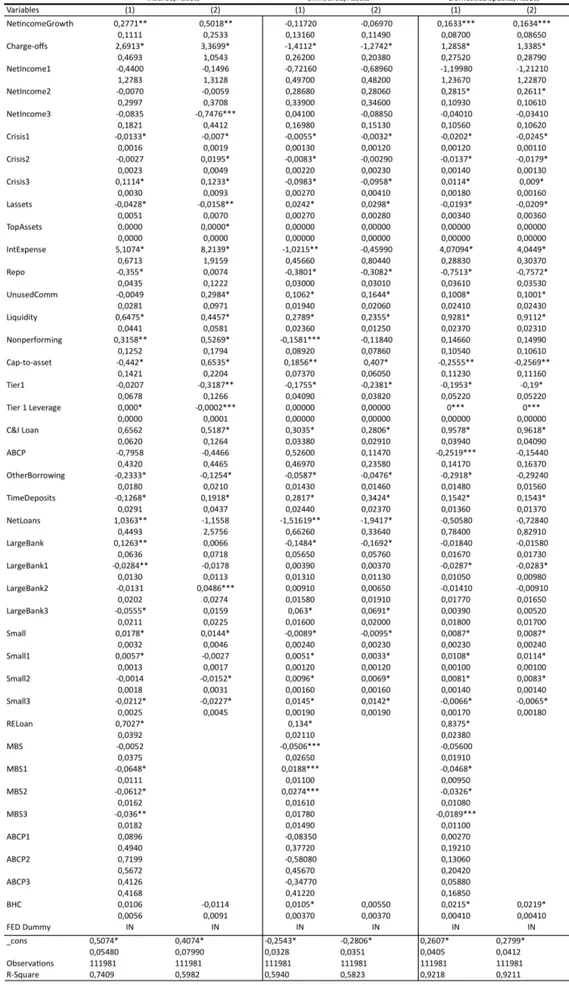
Table 3 reports the results of our model that aims to investigate the effect of the change in the bank’s net income on uninsured deposits that leave the bank over the course of the year and over each quarter, accounting for the different stages of the crisis. We have divided our table in three models. Model 1 looks at the variation of uninsured deposits triggered by changes in net income and bank size, without controlling for any other factors. Model 2 repeats this investigation, accounting for a set of bank-specific controls; and Model 3 extends the set of controls to the “2007-2008 Aggregate
Evidence” variables such as the Real Estate Loan share and Mortgage Backed-Securities exposure. Looking at the quarterly variation of uninsured deposits, we can evidence that in the pre-crisis period an increase in net income from one quarter to the other, yielded a positive effect on the change in uninsured deposits, across models, however this value is not statistically significant. Further by analyzing the interaction variable NetInc*Crisis across all three periods, we can evidence a positive effect of an increase in the variation of net income on uninsured deposits in Model3, for the second crisis period which is as expected, but again, the values are not statistically significant. Regarding bank size we can see that small banks see a statistically significant run on their uninsured deposits for the Crisis2 period is in both the 2nd and 3rd models, whilst larger banks lead to an increase in uninsured deposits for Model 3. Considering the variation of uninsured deposits from one year to the other, we can see that variation in net income is positive across the 3 crisis moments, however the values are not statistically significant. Large banks see an increase in uninsured deposits from one year to the other, but this value is only statistically significant for the first crisis period of the third model, regarded as a safe haven.
Moving on to the bank controls that are statistically significant, our results show that net charge offs lead to an outflow of uninsured deposits as has been studied in Santos (2012). Additionally banks with higher interest expense, tend to see a decrease in their uninsured deposits; Acharya and Mora (2012) have studied that banks in greater need of liquidity tend to offer higher rates for bank deposits, however banks with tighter liquidity needs tend to see a decrease in their uninsured deposits, as can be evidenced in our annual analysis. Another aspect to consider is that banks with higher capital ratios are less exposed to runs by uninsured depositors across our panel set.
The run on uninsured deposits can be defined as the portion of uninsured deposits that leave the bank over each quarter and year: ∆uninsureddepositst/uninsuredepositst-1. We
will now turn our analysis to the share of uninsured deposits in the bank’s assets, as Uninsureddepositst/Assetst-1, in table 5. We can evidence, again, that the changes in net
income that lead to an increase in uninsured deposits are not statistically significant, and that banks with greater net charge-offs, have statistically significant lower uninsured deposits.
Additionally, as expected, banks with a greater asset size, measured through the log of assets leads to a statistically higher amount of uninsured deposits. It is interesting to note that uninsured deposits are significantly bigger for the annual analysis of larger banks in the Crisis3 period. Banks with a greater Real Estate exposure tend to have a smaller share of uninsured deposits relative to its assets. Contrary to expected, banks with greater repo funding saw a decrease in their uninsured deposits, given the more unstable character of its funding.
In sum, we can evidence that the variation in net income is not the best measure of bank performance’s effect on uninsured deposits, as in spite of the increase in net income for most of the sample, the values are not statistically significant. However, it is worth noting that uninsured depositors do offer some market discipline as we could evidence in our results that bank’s with an unstable source of funding or lower liquidity ratios have a smaller share of uninsured deposits.
4. Insured Deposits
The FDIC insures deposits at the United States’ 8246 banks and savings associations, and promotes the safety and soundness of these institutions by identifying, monitoring
incentives for depositors to run on their bank, even in the presence of information signaling the poor financial performance from the bank. In this context, we will repeat the analysis performed for the uninsured deposits, to investigate the response of insured deposits to changes in net income. Looking at table 4, we see that the changes in net income and the net charge offs are not statistically significant. Differentiating between larger and smaller banks, we can evidence the decrease in insured deposits for smaller banks in the Crisis2 period are statistically significant. It is also interesting to note that changes in insured deposits for the Crisis1 period across all models at both the annual and quarterly level, which could be explained by the guarantee given to all Money Market Accounts, meaning that these funds did not move from these accounts into bank deposits. For Crisis2 we see an increase in Insured Deposits, as expected, given an increase in the deposit insurance limit and the increased risk perception. The statistically significant and positive variable for interest expense is worth mentioning, reflecting how banks offering higher rates, despite usually being associated to lower solvency and liquidity, still led to an increase in insured deposits, independent of market sentiment. As initially expected, banks with higher share of repo funding see an increase in insured deposits in their balance sheet. Considering the variables for the 2008 crisis, we can see that banks that are more exposed to real estate loans see a decrease in their insured deposits, as these types of assets significantly lost value, leading to great losses for banks.
Looking at the share of insured deposits in Table 5 relative to the previous years assets, we see the effect of the crisis leading to an increase in deposits for the Crisis2 sub-period. One interesting variable to look at is that of the net income variation with the Crisis2 period, where we see that even an increase in net income leads to a decrease in
insured deposits. Additionally the Crisis3 period starts marks the introduction of the reporting of the new deposit insurance limit and we can observe a statistically significant increase in insured deposits across models. Together with the fact that the size of the bank’s assets (log of assets) has a statistically significant and negative impact on the share of insured deposits can reflect either the decrease in households’ available income or the idea that deposit inflows weakened, relatively to its assets, leading us to consider a crisis of banks in aggregate and not just the weakest banks. Whilst expecting that banks with higher shares of unused commitments would lead to an increase in insured deposits, our results reflect the opposite, meaning that the funds are pulled out of the bank. As expected banks with a greater capital to assets ratio see a positive impact on insured deposits, to buffer bank losses.
Our results show that small banks had a statistically significant negative impact on insured deposits throughout the three moments, going back to our idea that size does matter.
Considering the overall domestic deposits run model in Table 4 we can evidence an increase in total deposits given an increase in net income during Crisis2 in our quarterly analysis as well as in the share of total deposits relative to assets. Furthermore banks with greater liquidity see a statistically significant positive effect on the changes in deposits. Large Banks saw an increase in their overall deposits from one year to the other, showing the importance of bank size and performance in the decision to affect funds.
We can understand that insured deposits do give the market some confidence as there was an increase in insured and total deposits throughout the crisis, the increase in total
deposits given the increase in interest expense, where depositors are safeguarded by a government-backed guarantee on their deposits.
V- Event Study
We will follow an event study methodology in an attempt to demonstrate the influence of changes in the FDIC deposit insurance limit on firm values. The effect of the policy changes throughout the crisis and the groups of banks it affected the most. We will look at daily returns around the following three events:
i) October 3rd 2008 - The Emergency Economic Stabilization Act – where the
deposit insurance limit was temporarily increased from $100,000 to $250,000, until the 31st of December 2009.
ii) May 20th 2009 – Congress signed off on extending the new deposit insurance limit of $250,000 through 2013, and on allowing the agency to borrow $100b from the Treasury Department.
iii) July 21st 2010 – The Dodd-Frank act was signed in Congress, making the $250,000 insurance limit permanent.
1. Sample Selection Procedure:
We collected data from the Center for Research in Security Prices at the University of Chicago (CRSP) for the bank holding companies for which daily stock price data were publicly available between February 2008 and July 2010. This resulted in a sample of 434 banks, for which we will perform our analysis. For each security we have used a 150-day estimation period, and the following 8-day event window, leaving a 10-day interval between the estimation and event windows, to reduce noise surrounding the date of the event in the calculation of normal and abnormal returns.
2. Abnormal Returns
The measurement of the event’s impact requires a measure of abnormal return. This can be calculated as the actual ex post return of the security over the event window minus the normal return of the firm over the estimation window.
ARit = Rit – E(Rit|Xt)
The calculation of abnormal returns, requires the specification of a model of normal returns to separate individual firm effects from overall market movements. Following the standard event study approach, we calculated the residual returns for each individual bank holding company for a 9-day (t=-4 to t=4) event window centered on the event dates (t=0), following the OLS market model:
Rjt = αj + βjRmt + Ejt,
Where αj and βj constitute the firm specific intercept and the covariance with the
market, respectively, estimated from returns for days -165 to -15. The error term Ejt is
assumed to have zero mean, be independent from Rmt and uncorrelated across firms. 3. Defining the test statistics under the null hypothesis:
Given the excess returns based on the market model, the statistical significance of the event period excess return is assessed for each sample. Further, given that the announcements occur on the same calendar date for all firms and firms that are in the same industry, we cannot assume that the abnormal returns are cross-sectionally independent. Therefore, we will use a test-statistic, following the parametrical approach, to assess the statistical significance of our results.
___ ___
t= AR0 / S(AR0) ,
where AR0 is the average residuals across firms for each day and S(AR0) is an estimate
of the standard deviation of these average abnormal returns.
To test the overall quality of the estimators, the null hypothesis to be tested is that the cumulative abnormal returns, defined as the sum of abnormal returns per bank across the event window is equal to zero.
Residual returns on the event days are, on average, statistically significant, at a 1% level for the first and second moments, and statistically significant at a 10% level for the third moment, reflecting market uncertainty around times of regulatory change.
4. Residual Returns:
Additionally, we will look at the residual returns for the event window, and analyze the abnormal returns for the days in which these policies were voted.
Brown and Warner concluded from their simulation examination that “even if a researcher is doing an event has a strong comparative advantage at improving existing methods, a good use of his time is still in reading old issues of the “Wall Street Journal” to more accurately determine event dates”, (1980, page. 249), and consider the information provided in these articles. Whenever available, we will study the residual returns for the days were news is available on the increases in the deposit insurance limits.
October 3rd 2008 – Moment 1
The Emergency Economic Stabilization Act, which became law on October 3rd 2008 did not have a smooth enactment process. Four days earlier, at the start of our analysis, the House of Representatives voted to reject a previous version of the bill, leading the stock market to see one of the largest and most precipitous declines in the recent past, with the S&P and the Dow Jones dropping around 8,8% and 7%, respectively, in one day or in a couple of hours, as stock markets started reacting at around 1:50 pm, when it was clear that the bill was not going to be approved1.
In this analysis we are expecting to capture a TBTF policy sign, hence creating a group
1 http://money.cnn.com/2008/09/29/markets/markets_newyork/index.htm http://online.wsj.com/news/articles/SB122277181408289865
of 7 banks that were required to participate in the TARP program by the Treasury – Goldman Sachs, Morgan Stanley, JP Morgan Chase & Co, Wells Fargo, Citigroup, the Bank of New York Mellon, Bank of America and State Street Corporation. This group would benefit disproportionately from the rest of the financial institutions, and we therefore expect the events on Monday to have a greater toll on this group’s returns. For the smaller banks, we expect a different reaction as in spite of their strong lobby for increased deposit insurance, to avoid seeing a flight from their deposits into larger and “perceived as” more stable banks, their opinion did not carry much weight in the September bill, comparatively to big banks, hence suffering less than the TBTF. We expect smaller banks to have a positive reaction when the Senate approved on October 1st (t=-2) a bill that included the deposit insurance provision, rather than on October 3rd, where the bill included many other regulatory changes that did not affect these banks as much.
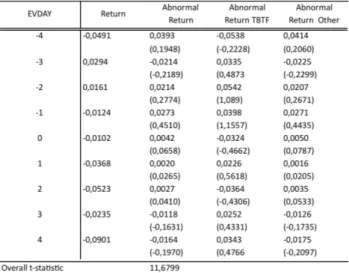
Table5 shows the stock market returns, abnormal returns for the entire sample and the abnormal returns for the TBTF group, as well as for the entire sample excluding the latter group. We can evidence that on t-4, the abnormal returns for larger banks was negative at a value of -5,38%, whilst the rest of the sample yielded a positive return. For the remainder of the sample, we would like to note that change in abnormal returns from t=-3 and t=-2, went from (2,25%) to 2,1%, with the approval of the bill that raised the deposit insurance limit.
May 20th 2009 – Moment 2
Moving on to the second event in our analysis on May 20th 2009, the Help Families Save their Homes Act, which is intended to help prevent mortgage foreclosures, and help homeowners to find alternative ways not to default on their mortgages.
Additionally, the deposit insurance limit was extended, and Congress also signed off on allowing the FDIC to borrow as much as $100b from the Treasury Department, given the FDIC more space to act in the midst of several bank failures and the depletion of the corporation’s funds. Another point worth mentioning is the uncertainty about the FDIC’s plan to assess banks with a one-time fee to bulk up the deposit-insurance fund announced by the FDIC chairman in February, when her plea for enhanced borrowing authority was given little attention. Smaller banks began to lobby for the increase in the FDIC’s borrowing power, as they feared to be hit the most by these assessments and fees. For this reason we expect abnormal returns around the event day for both large and smaller banks, given the uncertainty and debate about bank controls in anticipation of the FDIC Chairman Sheila Bair’s announcement the following week. Looking at the abnormal returns in Table 7 we can see that smaller banks’ abnormal returns on t=.1 of -1,2% were bigger than that of large banks of -0,7%.
July 21st 2010 – Moment 3
Looking at the signing of the Dodd-Frank and Consumer Protection Act, coming after a series of emergency measures that started to look like longer term fixtures, the Act made the $250,000 deposit insurance limit permanent. This Act constituted one of the most significant financial reforms in the United States, as it encompasses several measures to provide more stability and discipline to markets. The Dodd Frank Act has been designed to better monitor the performance of bigger firms to avoid the widespread economic collapse it has the possibility of breaking up larger firms to mitigate systemic risk. It also regulates bank’s trading activities through the Volcker Rule; on the consumer side it intends to simplify credit agreements, to prevent predatory
be erroneous to analyze the abnormal returns with respect to the changes in the deposit insurance limit. However we have included the abnormal returns in Table 7 to evidence the reaction to these measures by bigger banks and the remainder of the sample.
6. Residual Returns and Bank characteristics:
Additionally, we will attempt to explain the cross-sectional differences in abnormal returns, based on bank’s total asset size and solvency ratio. We have defined 4 groups based on asset size, where group 1 encompasses the smallest banks going up to group 4, across the TBTF banks and the remainder of the sample.
We have also developed a solvency ratio, following Swary (1986):
Solvency ratio=(Nonperforming Assets + Real Estate Debt)/ Stockholder’s Equity, This ratio attempts to measure the effects of both bad loans, namely from the real estate loan share, and the bank’s capitalization. We use the value of 100 as a cutoff between solvent and insolvent banks.
We will look at the bank characteristics for the date of the enactment of the Emergency Economic Stabilization Act, as it constituted the first moment for the implementation of these policies, and believe that these bank groups will behave similarly throughout the three moments.
Looking at Tables 9, 10 and 11 we can evidence that the insolvent banks have a small positive average return comparatively to the solvent banks that yield a small negative return. Additionally solvent banks have a bigger asset size, and greater relative TARP funds, given the depth of their activities, alongside the fact that many of the banks that failed had not qualified to participate in the TARP program. Segmenting our sample in 4 groups by asset size, we see that the 4th quarter of banks – the group of the largest banks has positive abnormal returns, whilst the abnormal returns for the TBTF group
yielded negative returns. This reinforces the power of the 8 banks included in the TBTF group in influencing the market and policymakers.
VI – Conclusion
Much of the literature on deposit insurance has been related to the moral hazard of such schemes. However, through our analysis we could evidence that deposit insurance does bring some stability to the markets as in times of market distress such as the evidence of an inflow of deposits in the midst of the banking crisis in 2008-2009. This role of liquidity provision is at the core of the bank’s activity in the mismatch between liquid demand deposits and the assets held by the bank. The role of government backed deposit insurance comes in guaranteeing depositors about the safety of their funds. One particular aspect of the recent financial crisis is the broad scope of instruments that resemble demand deposits and that competed with banks in capturing funds, which also had to be accounted for in the policymaking. According to Ben Bernanke, the three basic tools used for restoring confidence in markets are the temporary public or private guarantees – of bank debt, money market accounts; measures to strengthen financial institutions’ balance sheets, such as public capital injection; and public disclosure of the conditions of financial firms, such as the stress tests performed in 2009 in the US, and more recently in Europe. These measures have been used internationally - Demirgüç-Kunt, Karacaovali, and Laeven (2005) show that most countries provide either explicit or implicit deposit insurance to demand accounts, however some countries decided to introduce deposit insurance schemes for the first time in the 2008-2009 financial crisis, such as New Zealand, Australia and China. Others increased their coverage such as the UK that pledged 100% deposit guarantees in the context of the run on Northern Rock in 2007. Another characteristic is the possibility of geographic spread of panic between
countries, given the strong link between economies. One example is that of Cyprus, leading to panic by depositors in other European countries such as Portugal, who did not trust the guarantees system, started moving their money out of deposit accounts into their safes at the bank, leading bankers to push for tighter regulation at the EU level. References:
- Acharya, Viral, Philipp Schnabl, and Gustavo Suarez, 2009, “Securitization without Risk Transfer,”Journal of Financial Economics.
- Brown, S. and J. Warner, 1985, “Using daily stock returns: The case of event studies”, Journal of Financial Economics 14, 3-31.
- Berger, A., Bouwman, C., 2009. “Bank liquidity creation. Review of Financial Studies”
- Brunnermeier, Markus, 2009, “Deciphering the Liquidity and Credit Crunch 2007-2008,” Journal of Economic Perspectives , 23(1), 77-100.
- Demirgüç-Kunt, Karacaovali, Baybars and Laeven, Luc, 2005, “Deposit Insurance Around the World: A Comprehensive Database”.
- Diamond, D. W. and P. Dybvig, 1983, Bank runs, deposit insurance and liquidity, Journal of Political Economy 91, 401-419.
- Lambert, Claudia; Noth, Felix and Schuwer, Ulrich, 2013, “How do Insured Deposits Affect Bank Stability? Evidence from the 2008 Emergency Economic Stabilization Act”
- O’Hara, Maureen and Shaw, Wayne, 1990, “ Deposit Insurance and Wealth Effects: The Value of Being “Too Big To Fail”, Journal of Finance, Vol. 45, No. 5
- Pennacchi, George. 2006. “Deposit Insurance, Bank Regulation, and Financial System Risks,” Journal of Monetary Economics , 53(1), 1-30.
- Santos, João, 2012, “Combining Deposit taking with credit line provision and the risk of concurrent runs by depositors and firms”
- Swary, I., 1986, Stock market reaction to regulatory action in the Continental Illinois Crises, Journal of Business 59, 451-473.
Table 1: Weekly Variation using Federal H8 Release Data
Table 2 – Summary Statistics
Insured Share is the share of insured deposits relative to the previous year assets; Uninsured Share is the share of uninsured deposits relative
to the previous year assets; Domestic Share is the share of domestic deposits relative to the previous year assets; Ginsured is the variation of the log of insured deposits; Guinsured is the variation of the log of uninsured deposits; Gdep is the variation of the log of domestic deposits;
NetincomeGrowth is the variation in net income from one period to the other relative to the previous year’s assets; Charge-Offs is the bank’s
net charges-offs scaled by total assets; TopAssets constitutes the total assets per bank; IntExpense is the bank’s interest expense scaled by assets; Repo is the bank’s amount of repo debt over assets; UnusedComm Ratio is the Bank’s unused commitments divided by total
commitments and loans; Liquidity is calculated as the sum of cash and securities over assets; Nonperforming is calculated as the Loans past 90 days relative to total loans; Cap-to-Asset is calculated as the bank’s capital divided by assets; Tier1 divided by the risk-weighted assets;
Tier1 Leverage is calculated by Tier 1 Core Capital divided by a firm’s total average consolidated assets; C&I Loan Commercial and
Industrial Loans scaled by Assets; OtherBorrowing constitutes banks other sources of funding, including mortgage indebtness and obligations under capitalized leases, excluding deposits, federal funds purchased, securities sold under agreements to repurchase in domestic offices of the bank and trading liabilities; Time Deposits scaled by assets; NetLoans is calculated as the Net Loans and Leases scaled by domestic deposits;
Table 6 - Moment1 Abnormal Returns Table 7 - Moment 2 Abnormal Returns
Table 8 – Moment 3 Abnormal Returns Table 9 – Summary Characteristics
Table 10 – Bank characteristics by Solvency