UNIVERSIDADE DE LISBOA
FACULDADE DE CIÊNCIAS
DEPARTAMENTO DE QUÍMICA E BIOQUÍMICA
THERMODYNAMIC STUDIES
OF NICOTINIC ACID
Elsa Marisa Duarte Rodrigues Gonçalves
DOUTORAMENTO EM QUÍMICA
(Química-Física)
UNIVERSIDADE DE LISBOA
FACULDADE DE CIÊNCIAS
DEPARTAMENTO DE QUÍMICA E BIOQUÍMICA
THERMODYNAMIC STUDIES
OF NICOTINIC ACID
Elsa Marisa Duarte Rodrigues Gonçalves
Tese Orientada pelo Prof. Dr. Manuel Eduardo Minas da Piedade
DOUTORAMENTO EM QUÍMICA
(Química-Física)
| ix
Resumo
O trabalho apresentado nesta tese foi desenvolvido no grupo de Energética Molecular do Centro de Química e Bioquímica da Faculdade de Ciências da Universidade de Lisboa. O objetivo geral do grupo é o estudo da relação entre a energética de moléculas ou conjuntos de moléculas e a respetiva estrutura e reatividade.
Nos últimos anos, o laboratório em que estive integrada dedicou especial atenção à investigação de sólidos moleculares orgânicos, em particular, à forma como diferenças estruturais e morfológicas se podem refletir nas propriedades físicas e na energética dessas substâncias. Na altura em que o meu trabalho foi planeado, começou a dar-se particular atenção a compostos com interesse farmacêutico dado que a possibilidade ocorrência de polimorfos ou solvatos em sistemas deste tipo, pode ter consequências importantes na sua aplicação como princípios activos. De facto, embora a molécula que constitui o princípio activo não varie, duas formas cristalinas diferentes apresentam, muitas vezes, propriedades físicas (ponto de fusão, solubilidade e energia de coesão, etc.) significativamente diferentes. Por exemplo, variações de solubilidade podem conduzir a alterações de biodisponibilidade.
O ácido nicotínico (niacina), apresenta caraterísticas que o tornam um bom candidato para esse tipo de estudos. É uma molécula relativamente rígida e possui dois centros aceitadores (N, C=O) e um outro doador (OH) para a formação de ligações de hidrogénio. As ligações de hidrogénio condicionam fortemente a organização molecular e o empacotamento das moléculas em estado sólido. Assim, a possibilidade de existência de mais do que uma combinação doador/aceitador para interações de hidrogénio entre moléculas de ácido nicotínico sugeria que o composto poderia apresentar polimorfismo, ou seja, cristalizar em mais do que uma forma cristalina. Acresce, que, conforme referido na Introdução e noutros capítulos da presente tese, o ácido nicotínico é um princípio ativo farmacêutico muito importante e pode ser adquirido a preços acessíveis numa escala razoavelmente elevada (100 g). A pesquisa de polimorfismo neste composto foi pois o ponto de partida para a presente tese. Curiosamente, as tentativas de obter polimorfos ou solvatos (ex.: hidratos) do ácido nicotínico por recristalização em diferentes solventes mostraram que, ao contrário dos seus derivados hidroxilo, o ácido nicotínico tem tendência
a cristalizar sempre na mesma forma cristalina, o que não deixa de ser uma constatação interessante.
O trabalho iniciado com a procura de novos polimorfos do ácido nicotínico acabou por evoluir, essencialmente, para os seguintes tópicos:
(i) Caraterização estrutural, morfológica e energética de uma amostra de ácido nicotínico padrão (NIST Standard Reference Material 2151). Este estudo, descrito no Capítulo 3, teve como intuito obter dados de referência, a partir dos quais, o modo como diferenças estruturais e morfológicas nos cristais se refletem na respetiva energética, pudesse ser avaliado. Conduziu ainda à obtenção das entalpias de formação do ácido nicotínico nos estados cristalino e gasoso, bem como da respetiva entalpia de sublimação, cujos valores publicados apresentavam uma discrepância considerável;
(ii) A determinação da solubilidade de equilíbrio do ácido nicotínico em seis solventes com polaridades, polarizabilidades e aptidão para formação de ligações de hidrogénio diferentes (água, etanol, dimetil sufóxido, acetona, acetonitrilo e éter etílico), descrita no Capítulo 4. Os desvios à solubilidade ideal foram analisados com base nos coeficientes de atividade obtidos para o composto nos vários solventes e a ordem de solubilidade observada (dimetil sufóxido >> água > etanol > acetona > éter etílico > acetonitrilo) foi interpretada em termos de descritores das caraterísticas desses solventes. Verificou-se ainda que tanto a natureza do solvente como o facto de o ácido nicotínico ter caráter zwiteriónico em água e não zwiteriónico nos restantes solventes não afetava a natureza da forma cristalina em equilíbrio com a solução, que correspondia sempre à mesma fase monoclínica;
(iii) O estudo da influência da temperatura e força iónica nas constantes de dissociação ácida do ácido nicotínico. Este estudo, incluído no Capítulo 5, foi motivado pela discrepância observada entre os valores dessas constantes na literatura, e pelo facto de esses dados intervirem, quer nos estudos de solubilidade descritos no Capítulo 4 quer nos estudos de dissolução/diluição de soluções aquosas de ácido nicotínico mencionados no Capítulo 6;
(iv) Finalmente, o Capítulo 6 inclui resultados de medidas de entalpia de dissolução do ácido nicotínico em água e de diluição de soluções aquosas de ácido nicotínico. Combinando estes resultados, com as constantes de dissociação ácida do ácido nicotínico apresentadas no Capítulo 5 e as correspondentes entalpias de dissociação ácida obtidas da
| xi
literatura foi possível determinar as entalpias de formação, a diluição infinita, das três espécies envolvidas no equilíbrio de protonação/desprotonação.
Palavras-chave: ácido nicotínico, niacina, polimorfismo, termoquímica, energética,
calorimetria, efusão de Knudsen, entalpia de formação, entalpia de sublimação, entalpia de protonação/desprotonação, solubilidade, coeficiente de atividade, descritores do solvente, constantes de acidez, entalpia de diluição.Abstract
The work presented in this thesis was carried out at the Molecular Energetics group from “Centro de Química e Bioquímica” of “Faculdade de Ciências da Universidade de Lisboa”. The general research goal of the group is the study of the relationship between the energetics of molecules or groups of molecules and their structure and reactivity.
In the recent years, the laboratory where I worked devoted special attention to the study of organic molecular solids, in particular, to the way structural and morphological differences in crystals are reflected by their physical properties and energetics. At the time my thesis was planned, the group was particularly interested in compounds relevant for pharmaceutical applications, since the possibility of occurrence of polymorphs or solvates in these substances can have an important impact on their use as active pharmaceutical ingredients. Indeed, although the active molecule remains the same, different crystal forms can exhibit significantly different physical properties (e. g. melting point, solubility, and cohesive energy). For example, differences in solubility can significant affect the bioavailability of a drug.
Nicotinic acid (niacin) seemed a good candidate for this kind of studies. It is a reasonably rigid molecule and has two hydrogen bond acceptor (N, C=O) and one donor (OH) centers. Hydrogen bonds strongly determine molecular organization and packing in the solid state. Thus, the possibility of more than one combination donor/acceptor for hydrogen interactions between molecules of nicotinic acid suggested that the compound
could perhaps be prone to polymorphism, i.e. crystallize in more than one crystal form. Moreover, as stated in the Introduction and in other chapters of this thesis, nicotinic acid is a very important active pharmaceutical ingredient and is available on a fairly high scale (~100 g) at an affordable price. The starting point of the thesis was therefore, the investigation of polymorphism in this compound. Remarkably, the several attempts to obtain polymorphs or solvates (e.g. hydrates) by recrystallization from various solvents showed that, unlike its hydroxyl derivatives, nicotinic acid has a tendency to always crystallize in the same solid form, a result which is nevertheless interesting.
The work that started as a quest for nicotinic acid polymorphism evolved into the following topics:
(i) Structural, morphological, and energetic characterization of a nicotinic acid (NIST Standard Reference Material 2151) standard sample. The aim of this study, described in Chapter 3, was to obtain data, which could be used as references for intercomparison of different nicotinic acid samples, when trying to assess the effect of structural and morphological differences in the energetics of crystals. It also led to the determination of reliable enthalpies of formation of nicotinic acid in gaseous and crystalline states and to the corresponding enthalpy of sublimation, whose previously published values showed considerable discrepancies.
(ii) Determination of equilibrium solubility of nicotinic acid in six solvents differing in polarity, polarizability, and hydrogen bond ability (water, ethanol, acetone, dimethyl sulfoxide, acetonitrile and diethyl ether), described in Chapter 4. Deviations from ideal solubility were analyzed based on the activity coefficients obtained for the compound in the different solvents. The observed solubility order (dimethyl sulfoxide >> water > ethanol > acetone > diethyl ether > acetonitrile) was interpreted in terms of descriptors of these solvents. Finally, it was found that both the nature of the solvent and the fact that nicotinic acid is predominantly zwitterionic in water and nonzwitterionic in the nonaqueous media did not affect the nature of the crystalline form in equilibrium with the solution, which always corresponded to the same monoclinic phase.
(iii) The study of the influence of temperature and ionic strength on the acid dissociation constants of nicotinic acid. This study, included in Chapter 5, was motivated by the discrepancies observed in the values of these constants in the literature and by the
| xiii
fact that these data were required for the interpretation of the solubility and dilution/solution results presented in Chapters 4 and 6.
(iv) Finally, Chapter 6 includes results of enthalpies of solution of nicotinic acid in water and enthalpies of dilution of aqueous nicotinic acid solutions. Combining these results, with the above mentioned acid dissociation constants, on Chapter 5, and the corresponding enthalpies of proton dissociation retrieved from the literature, it was possible to determine the standard molar enthalpies of formation at infinite dilution, of the three nicotinic acid species involved in the protonation/deprotonation equilibria.
Keywords: nicotinic
acid, niacin, polymorphism, thermochemistry, energetic, calorimetry, Knudsen effusion, enthalpy of formation, enthalpy of sublimation, enthalpy of protonation/deprotonation, solubility, activity coefficient, solvent descriptors, acidity constants, enthalpy of dilution.Acknowledgments
First and foremost, I wish to express my gratitude to my supervisor, Prof. Dr. Manuel Eduardo Minas da Piedade, whose expertise and monitoring, added considerably to my knowledge and to the quality of my work during these last four years. He has been a role model both in my scientific work as in my career.
I wish to thank the members of Molecular Energetics research group at FCUL, Prof. Dr. José Artur Martinho Simões, Ricardo Simões, Joana Vitorino and Abhinav Joseph, for the assistance they provided me at every level, and for being such good colleagues. A special thanks to the colleagues and good friends Prof. Dr. Rui Borges and Dr. Rui Centeno, for all the assistance and support and for reading my thesis. A special thanks also to Dr. Carlos Bernardes for all the assistance and support in the lab and for reading parts of my thesis.
During this work I have collaborated with many Professors and colleagues for whom I have the highest regard, and I wish to extend my warmest thanks to all those who have helped me with my work.
My warm thanks are due to Prof. Dr. Hermínio Diogo from Instituto Superior Técnico, for his patience during the extensive discussions about my work and for granting me full access to all the equipment of his laboratory, where I performed the Knudsen effusion and differential scanning calorimetry experiments.
A special thanks to Prof. Dr. António Conceição from Instituto Superior Técnico for his guidance and support on several subjects, namely regarding on my potentiometric studies.
Thanks to Prof. Dr. Filomena Leitão and to her PhD student, my friend Marina Reis from FCUL, for their help and for providing the means to carry out the reactionsolution calorimetry experiments.
Thanks to Prof. Dr. Maria Ermelinda Eusébio and Dr. Sandra Nunes from Faculdade de Ciências da Universidade de Coimbra, for their support on infrared analysis and for their kind welcome during my stay in Coimbra.
Thanks to Prof. José Manuel Nogueira and his PhD student Nuno Neng, from FCUL, for carrying out the GCMS analysis.
| xv
Thanks to Prof. Matthias Epple and his students Janine Schwiertz and Daniel Hagmeyer, from University of DuisburgEssen in Germany, for the support and help with the SEM experiments and image analysis.
I would also like to thank my parents and my brother, Maria Francisca, José and Daniel, for the support they provided me through my entire life and, specially, for encouraging me to return to my studies.
Last but not least, I owe my loving thanks to my boyfriend, Jorge, for his unlimited and unconditional support and for making me believe that with faith and hard work everything is possible.
Contents
Pages Resumo ix Palavras-Chave xi Abstract xi Keywords xiii Acknowledgments xiv 1 Introduction 1 1.1 References 92 Apparatus and Methods 13
2.1 Knudsen Effusion Method 14
2.2 Calvet Microcalorimetry 20
2.3 Differential Scanning Calorimetry 24
2.4 SolutionReaction Calorimetry 27
2.5 Flow Microcalorimetry 31
2.6 References 34
3 Energetics and Structure of Nicotinic Acid 37
4 Solubility of Nicotinic Acid in Water, Ethanol, Acetone, Diethyl Ether, Acetonitrile, and Dimethyl Sulfoxide
85
5 Potentiometric Titration Study of the Temperature and Ionic Strength Dependence of the Acidity Constants of Nicotinic Acid (Niacin)
147
6 Thermochemistry of Aqueous Pyridine3Carboxylic Acid (Nicotinic Acid)
CHAPTER
1
N
icotinic acid (NA, CAS number [59676]), pyridine3carboxylic acid has received increasing attention over the years because of its versatility in terms of chemical applications and, particularly, in terms of its significant biochemical and therapeutical roles. The world demand for nicotinic acid and its derivatives has been steadily rising from 8500 t per year in the 1980s, to 22000 t in the 1990’s, and, more recently, 3500040000 t [1-3].The compound is credited to have been synthesized for the first time by Huber, in 1867 [4], via the oxidation of nicotine with sulfuric acid and potassium dichromate (Scheme 1.1) [5]. The name “nicotinic acid” was apparently proposed by Weidel in 1873 [5, 6] to emphasize the relation with nicotine. Weidel obtained nicotinic acid through the oxidation of nicotine with nitric acid, but proposed a wrong stoichiometry, C10H8N2O3. Weidel’s product was shown by Laiblin [7] to correspond to the same substance made by Huber. Three years latter Weidel [8] prepared the same compound from 3methylpyridine (3picoline) and thus demonstrated that nicotinic acid corresponded, in fact, to pyridine3carboxylic acid. The acronym niacin was coined from nicotinic acid+vitamin. It was suggested by the American Medical Association as more commercially viable than nicotinic acid because some antitobacco groups warned that the use of the compound as an additive in enriched bread and other foods could encourage the cigarette habit [9].
The chemical processes for the industrial production of nicotinic acid currently involve liquid phase oxidation of either 2methyl5ethyl pyridine with nitric acid, or
I n t r o d u c t i o n
| 3
3methylpyridine in combination with cobalt acetate, manganese acetate, and aqueous hydrobromic acid [10]. Both these methods require high temperature and pressure (e.g. 101 MPa and 483 K). Electrochemical pathways for oxidation of 3methylpyridine to nicotinic acid have also been proposed, as well as biochemical methods based on the use of microbial enzymes (nitrilase or nitrile hydratase and amidase) that hydrolyse 3cyanopyridine to nicotinic acid (Scheme 1.2) [11-13].
Noteworthy examples of diverse chemical applications of nicotinic acid are the preparation of matrixes for matrixassisted laser desorption ionization (MALDI) mass spectrometry analyses of large polypeptides [14], the uses in zinc electroplating, as anticorrosion agent for aluminumzinc alloys in contact with acid solutions [15], and the recommendation as a reference material for combustion calorimetry [16, 17].
The vitamin function of nicotinic acid (vitamin B3) [18, 19] was demonstrated in the early 20th century [5, 20], when it was recognized as an indispensable dietary factor for humans and animals [18, 19]. It has subsequently been widely used as an additive in food, forage, and cosmetics [18, 19].
In animals, nicotinic acid is synthesized in the liver, and the main precursor of its syntheses is Ltryptophan, an essential aminoacid. The mechanism by which nicotinic acid is produced in the liver is illustrated in Figure 1.1. The 5membered aromatic heterocycle of Ltryptophan is cleaved and rearranged with the alpha amino group of tryptophan into the 6membered aromatic heterocycle of nicotinic acid [21].
The deficiency in nicotinic acid (or its precursor Ltryptophan) leads in humans to the development of pellagra, a systemic disease characterized by a severe photosensitive, dermatitis, and, ultimately, resulting in dementia and death [22]. Good natural sources of
nicotinic acid are yeast, milk, eggs, cereals and some fruits or vegetables like avocado, broccoli, tomato, carrot, asparagus, and sweet potato [23].
Nicotinic acid has been employed since the 1950s, to lower plasma levels of triglyceride (TG) and lowdensity lipoprotein cholesterol (LDLc) particles (“bad cholesterol”) while concomitantly raising the levels of (“good”) highdensity lipoprotein cholesterol (HDLc) [20, 24-27]. It is, in fact, claimed to be the most effective agent currently marketed for raising HDLc plasma levels [21, 26-29] and has been extensively explored in the production of drugs for the prevention of atherosclerosis and cardiovascular events [21, 27-29]. Although the mechanism by which nicotinic acid lowers LDLc plasma levels and raises HDLc is not completely elucidated, recent studies showed that it involves an interaction with a biological receptor (GPR109aGi proteincoupled) on the adipose tissue promoting its activation (Figure 1.2) [24, 25, 27, 30]. The detailed nature of this interaction is uncertain. According to the model recently proposed by Tunaru et al. [30] (see inset of Figure 1.2) the nicotinic acid molecule interacts with aminoacid residues on the GPR109a receptor essentially by means of three hydrogenbonds (Hbond): one involves the N atom in the heterocyclic ring and the OH group of a serine residue in the extracellular loop 2 (ECL2); the other two are formed between the COOH group of nicotinic acid and two N sites of an arginine residue located on the transmembrane helix
Figure 1.1. Mechanism (adapted from reference [21]) of the biosynthesis of nicotinic acid on the liver.
I n t r o d u c t i o n
| 5
3 (TMH3). The ligand binding is further stabilized by means of weaker interactions with other residues like phenylalanine (ECL2 and TMH7), tyrosine on TMH7, asparagine on TMH2, and tryptophan on ECL1 [30]. The accuracy of this picture is still to be confirmed. In fact the model does not rely on direct evidence from an Xray diffraction structure of GPR109a with bonded nicotinic acid. It was based on: (i) sitedirected mutagenesis of putative ligand binding residues on GPR109a to identify the aminoacid residues critical for binding of nicotinic acid; (ii) docking studies of nicotinic acid to those residues in a structural model of GPR109a that was first generated by homology using the Xray structure of Rhodopsin as template and then refined by energy minimization based on force
Figure 1.2. Mechanism (adapted from references [27, 30]) of action of nicotinic acid that increases the highdensity cholesterol (HDLc) level by activating the biological receptor GPR109a.
field calculations [30].
From the activation of the GPR109a receptor an antilipolytic response is developed lowering intracellular cyclic adenosine monophosphate (cAMP) levels and decreasing the protein kinase A (PKA) activity. This leads to a decline of lipase activity and, finally, to a reduction of intracellular triglyceride (TG) hydrolysis and free fatty acid (FFA) secretion [25, 27]. The decrease in FFA levels induced by nicotinic acid results in a substrate deficiency for the hepatic TG synthesis. Consequently, less TG and less very lowdensity lipoprotein cholesterol (VLDLc) are produced by the liver and, as a result, TG and VLDLc as well as LDLc plasma levels drop.
The mechanism of the nicotinic acid–induced increase HDLc levels is not completely clear. Most likely, the decrease in TG levels in apoprotein B (ApoB) containing lipoproteins (LDLc/VLDLc) results in a decreased exchange between cholesterol esters carried out by HDL-c particles and TG in VLDLc and LDLc particles, that leads to an increase in HDLc cholesterol plasma concentrations [27].
Nicotinic acid is solid when used as an active pharmaceutical ingredient (API) and for various other purposes. It is well known that the physical properties of organic molecular solids may be affected by the methods of production and processing, with an important impact on the enduse applications. For example, the manufacturing of solid dosage forms normally involves the purification of the API by crystallization from solution, followed by grinding and compaction. These processes can be influenced by the crystallinity, size, morphology, and energetics (lattice and surface energies) of the API particles, and even the nature of the obtained phase if different polymorphs are formed. These aspects dictate, in turn, the dissolution rate of the drug, ultimately affecting its therapeutic time window [31-34].
The importance of nicotinic acid both as a nutrient, as an API, and as a standard reference material for the measurement of enthalpies of combustion [16] makes it an attractive candidate for a variety of studies. This thesis was essentially focused on the investigation of (i) the relationship between the structure and energetics of individual nicotinic acid molecules [35]; (ii) the possible tendency of the compound to occur in different polymorphic or solvatomorphic forms that could eventually coexist under the same temperature and pressure conditions [36]; (iii) the influence of changes in crystallinity, morphology, particle size distribution, etc., of a given sample, on its
I n t r o d u c t i o n
| 7
thermodynamic stability; (iv) the solubility of nicotinic acid in aqueous and nonaqueous media and; (v) the energetics of nicotinic acid in aqueous solution.
These studies had various motivations. For example, while a preformulation study carried out by thermogravimetry showed no significant effect of compaction and grinding on the kinetics of nicotinic acid sublimation [37], the values of the standard molar enthalpies of sublimation at 298.15 K, subHmo(NA), published over period of eighteen years spanned a range of ~20 kJmol-1 [38-41]. Moreover, the three independent
determinations of the standard molar enthalpy of formation of crystalline nicotinic acid, o
f m
Δ H (NA, cr), reported over a period of twentyfour years diverged by no more than ±0.5 kJmol-1 [40, 42, 43] but a fourth and recent measurement led to a fHmo (NA, cr) value differing by 288 kJmol-1 from the average of all the previous ones [44]. This prompted
the redetermination of fHmo (NA, cr) and subHmo(NA) described in Chapter 3. Because of the impact the nature of a solid sample (crystallinity, morphology and size distribution of the particles) may have on its physical and thermodynamic properties, these determinations were carried out by using the same NIST standard reference material 2151, which was also thoroughly characterized in terms of structure and morphology. The obtained thermochemical data can be used as a reference to compare the “thermodynamic stability” of other solid samples based, for example, on solution calorimetry tests such as those described in Chapter 4.
Nicotinic acid is normally purified by crystallization. In general, for the adequate design of processes and products, based on cooling crystallization, the solubility of the material of interest, in different solvents must be known as a function of temperature, since it is closely related to the maximum achievable yield of solid [45]. Ideally, solubility determinations should be accompanied by the characterization of the crystal forms in equilibrium with the solution. Due to variations in solventsolute interactions, each solvent can stabilize a different type of prenucleation aggregate of solute and this may lead to the precipitation of different crystalline forms of the same substance (polymorphs or solvates) [45-47]. These polymorphs often exhibit significantly different physical properties, such as the fusion temperature, solubility, or dissolution rate in a given media [31-33]. Hence, overlooking the identification and tight control of the formation of
polymorphs or solvates can play havoc with the safe and effective use of a product [31-33]. Chapter 4 describes the investigation of the solubility of nicotinic acid in different solvents that differ in polarity/polarizability and hydrogenbonding ability: water and ethanol (polar and protic); dimethyl sulfoxide (DMSO), acetone, and acetonitrile (polar and aprotic); and diethyl ether (apolar and aprotic). The main objectives were investigate: (i) the role of the solvent nature in determining the solubility of nicotinic acid; (ii) and if the use of different solvents could induce significant morphological or structural changes in the solid material present in equilibrium with the solution. The observed solubility trends were also analyzed in terms of a number of parameters representative of the polarity, polarizability, and hydrogenbonding acceptance/donation ability of the solvent.
The biological activity of nicotinic acid occurs in aqueous media. Thus equally interesting is the energetics of nicotinic acid in aqueous solution. Aqueous nicotinic acid is an amphiprotic system where four species may be present in equilibrium (Scheme 1.3): one positively charged (AH ), two of isoelectric type (+2 AH± and AHo), and a fourth one negatively charged (A). Thus the energetic characterization of aqueous nicotinic acid cannot ignore the nature and concentrations of the different species that may be present in equilibrium under specific pH and ionic strength conditions. This may, for example, be a key aspect influencing drug permeation [48]. Because the published pKa1 and pKa2 values of nicotinic acid spanned considerable ranges (1.87 to 3.60 and 4.33 to 5.12, respectively) and there was no systematic study of their dependence on both temperature and ionic strength, the potentiometric determinations described in Chapter 5 were carried out. The obtained data were also necessary to discuss some aspects of the solubility of nicotinic acid in water (Chapter 4) and to obtain the enthalpies of formation of the positively
I n t r o d u c t i o n
| 9
charged, isoelectric (AH±AHo), and negatively charged species indicated in Scheme 1.3, from enthalpy of solution and dilution measurements carried out by solution and flow microcalorimetry. These last studies are described in Chapter 6 and led, among other things to the standard molar enthalpies of formation of the AH , +2 AH±AHo, and A
nicotinic acid species involved in protonation/deprotonation equilibria, at infinite dilution. Finally, throughout this thesis a large variety of experimental techniques had to be used. The main thermochemical methods that are not detailed in Chapters 36 are described in Chapter 2.
1.1
References
1. S. Shimizu, Vitamins and Related Compounds: Microbial Production. In
Biotechnology: A Multi-Volume Comprehensive Treatise, 2nd Completely Rev. ed.,
Eds.: H. -J. Rehm; G. Reed; A. Puhler; P. J. W. Stadler, VCH, Weinheim, 2001. Vol. 10.
2. K. Weissermel; H. -J. Arpe, Industrial Organic Chemistry, 4th ed., Wiley-VCH, Weinheim, 2003.
3. M. Cantarella; L. Cantarella; A. Gallifuoco; R. Intellini; O. Kaplan; A. Spera; L. Martínková, Enzyme Microb. Technol., 2008, 42, 222-229.
4. C. Huber, Justus Liebigs Annalen der Chemie, 1999, 141, 271-271. 5. C. A. Elvehjem, Teply, L. J., Chem. Rev., 1943, 33, 185-208. 6. H. Weidel, Ann. Chem. Pharm., 1873, 166, 330-343.
7. R. Laiblin, Ber., 1877, 10, 2136-2140. 8. H. Weidel, Ber., 1879, 12, 1989-1993.
9. Douglas Harper, Online Etymology Dictionary.
http://www.etymonline.com/index.php?l=n&p=7 (accessed 2011-03-18). 10. M. Hatanaka; N. Tanaka, World Patent, 93.5022 A1. 1993.
11. C. D. Mathew; T. Nagasawa; M. Kobayashi; H. Yamada, Appl. Environ.
12. P. A. Vaughan; C. J. Knowles; P. S. J. Cheetham, Enzyme. Microb. Technol., 1989,
11, 815-823.
13. Q. A. Almatawah; D. A. Cowan, Enzyme. Microb. Technol., 1999, 25, 718-724. 14. M. Karas; F. Hillenkamp, Anal. Chem., 1988, 60, 2299-2301.
15. C. Rio-Estrada; H. W. Dougherty, Vitamins. In Kirk-Othmer Encyclopedia of
Chemical Technology, 2nd ed., Ed.: A. Standen, Wiley, New York, 1970. Vol. 21.
16. K. N. Marsh, Recommended Reference Materials for the Realization of
Physicochemical Properties. IUPAC–Blackwell Scientific Publications, Oxford,
1987.
17. R. Sabbah; A. Xu-wu; J. S. Chickos; M. L. Planas Leitão; M. V. Roux; L. A. Torres, Thermochim. Acta, 1999, 331, 93-204.
18. R. Blum, Vitamins. In Ullmann’s Encyclopedia of Industrial Chemistry, 5th ed., Eds.: B. Elvers; S. Hawkins, VCH, Weinheim, 1996. Vol. A27.
19. J. Block, Vitamins. In Kirk-Othmer Encyclopedia of Chemical Technology, 5th ed., Ed.: S. Seidel, Wiley, Hoboken, 1996. Vol. 25.
20. G. A. Goldsmith, J. Am. Med. Assoc., 1965, 194, 167-173. 21. F. Ahmad; A.G. Moat, J. Biol. Chem., 1966, 241, 775-780.
22. J. Hegyi; R. A. Schwartz; V. Hegyi, Int. J. Dermatol., 2004, 43, 1-5.
23. E. L. Jacobson, Linus Pauling Institute - Micronutrient Research for Optimum Health. http://lpi.oregonstate.edu/infocenter/vitamins/niacin/index.html#function (accessed 2011-04-06).
24. W. Soudijn; I. van Wijngaarden; A. P. Ijzerman, Med Res Rev, 2007, 27, 417-433. 25. P. D. Boatman; J. G. Richman; G. Semple, J. Med. Chem., 2008, 51, 7653-7662. 26. L. A. Carlson, J. Intern. Med. , 2005, 258, 94–114.
27. A. Gille; E. T. Bodor; K. Ahmed; S. Offermarms, Ann. Rev. Pharm. Toxic., 2008,
48, 79-106.
28. J. J. Li, Triumph of the Hart. The Story of Statins, Oxford University Press, New York, 2009.
29. T. L. Lemke; D. A. Williams; V. F. Roche; S. W. Zito, Foye's Principles of
Medicinal Chemistry, 6th ed., Lippincott Williams & Wilkins, Baltimore, 2008.
30. S. Tunaru; J. Lättig; J. Kero; G. Krause; S. Offermanns, Mol. Pharm., 2005, 68, 1271-1280.
I n t r o d u c t i o n
| 11
31. H. G. Brittain, Polymorphism in Pharmaceutical Solids. Marcel Dekker, New York, 1999.
32. J. Bernstein, Polymorphism in Molecular Crystals, Oxford University Press, Oxford, 2002.
33. R. Hilfiker, Polymorphism in the Pharmaceutical Industry, Weinheim, 2006. 34. E. M. D. Gonçalves; C. E. S. Bernardes; H. P. Diogo; M. E. Minas da Piedade, J.
Phys. Chem. B, 2010, 114, 5475-5485.
35. J. A. Martinho Simões; M. E. Minas da Piedade, Molecular Energetics, Oxford University Press, New York, 2008.
36. C. E. S. Bernardes; M. F. M. Piedade; M. E. Minas da Piedade, Cryst. Growth
Des., 2008, 8, 2419-2430.
37. P. Vora; D. Menon; M. Samtani; D. Dollimore; K. Alexander, Instr. Sci. Tech., 2001, 29, 231-245.
38. J. Bickerton; G. Pilcher; G. Altakhin, J. Chem. Thermodyn., 1984, 16, 373-378. 39. M. D. M. C. Ribeiro da Silva; J. M. Gonçalves; W. E. Acree Jr., J. Chem.
Thermodyn., 2000, 32, 1071-1073.
40. R. Sabbah; S. Ider, Can. J. Chem., 1999, 77, 249-257.
41. D. Menon; D. Dollimore; K. S. Alexander, Thermochim. Acta, 2002, 392-393, 237-241.
42. R. S. Jessup, J. Res. Nat. Bur. Stand., 1942, 29, 247-270.
43. T. Sato-Toshima; A. Kamaguchi; K. Nishiyama; M. Sakiyama; S. Seki, Bull.
Chem. Soc. Jpn., 1983, 56, 51-54.
44. Y. Y. Di; Q. Shi; Z. C. Tan; L. X. Sun, Acta Chim. Sinica, 2007, 65, 1940-1946. 45. J. W. Mullin, Crystallization, 4th ed., Butterworth-Heinemann, Oxford, 2001. 46. R. J. Davey; N. Blagden; S. Righini; H. Alison; M. J. Quayle; S. Fuller, Cryst.
Growth Design, 2001, 1, 59-65.
47. R. J. Davey; N. Blagden; S. Righini; H. Alison; E. S. Ferrari, J. Phys. Chem. B, 2002, 106, 1954-1959.
48. H. van de Waterbeemd; B. Testa, Drug Bioavailability: Estimation of Solubility,
Permeability, Absorption and Bioavailability. 2nd ed., WILEY-VCH, Weinheim,
CHAPTER
2
A
s mentioned in Chapter 1 the work described in Chapters 36 of this thesis was performed by using a variety of techniques for sample characterization and thermodynamic measurements. The central methods were, however, of thermodynamic nature. The most important of those methods that were not detailed in the following chapters are described here.2.1 The Knudsen Effusion Method
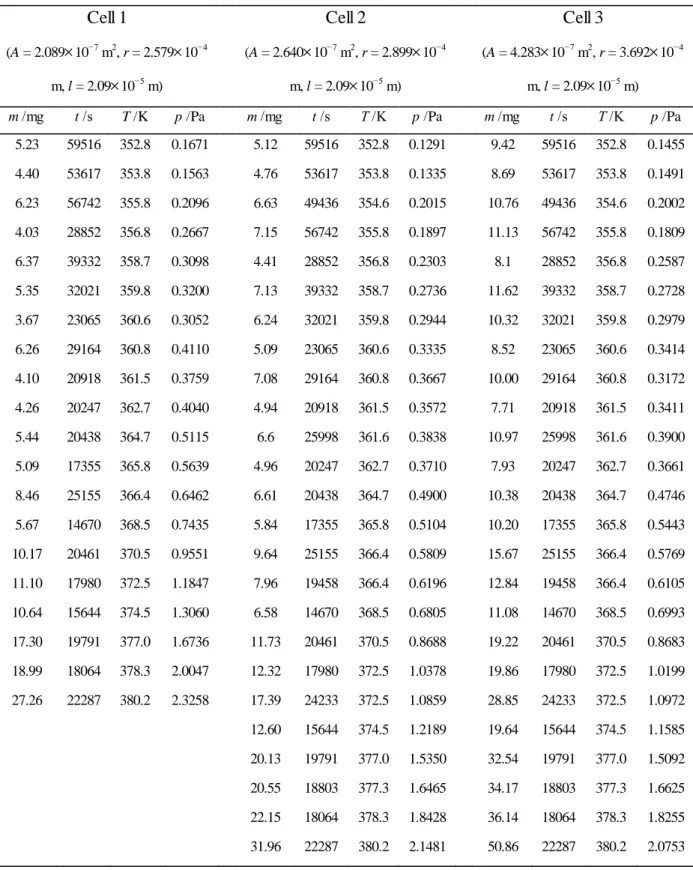
The Knudsen effusion method was used in this work to determine the enthalpy of sublimation of nicotinic acid included in Chapter 3. A simplified scheme of the apparatus, which can work simultaneously with up to three Knudsen cells, is shown in Figure 2.1. Each cell consists of a brass cylindrical container (15 mm internal diameter 15 mm height), 1, closed by a lid, 2, with an effusion hole at the center, 3. The effusion hole was drilled on a 2.09010-5 m thick copper foil (Cu 99%, Goodfellow Metals) soldered to the cell lid. The three cells are accommodated at the bottom of a cylindrical brass block, 4, inside a vacuum chamber (190 mm height 60 mm internal diameter), 5. The vacuum chamber is closed at the top by a circular lid, 6. To ensure a better thermal contact between the cells and the brass block, the cells bottoms were covered with a thin film of grease (Apiezon N. M&I Material LTD). The brass block is surrounded by a tubular furnace, 7, whose temperature is controlled with a precision of ±0.1 K by a Eurotherm 902P thermostatic unit and a K type thermocouple embedded in the block, 4. The equilibrium temperature inside each cell was assumed to be identical to the temperature of the brass block. This temperature was measured with a precision of ±0.1 K with a Tecnisis 100 Ω platinum resistance thermometer, 8 (also embedded in the block), connected in a four wire configuration to a Keithley 2000 multimeter. The multimeter is connected to a
A p p a r a t u s a n d M e t h o d s | 15
computer that collects the temperature continuously with the Measurement and Automation Explorer software from National Instruments. The Tecnisis 100 Ω thermometer was calibrated against a standard platinum resistance thermometer, which had been calibrated at an accredited facility in accordance with the International Temperature Scale ITS90.
The top of the vacuum chamber is connected to a N2 line on the left and to a vacuum line on the right. The pumping system includes an Edwards ES 200 rotary pump, 9, and an Edwards E04 diffusion pump, 11, with a liquid nitrogen trap, 12. Pressure measurements are performed by means of Pirani, 10, and Penning, 13, gauges, respectively. The vacuum chamber, where sublimation occurs, is separated from the pumping system by a second liquid nitrogen trap, 14.
Each of the three cells was loaded with sample to half of its capacity (~500 mg). The samples were weighted with precision of 0.01 mg in a Mettler AT201 balance. The cells were placed inside the vacuum chamber, which was then closed by a lid 6, and the
Figure 2.1. Scheme of the apparatus used for Knudsen effusion method (adapted from reference [1]): 1, Knudsen cell; 2, Knudsen cell lid; 3, effusion hole; 4, brass block; 5, vacuum chamber; 6, vacuum chamber lid; 7, tubular furnace; 8, platinum resistance thermometer; 9, Edwards ES 200 rotary pump; 10, Pirani gauge; 11, Edwards E04 diffusion pump; 12, liquid nitrogen trap; 13, Penning gauge; 14, liquid nitrogen trap.
system was allowed to thermally equilibrate, under N2 flow, during approximately 4050 min. The N2 inlet valve was closed, and evacuation was started, first using the rotary pump and then the diffusion pump. A pressure of 110-3 Pa was normally attained at the measuring site in ~3 min, with 810-5 Pa being reached in ~15 min. The time counting was started when the vacuum chamber was connected to the rotary pump and, depending on the temperature, the experiment normally took from 416 h. At the end of each run the connections to the pumping system were closed and N2 introduced in the system. The vacuum chamber was opened and the cells were allowed to cool to room temperature inside a desiccator, over silica gel. The cells were weighed once more using the Mettler AT201 balance and the mass of the sublimed substance determined from the difference in cell mass before and after the experiment.
The model used in the determination of the vapor pressure of a substance by the Knudsen effusion method relies on the following assumptions: (i) the gas is ideal; (ii) no decomposition of the compound or molecular aggregation (e.g. dimerization) in the vapor phase can occur during sublimation; (iii) the cells and the sample should be at the same constant temperature; (iv) the sublimation rate must be sufficiently larger than the effusion rate and the hole area sufficiently small to ensure that the number of molecules escaping from the cell is negligible and the pressure inside is as close as possible to the equilibrium vapor pressure of the substance; (v) the external pressure can, to a good approximation, be considered zero (pext = 0), thus ensuring that no molecules return to the cell after they have passed through the hole; (vi) the hole can be considered of zero thickness so that the number of molecules that collide with its inside wall and return to the cell is negligible; (vii) the hole diameter must be much smaller than the mean free path, , of the molecules (i.e. the average distance a molecule travels between collisions with other gas molecules), to ensure that intermolecular collisions can be ignored and effusion through the hole occurs by freemolecular flow (i.e. a flow independent of the viscosity of the gas); and (viii) mass transport through the orifice should occur only in the vapor phase.
If all these conditions are valid, the vapor pressure of a substance can be calculated from: 1 2 2 m RT p At M (2.1)
A p p a r a t u s a n d M e t h o d s | 17
where T is the temperature of the sample, t is the duration of the experiment, m is the mass of sublimed substance, A is the area of the effusion hole, M is the molar mass of the compound, and R is the gas constant.
Some of the above conditions can, to a good approximation, be experimentally achieved by a suitable design of the apparatus. For example, the proviso pext = 0 is obviously impossible to realize in practice, but experience indicates that it is usually sufficient that pext < 10-4 Pa [2, 3], a pressure which can be attained with a good pumping system. Other conditions are unattainable and in these cases, when possible, correction terms are introduced into equation (2.1) to account for the resulting deviations. The most common corrections correspond to the socalled Clausing (Kc) and Hiby and Pahl (Khp) factors [4, 5]: 1 2 2 1 c hp m RT p At M K K (2.2)
Clausing’s factor is related to the fact that holes of infinitely small thickness are impossible to obtain in practice. Hiby and Pahl’s factor corrects for deviations from free molecular flow, which strictly holds when r/ 0 [1]. The correction factors, Kc and Khp can be calculated from [4-7]: 8 8 3 c r K r l (2.3) 0.48 1 2 hp r K (2.4)
where r and l are the effusion cell hole radius and thickness, respectively. The mean free path , can be calculated from [8]:
2 2 kT p (2.5)
where is the collision diameter (normally estimated from the molecular structure, see Chapter 3), k is the Boltzmann constant, and p is the vapor pressure. Because is pressure dependent, an iterative method needs to be used to compute the vapor pressure of a compound from equation (2.2). First p is calculated by using equation (2.1) that does not contain the Kc and Khp factors. The obtained result, p1, is subsequently used to derive a
first approximation of 1 from equation 2.5. The value of 1 is substituted into equation (2.4) to derive a first approximation of Khp, which then leads to p2 using equation (2.2). In this thesis, the iteration was continued until the difference between two successive values of p was less than 10-8 Pa.
The temperature dependence of the vapor pressures of the solid lead to the corresponding molar enthalpy of sublimation by means of the relationship [8]:
m
ln
H R d p
d T
sub = (1/ ) (2.6)
where p is the vapor pressure, T is the temperature, and R is the gas constant. Equation (2.6) assumes that the gaseous phase is an ideal gas and that the molar volume of the solid phase is negligible compared with the volume of the gaseous phase. In general, the temperature range of the experiments does not exceed 2030 K. In this case subHm is approximately independent of the temperature and, usually, good linear relationships are observed by plotting lnp against 1/T. The enthalpy of sublimation is then derived by fitting the experimental (p,T) data to the ClausiusClapeyron equation [8, 9]:
lnp a b
T
(2.7)
where a and b are constants. It can be concluded from equations (2.6) and (2.7) that:
subHm Ra
A p p a r a t u s a n d M e t h o d s | 19
It is normal practice to refer the obtained subHm value to the mean temperature,
Tm, of the temperature interval covered by the experiments. The relationship between this value, which refers to the saturation pressure at Tm, and the corresponding standard state quantity defined by:
Solid (p = 105 Pa, T) Ideal Gas (p = 105 Pa, T) (2.9) can be deduced from the thermodynamic cycle in Scheme 2.1. Application of Hess's law to that cycle leads to [8]:
o subHm subHm H1 H2 (2.10) where: 5 1 10 p p V H T V dp T
(2.11) 5 10 2 p p V H T V dp T
(2.12)and V represents the molar volume of the solid in equation (2.11) and of the gas in equation
1 H H2 o m subH m subH
Solid (p = 105 Pa, T ) Ideal Gas (p = 105 Pa, T )
Solid (p, T) Ideal Gas (p, T)
2.12. In general the terms H1 and H2 can, to a very good approximation, be neglected, leading to subHmo(Tm) subHm(Tm) [1, 9].
Enthalpies of sublimation are normally reported at the reference temperature of 298.15 K. The relationship between subHmo(Tm) and subHmo(298.15 K) is given by:
m 298.15 o o o o sub m(298.15 K) sub m( m) Cp,m(g) Cp,m(cr) T H H T dT
(2.13)where Cop,m(cr) and Cop,m(g) are the standard molar heat capacities of the solid and the
gaseous species, respectively. The temperature dependence of the standard heat capacities can be expressed in the form of a polynomial equation or (when such equations are not available) by the approximation Cop,m(g) Cop,m(cr) = constant.
2.2 Calvet Microcalorimetry
Calvet microcalorimetry was also used to determine the enthalpy of sublimation of nicotinic acid as described in Chapter 3 [10]. The apparatus, which is illustrated in Figure 2.2 [11, 12], is based on a DAM Calvet microcalorimeter, that can be used from room temperature to 473 K. This setup includes four wells (1, 1’ and 2, 2’), each containing a microcalorimetric element, 3, at the bottom. The microcalorimetric elements operate in pairs, so that two simultaneous differential measurements can, in principle, be made. Only one of these pairs was used in this thesis. The microcalorimetric elements are surrounded by a large furnace, 4, whose temperature is controlled with a precision of ±0.1 K with a Eurotherm 2404 PID unit, and measured with a precision of ±0.1 K by a Tecnisis 100 platinum resistance thermometer inserted into one of the calorimetric elements that is not used during the measurements. The differential heat flow across the thermocouples of the microcalorimetric elements is measured as a potential difference by using a HewlettPackard 34420A nanovoltmeter. Two identical sublimation cells, 5, and, 5’, are
A p p a r a t u s a n d M e t h o d s | 21
inserted into calorimetric wells, so that they are enfolded by the measuring elements at the bottom. One is used for measurement and the other as reference. Each cell assembly consists of several parts. A brass cylinder, 6, closed at the bottom (17 mm external diameter 100 mm height) is screwed at the base of a Teflon tube (17 mm external diameter 600 mm height), 7. A Manganin wire resistance of 200 , 8, is wound around the brass piece, 9, which is adjusted at the bottom of the brass cylinder, 6. This resistance
4 3 12 5 7 11 15 17 13 12 7 14 16 10 7 6 9
View from top
1 1' 2 2' 5 5' 8 9 11 17 10
Figure 2.2. Scheme of the dropsublimation Calvet microcalorimeter apparatus (based on references [11, 12]): 1, and 1’, wells; 2, and 2’, wells; 3, microcalorimetric element; 4, furnace; 5, and 5’, sublimation cells; 6, brass cylinder; 7, Teflon tube; 8, Manganin wire resistance; 9, brass piece; 10, glass cell; 11, J. Young spherical glass joint; 12, furnace; 13, sample; 14, platinum resistance sensor (Labfacility, 1/10); 15, movable pin; 16, guide funnel; 17, vacuum/inert gas (N2) inlet.
is used for calibration of the apparatus by Joule effect. A glass cell (10 mm external diameter 800 mm height), 10, is inserted into the Teflon tube and brass cylinder. The bottom of the glass cell fits tightly into the brass cylinder and sits at the top of the piece, 9, supporting the Manganin resistance. The thermal contact between the glass cell resistance and brass cylinder is improved by filling the interspace with silicon paste (Sidevan). The top of the glass cell consists of a J. Young greaseless spherical glass joint, 11, that can be adjusted to a glass lid (not shown in the illustration) through a viton Oring. The lid can be removed in order to drop the sample into the calorimetric cell. The furnace, 12, initially containing the sample, 13, is positioned above the inlet of the glass cell, 10, and the sample is placed into the central well of the furnace which is closed at the top by a small lid supporting a miniature platinum resistance sensor (Labfacility, 1/10), 14, and at the bottom by a movable pin, 15. Pulling this pin back allows the sample to be dropped through the guide funnel, 16, into the calorimeter. After dropping, the furnace can be displaced from above inlet by rotating the axial support. The cell can then be closed and, if necessary, evacuated through inlet, 17, which is connected to a vacuum/inert gas (N2) line.
The pumping system includes an Alcatel Adixen Pascal series 2005SD rotary pump and an Edwards E02 oil diffusion pump with a liquid nitrogen trap. A second liquid nitrogen trap separates the vacuum system from the sublimation cell. The ultimate vacuum, measured between the two traps, when pumping the glass cells, is 410-3 Pa. Only the rotary pump, which can reach an ultimate pressure of ~0.13 Pa, was necessary to perform the experiments described in this thesis.
The temperature sensors used to measure the temperature of the sample in the dropping furnace, 12, and in the calorimetric cell are both connected in a fourwire configuration to a Hewlett Packard 34401A multimeter. The two sensors were calibrated against a standard platinum resistance thermometer, which in turn had been calibrated at an accredited facility in accordance with the International Temperature Scale ITS90. The data acquisition and the electrical calibration are computer controlled by the CBCAL 1.0 program [13].
The electrical calibration circuit consists of the Manganin resistance referred above, connected in a fourwire configuration to a Hewlett Packard 6611C DC power supply and a Hewlett Packard 34401A multimeter. The power supply is used to supply and measure
A p p a r a t u s a n d M e t h o d s | 23
the current intensity across the Manganin resistance and the corresponding potential drop is measured with the multimeter.
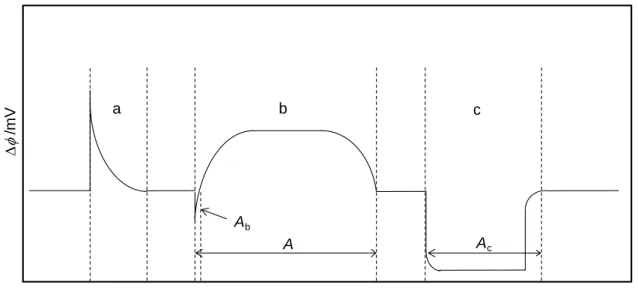
In a typical experiment, the sample was placed into a small glass capillary and weighed with a precision of ±1 µg in a Mettler M5 microbalance. The capillary was equilibrated for ~15 min at 298 K, inside the furnace, 12, and subsequently dropped into the calorimeter under N2 atmosphere. Figure 2.3 illustrates the sequence of measuring curves corresponding to a sublimation experiment followed by an electrical calibration. After the sample dropping an endothermic peak, a, due to the heating of the sample from 298 K to the calorimeter temperature T was first observed. When the signal returned to the baseline the sample and reference cells were simultaneously evacuated to ~0.13 Pa and the measuring curve, b, associated with the sublimation of the compound was acquired. The sublimation experiment was followed by an electrical calibration, c, where a known amount of heat was dissipated inside the cell by Joule effect. This was achieved by passing a current of intensity I through the Manganin wire resistance, 8, during a preselected time t, as a result of the application of a potential difference V, to the resistance terminals. The calibration constant, , was obtained from:
time/s /m V Ab A Ac a b c
Figure 2.3. Scheme illustrating the output of the microcalorimetric elements, , as a function of time during a typical dropsublimation Calvet microcalorimetry experiment: a, sample drop and equilibration period; b, sublimation period; c, calibration period.
c A VIt
(2.14)
where Ac represents the area of the corresponding measuring curve.
The enthalpy of sublimation, subHm( )T , at the temperature, T, of the experiment, was calculated from:
m - b M A A H T m sub ( ) = ( ) (2.15)
where m and M are the mass and the molar mass of the sample, respectively, represents the calibration constant, A is the area of the experimental curve, and Ab is the area of the pumping background contribution. The value of Ab was determined from independent runs where only N2 was pumped out of the calorimetric cells.
The correction of subHm( )T to standard reference conditions was performed as described in Section 2.1 for the Knudsen effusion method.
2.3 Differential Scanning Calorimetry
Differential scanning calorimetry (DSC) was used in Chapters 3 and 4 of this thesis (i) to characterize different nicotinic acid samples in terms of phase purity, and to, (ii) determine the temperature, and the enthalpy or heat capacity changes of thermal events, such as solidsolid phase transitions and fusion.
The measurements were performed on a DSC 7 from PerkinElmer (see Figure 2.4). The calorimeter, 1, consists of two platinumiridium independent furnaces, with one holder each, positioned within an aluminum block. One of the holders supports the sample, 2, which is placed inside an aluminum crucible; the second holder, 3, sustains an empty aluminum crucible and serves as reference. The calorimeter is controlled by a TAC 7/DX thermal analysis instrument controller, 4, that, in turn, is controlled by the Pyris
A p p a r a t u s a n d M e t h o d s | 25
Software for Windows application from PerkinElmer, which is also used to analyze the results.
The instrument is based on the power compensation principle [14, 15]. The temperatures of the sample and reference furnaces are changed by of two independent resistance heaters and controlled by two independent sensors. The calorimeter contains two control circuits. One circuit controls the average temperature of the sample and the reference holders respectively; the other allows a different power to be supplied to each holder. This differential power supply is proportional to the difference in temperature between the sample and the reference detected by the first circuit. The ultimate purpose is to maintain this difference as small as possible, while continuously changing the sample and reference temperature at the same constant rate. The measuring signal of the calorimeter is an electric voltage proportional to the differential power supplied from the second circuit. As this signal is proportional to the differential temperature, the output signal is expressed as a heat flow rate, proportional to the latter.
When, for example, while continuously heating the system at a constant rate, an endothermic event (e. g. fusion) occurs, the temperature of the sample will tend to lag back from that of the reference. A difference between the temperature of the sample and the reference will then be detected by the first circuit. As a consequence the second circuit will supply an electrical voltage to the sample furnace, proportional to the differential temperature, resulting in a heat flow rate difference between the sample and the reference
1
4
2 3
4
Figure 2.4. Images of the DSC 7 calorimeter from PerkinElmer used in this thesis: 1, calorimetric unit; 2, platinumiridium sample furnace; 3, platinumiridium reference furnace; 4, TAC 7/DX thermal analysis instrument controller.
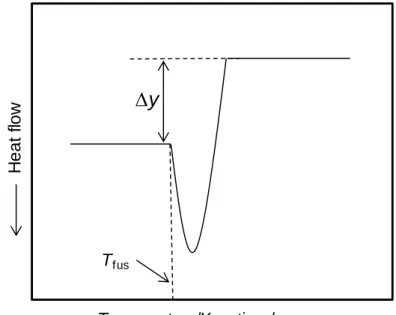
which will change throughout the fusion process. This difference will be detected as a peak in the measuring curve (Figure 2.5), whose onset gives the temperature of fusion of the sample and the area is proportional to the corresponding enthalpy of fusion. The temperature scale and the energy equivalent of the calorimeter are normally determined through calibration, based on the fusion of standard substances [16]. In this thesis indium (PerkinElmer; mass fraction 0.99999; Tfus = 429.75 K, fusho = 28.45 Jg-1) was always used for this purpose.
The baseline shift y (Figure 2.5) observed in a measuring curve upon fusion of a sample can be related to the difference in heat capacity between the solid and liquid phases at the temperature of fusion Tfus, fusCp,m(Tfus) by [15]:
fus ,m fus y ( ) p M C T m (2.16)
where M and m are the molar mass and the mass of the compound, respectively, and is the heating rate. This equation was used in the present thesis to obtain the fusCp,m(Tfus)
data necessary for estimate the activity coefficients of nicotinic acid included in Chapter 4.
H e a t flo w Temperature/K or time/s
y
TfusFigure 2.5. Scheme representing the baseline shifts upon the fusion on a DSC thermogram.
A p p a r a t u s a n d M e t h o d s | 27
2.4 Isoperibol Reaction
Solution Calorimetry
Isoperibol reactionsolution calorimetry was used to determine the enthalpies of solution of nicotinic acid in DMSO and water discussed in Chapters 4 and 6 respectively.
All measurements were carried out with a Thermometric Precision Solution calorimeter (Model 2225) adapted to a Thermal Activity Monitor thermostatic water jacket (TAM 2227), 1, (see Figure 2.6). The jacket temperature was maintained at 298 K with a stability of ±0.2 mK. The calorimetric cell consists of a 100 cm3 Pyrex glass vessel, 2, with two thin wells descending from the top in opposite positions. One of the wells accommodates a thermistor, 3, with a nominal resistance of 30 kΩ at 298.15 K, which is used for temperature measurement. The other contains a 50 Ω resistance, 4, for electrical calibration. The cell can be adapted to a head supporting the stirring system. The stirrer, 5, which is also the ampule holder, can be pushed down, without stopping the rotation, to break a cylindrical glass ampule, 6, containing the sample, against a ceramic tip, 7, mounted on a pin, at the bottom of the calorimetric cell. The internal volume of the glass
Figure 2.6. Image of the Isoperibol Thermometric Precision Solution calorimeter used: 1, Thermal Activity Monitor thermostatic water jacket; 2, Pyrex glass vessel; 3, thermistor; 4, electrical resistance; 5, stirrer/holder; 6, glass ampule; 7, pin with a ceramic tip.
ampules was 1 cm3.
In a typical experiment, the glass ampule was loaded with 50 mg of sample, and weighted with a precision of ±0.01 mg with a Mettler Toledo XS205 balance. The short ampule neck was closed with a silicone rubber stopper and the sealing was reinforced from the outside with paraffin wax melted from a candle. The ampule was adjusted to the holder in the calorimeter head which was then attached to the Pyrex glass vessel by means of a locking nut. The vessel was filled with 100 cm3 of solvent (DMSO or water). The calorimetric unit (vessel and head) was inserted in the thermostatic jacket and stirring, at a rate of 500 rpm, was switched on. By using the program Sol Cal 3.2 from Thermometric, the acquisition of temperature, T, vs. time, t, was started until a stable baseline was achieved which indicated that the heat transfer between the system and the surroundings followed Newton’s law (exponential T vs. t variation) [15]. The experiment started when the temperature of the vessel was ~25 mK below 298 K. A scheme of a typical experimental Tt profile is shown in Figure 2.7. Each calorimetric run involved three
steps: the initial electrical calibration, b, the dissolution process, d, which in the present work was always endothermic, and the final electrical calibration, f. Before and after each of these steps, a baseline of 300 s duration, corresponding to, a, c, e and g, in Figure 2.7, was recorded. As mentioned above, the solution process was started by pushing down the entire ampule holder/stirring system and breaking the glass ampule against the ceramic tip mounted at the bottom of the calorimetric cell.
In each calibration a current of intensity I passed through the 50 resistance as a result of the application of a potential difference V during the time period t. This led to the dissipation of an amount of heat Q = VIt in the calorimetric vessel causing the observed temperature change. The intensity, I, was determined by measuring the voltage across a standard 20 resistance mounted in series with the calibration heater. Typically the electrical power in the calibrations was P = 500 mW and the heat dissipated Q of 1015 J.
The calibration constant,, was obtained from:
ad
Q T
![Figure 1.1. Mechanism (adapted from reference [21]) of the biosynthesis of nicotinic acid on the liver](https://thumb-eu.123doks.com/thumbv2/123dok_br/15622387.1055116/20.893.122.756.784.1094/figure-mechanism-adapted-reference-biosynthesis-nicotinic-acid-liver.webp)
![Figure 2.2. Scheme of the dropsublimation Calvet microcalorimeter apparatus (based on references [11, 12]): 1, and 1’, wells; 2, and 2’, wells; 3, microcalorimetric element;](https://thumb-eu.123doks.com/thumbv2/123dok_br/15622387.1055116/37.893.166.740.395.929/figure-scheme-sublimation-calvet-microcalorimeter-apparatus-references-microcalorimetric.webp)