A CALORIMETRIC STUDY OF EGG WHITE PROTEINS
M. Ferreira 1, C. Hofet a and A. Raemy 2
1Escola Superior de Biotecnologia, R. Dr. Ant6nio Bernardino de Almeida, 4200 Porto, Portugal 2Nestl6 Research Center, Vers-chez-les-Blanc, EO. Box 44, CH-100 Lausanne 26, Switzerland
Abstract
Egg white is of great interest for many culinary and industrial applications. Egg white is used for coating, gluing, thickening and so on in pasta, desserts, etc. There is thus a great interest from the industrial point of view to better know this raw material, used in very large amounts in the dessert production for example, and to obtain egg white fractions with different functional properties.
Various egg white fractions prepared by selected procedures were analyzed by differential scanning calorimetry (DSC). The products resulting from a given fractionation procedure can thus be described by the thermal denaturation parameters (temperatures and enthalpies) of the egg white proteins.
This work demonstrates the interest of the DSC technique and proves that the fractionation procedures selected here give the expected protein fractions.
Keywords: calorimetry, DSC, egg white, egg white fractions, fractionation, thermoph-pr
Introduction
The technique of DSC has already proven useful to study thermal denaturation of egg white by Donovan
et al.
[1] and, to examine the conversion of ovalbumin into S-ovalbumin [2]. This technique enables in particular to determine an enthalpy of denaturation (AHd) for egg white and for some of its components, thus to give quan- titative information.In the present study we examined the influence of different fractionation proce- dures on typical DSC curves of egg white and egg white fractions, the enthalpy of denaturation being taken as the main criterion. We hoped that DSC could help to characterize the products prepared according to some fractionation procedures of interest.
Experimental
Samples (Products and preparation procedures)
Ovalbumin fraction was prepared from fresh egg white by the well known am- monium sulfate procedure [3]. Lysozyme depleted egg white was obtained by direct crystallization of lysozyme from fresh egg white by addition of 5 % NaC1 at
pH 9.5,
as described in literature [4]. Ovomucin depleted egg white was prepared by dilu- tion of fresh egg white with water (1:3) and adjustment of thepH
to 6.5, according to a described method [5]. These products have been compared with fresh egg0368--4466/97/$ 5. O0
9 1997Akad~miai Kiad6, Budapest
John Wiley & Sons Limited Chichester
684 FERREIRA et al.: EGG WHITE PROTEINS
white (unpasteurized). All products have been freeze-dried and reconstituted as mentioned below. The samples were analyzed in aqueous solution at 10 % total pro-
tein (TP) and at pH 7.
In addition, some commercially pure egg white proteins, conalbumin, lysozyme as well as ovalbumin (Sigma Chemical Co. Buchs, Switzerland) were analyzed at
10% TP and atpH 7.
Differential scanning calorimetry (DSC)
The DSC curves were obtained with a Setaram Micro-DSC III calorimeter used
in scanning mode. Temperature was scanned from ambient to 95~ generally at
1 ~ min -1. Closed cells were used; reference material was water. Some second runs were also performed; no reversible phenomena were observed. Sample weights were approximately 400 mg. Since this rather large sample amount is not favorable from the view point of peak resolution, some measurements were in ad- dition performed at a lower heating rate (0.3~ minq). The observed improve- ments were however not really significant.
R e s u l t s a n d d i s c u s s i o n
General comments on the DSC measurements
The observed endothermic phenomena correspond typically to protein denatura- tion. DSC curve of fresh egg white shows 4 main peaks (Fig. 1): the first at 60~
l . . . 1 . . . I ... i , ', I I I I 0 . 5 ... J ... a ... L ... L _ . 5 4 . 9 o c ... L ... ~ ... ! I I I I I I J I i ~ I I I I I t J o
0
...
~
...
n-93,4
C
- ~ J I h I I I I I i I IE
n
d
o
~
t T = i t J t - 0 5 . . . J ~ . . . 11 . . . ~l" . . . J r - . . . d l . . . Ii ! I l t ! I I I I I I I i t i I i I M I I i I i I I ::= -I i i i i i i I = . . . 1 . . . 1 . . . t . . . r . . . 1 . . . ) . . . . 1 . . . 3 ~.i I I I I I I I I I 9 I I I Ii! i,iiiijiiiiii!iiiiiiiiiiiiiiiiiiiiiiiiiiiii!,,
,,
,,
,,
,,
,, il/iiiiill I
,,, ,
. . . _1 . . . 1 . . . L . . . I . . . A . . . l . . . , ) - J - 1 . 5 I I I t t I - - I . . . I I I I I I I I I ) I l I I I I I i i i I i I I ] i i i I I I J .~ I I I I I I i I I " I . . . ~ . . . ) . . . ) - . . . i - . . . - # . . . I - ... ) - ... ~ . . . I I I I I I I I I t I I I I I I I I l I I I i I l I I I I I I I I I I I Ins . 9 i , i i i - 2 5 . . .Scan . . .r. . . .~. . . ~ - t . . . -I J . . . . . . . J S a m p l e w e i g h t : 0 . 4 0 1 3 g ), - 3 I J I t Io 2o 30 40 so 6o 7o so 9o Ioo T e m p e r a t u r e [oc|F i g 1 DSC curve o f fresh egg white (first minus second run)
F E R R E I R A e t a l . : E G G W I - I / T E P R O T E I N S 6 8 5 0 E -2 ,,,s r,,. = -4 -5 l 0 . . . . 1- . . . . T . . . . "T . . . 1 . . . . . . .
t
.... -'2X E n d o I I , D e n a t u r a t i o n E n t h a l p y : - 1 . 2 6 J / g I I . . . . 1- . . . . T . . . . "1" . . . 1 - - ' I I l I I n s t r u m e n t : M i c r o D S C III S e t a r a m I I S c a n rate : l ' C / r a i n - -1 - - - S a m p l e w e i g h t : 0 . 4 0 7 2 g I i I - I 1 2 0 3 0 4 0 5 0 6 0 - 2 j ~ r 7 1 . . . r" . . . . r . . . . 1 k/J,/-, I~.o i I 1 I " - - ~ , . - - ! L - - - - , r - - I J I ' ' " ~ - ' I I - - - I - . . . . i- . . . . "I I I I I I I . . . . V . . . . T . . . . -i I I I - - L . . . . . L . . . . . L . . . . J I I I I I I I I - - - r - I - . . . . -I - ~ - I I I 7 0 8 0 9 0 100 T e m p e r a t u r e l ~ 1 0 E H - 3 -5 -6 . . . r . . . 1- . . . . T . . . . T . . . . -r . . . . - / . . . . - I - " 8 5 . 8 o c --1 I I I - ~ - - - r r" . . . . 7" . . . . T - 5 7 . 3 ~i
I I I I J - ~ . ~ F . . . . T . . . . T . . . . 7 - - ~- - - - D e n a t u r a t i o n E n t h a l p y : - 2 . 8 2 J i g I I i I . . . . r . . . T " . . . . "1" . . . . T . . . i i I I I n s t r u m e n t : M i c r o D S C I I I S e t a r a m . . . . "1" . . . S c a n rate : lOC/min I S a m p l e w e i g h t : 0 . 4 0 7 7 g . . . . T . . . . I I I I I '" I I I t 10 2 0 3 0 4 0 5 0 6 0 70 8 0 9 0 / / / . . . . li / -- , I~ / I . . . . "r- "t - ~ " . . . . - I I I . . . [ I . . . I i . . . I l . . . I I I I i t o o T e m p e r a t u r e [~ E g = C 1 0,5 0 -0.5 - I . . . -1.5 -2 - 2 . 5 -3 I0 . . . . - - - . . - . - - , , - - - , - . - - - , . . . . i- i r- g-4-$ T O - r I I - - I - ~ ; o p . . . .l I " F # i i " - F ~ Z . l t . - - , ~ - - , . . . . i p " , - I - - - - i - . . . . L . . . . I . _ i - . . . . i-- . . . . i . _ _ _ ' ~ _ i - _ - - - - L # . . . . t V E n d o I I I I I I " ~ I l I . . . ~- . . . . ~ - . . . . ~ . . . . ~ - . . . . ~ - . . . . ~ - . . . . ~ . . . . t - . . . . ' i ' . ' ' ' I I I ~ I I l . . . i - - - - D e n a t u r a t i o n E n t h a l p y : - 1 , 7 9 J/g " - - I - . . . . ~ - - - t - . . . . I i , , , ' . . . . L - ~ _ L X - - J L - - ' . . . Y . . . . Y . . . Y - - - Y . . . . I .. . . . i . . . . 7 " ~ - - 71 . . . i Instrument : M i c r o DSC Ill S e t a t a m _ _ _ L. . . . . 1- . . . . L . . . . L _X~. _ ~. L. . . . . I S c a n rate : I ' C / r a i n I I I I \ I I I9 -- -- --I-- . . . . I'- . . . . I-- . . . . I-- -- -- I-" . . . . I
Samp,ewe,ght:04007 , , . . . . ,
I I I I I I I I I
2 0 3 0 4 0 5 0 6 0 7 0 8 0 9 0 100
T e m p e r a t u r e [~
Fig. 2 D S C c u r v e s o f p u r e egg w h i t e p r o t e i n s (first m i n u s s e c o n d run): A ) c o n a l b u m i n , B) l y s o z y m e a n d C) o v a l b u m i n
6 8 6 F E R R E I R A e t a l . : E G G W H I T E P R O T E I N S
(denaturation peak temperature) due to conalbumin denaturation, the second at 67~ due to lysozyme denaturation and a double peak at 78 and 82~ due to oval- bumin denaturation and to the more heat stable form of ovalbumin called S-ovalbu- min. The curves (Fig. 2) obtained with pure commercial proteins confirm this in- terpretation.
These results and the proposed interpretation are in agreement with literature in- formation [1, 2, 6]. For other egg white proteins, as globulines and ovomucoid, the thermal transition appears to coincide roughly with the ovalbumin denaturation peak, therefore giving no distinct calorimetric signal. For ovomucin see below.
Fractionation procedures
Ovalbumin, the major egg white protein may be reasonably well separated from lysozyme and conalbumin by ammonium sulfate fractionation: the only denatura- tion peaks observed are those corresponding to ovalbumin and S-ovalbumin (Fig. 3).
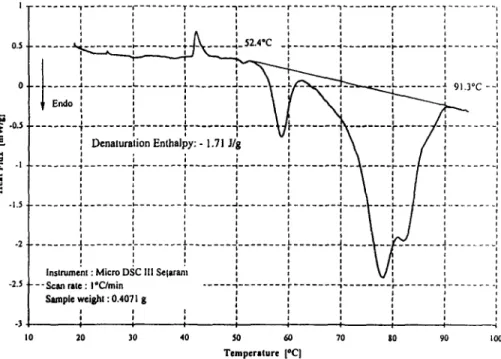
The DSC curve of lysozyme depleted egg white (Fig. 4) shows that the depletion method used here was as well successful. The lysozyme peak is not observed. A slight shift to lower temperatures of temperature onset (T onset) of the conalbumin peak occurred.
In the DSC curve of ovomucin depleted egg white (Fig. 5) the four main peaks corresponding to fresh egg white proteins are present and no apparent changes oc- curred in the denaturation temperatures. A slight shift to lower temperatures of T
~- 0.5 E - I . 5 0.5 ~-- -3 4-- 10 Endo -2.5 I I 54.9~ i i 19~.9oc
tJ
D e n a t u r a t i o n E n t h a l p y : - 1 . 8 2 J / g i i i I 1 . . . " 1 . . . r . . . - I . . . T . . . t - . . . 1 .. ... ... I ,, . . . . t . . . L . . . J . . . , t . . . L . . . J . .. . .. . .. .. ,,Instrument : Mic ro DSC 11[ Setaram
Scan rate : I ~ . . . t . . . r- . . . 1 . . . S a m p l e weight : 0 . 4 1 5 2 g
20 30 40 50 60 70 80
T e m p e r a t u r e [~
Fig. 3 DSC curve of the ovalbumin fraction (first minus second run)
90 10o
F E R R E I R A et al.: E G G W H I T E P R O T E I N S 6 8 7 0.5 0 . . M - 1 , - I , 5 - - 2 - -2,5 - -3 I0 I I I t I I I i I ' "2 4"C ' ' . . . I - . . . § . . . . - 4 - d 9 - I - . . . . ~ . . . ~ . . . I I I I I I I I I I I I I I I | I | I I i I I I I I I I I I I I i 1 . . . l ~ . . . ~ i.. . . i i L . . . i .J .l . .. . .t . . . L . . . .t, 91.3 C 1 ~ --1 I I I I t I I I 1 I I i I I I I l I . . . " I . . . l - . . . T . . . " 1 . . . " t . . . I I ; I I I I I , . , I I I I I I I I I I I I . . . - I . . . I - . . . 1" . . . 1 . . . r . . . " 1 . . . - r . . . I I I I I I I I , I I I I I I I q I 1 I I I I I I I I I I I I I i I I I I I I I I . . . . I . . . I - . . . J. . . . . . I . . . I- . . . , ~ . . . .1 . . . i o I ~ I I I , I I I i I I I i i I i i 1 I I i i I I I I I I I I I I I I I I I I
!iiiii!iiiiiiiii!!!i(i
i:iiiiiiiiiiii:!iiiiiiifii ii:i:
. . . .. . . / I I I I I - - I ~ l
I I 0 0 0 I I I
l i I I I I i i
9 . " ' l I I i i
Instrument : Micro D S C III Selaram ~ , , , ,
9 I I I I " - " ~ r f i l e : I a C / r u l B . . . - I . . . r . . . n . . . ~ . . . 1 . . . I Sample weight : 0.4071 g , ! I I I I I I 2 0 3 0 4 0 5 0 6 0 7 0 $ 0 9 0 1 0 0 Teruperature l ~
Fig. 4 DSC curve of lysozyme depleted egg white (first minus second run)
onset of the conalbumin peak occurred also here. Ovomucin does not undergo a
thermal transition as it exists in a random coil configuration in the raw egg white
[6]. Ovomucin shows no peak in the DSC curve and does not contribute to the area under the DSC curve of egg white. During the ovomucin precipitation procedure, a coprecipitation of the lysozyme-ovomucin complex may occur. This may be the rea- son for the slight change in the shape of the lysozyme peak.
Complementary techniques
These observations were in agreement with sodium dodecyl sulfate-polyacryl- amide gel electrophoresis (SDS-PAGE) and reverse-phase HPLC (RP-HPLC) re- suits (data not shown here). SDS-PAGE and RP-HPLC analysis of the ovalbumin fraction show a slight contamination with conalbumin and lysozyme. In the lysozyme depleted egg white no traces of lysozyme could by found by SDS-PAGE and only a small trace was detected by RP-HPLC. Ovomucin depleted egg white was just slightly reduced in lysozyme content, as observed by both techniques. Discussion of the DSC results
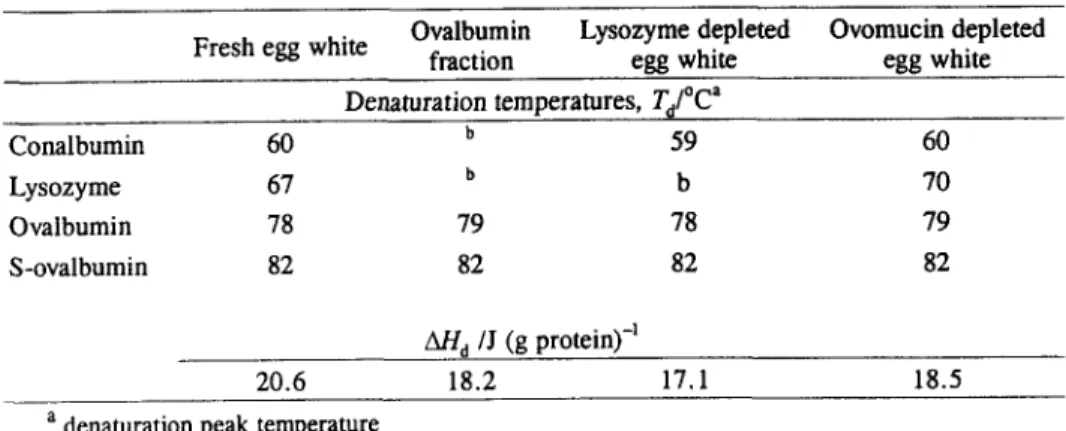
Denaturation temperatures and enthalpies of egg white and egg white fractions are summarized in Table 1. Table 2 shows the results for the commercially pure egg white proteins. Concerning the errors, a systematic analysis for fresh egg white has
688 FERREIRA et al.: E G G W H I T E P R O T E I N S I . . . I" . . . I - . . . - I . . . F" . . . 0 . 5 0
~
- 0 . 5 _E - I . 5 -2 - 2 . 5 i i i i i i i i i i i i . . . ~. . . .4 . . . ..4 . . . ~ . . . ~- . . . 4 . . . -4 . . . ~ . . . i i i I t I i i:
i
[
i]
I i930~
i i i i i i . . . I . . . J . . . _ I . . . L . . . J I I I I I I I I I I I E n d i i i i i I i i i i i i i i i. . . 1" ii . . . D ~ 2 1 u 3 a | ~o-n- 1i. . . , En~![;yl ~ q "1.1 . . . i ~ - ; i ~ '1 r- . . . r ii . . . "Iii . . . It" i . . . 11
I I I I I i i t I i i I I i I i i I I I I i I i i I I I I I i i i i I I I i i i i I i I i i i
. . . I" . . . "I . . . I ... F ... T . . . "I ......... i- . . . I
i i i i i I i i
i! iiiii!iiiiiii iiiiiii i i i
i , i t i i i i i , i i l i I i i , i i t i i i i i I i I i i . . . ~- . . . -t . . . .-i . . . i- . . . ,r . . . .-i . . . ~ . . . t i i i i i i i i i i i i i i i i i i i f i i i i i i i i i I i i [ n s l r u " I I i I I . . . ~ _ L . . . . L . . . d . . . L. . . iScan rale : IOC/min ~ '~
S a m p l e w e i g h t : 0 . 4 0 5 7 g
i
i
i
I 0 2 0 3 0 4 0 5 0 6 0 7 0 g 0 9 0 1 0 0
T e m p e r a t u r e [ * C l
Fig. 5 DSC curve of ovomucin depleted egg white (first minus second run)
shown a very good reproducibility for denaturation temperature (+0.5 %) and for enthalpy (about 3%). Due to the accuracy of the apparatus used here and to the large samples analyzed, the errors on the enthalpies can be estimated to about 3 % for the large, well separated peaks and to about 10% for the small, badly resolved peaks.
The results presented here are comparable to those mentioned in literature [1, 2, 6]. Some variations of the denaturation peak temperature in the DSC curves compared
to literature values are due to the different choice of heating rates, of sample pH and
of sample size. The differences in the denaturation enthalpy can be explained by the apparatus sensitivity (which is greater in our measurements) and by different base- line fitting.
As expected, fresh egg white presents the highest denaturation enthalpy when compared to the other egg white fractions tested (Table 1).
The denaturation enthalpy of the ovalbumin fraction is quite comparable with
the denaturation enthalpy of the pure protein tested, 18.2 J
(g
protein) -1 and17.9 J (g protein) -z respectively. This result suggest the idea that the ovalbumin fraction obtained by ammonium sulfate fractionation was a quite pure protein.
The denaturation enthalpy of lysozyme depleted egg white is slightly lower than this of fresh egg white. Indeed, even if isolated lysozyme has a high denaturation
enthalpy (AH a 23.2 J
(g
protein)-l), the product of the denaturation enthalpy withthe concentration of that protein in egg white is very low. Ovomucin depleted egg
FERREIRA et al.: EGG WHITE PROTEINS 689
Table 1 Denaturation temperatures and enthalpies of egg white and egg white fractions (10% TP and pH 7)
Ovalbumin Lysozyme depleted Ovomucin depleted
Fresh egg white fraction egg white egg white
Denaturation temperatures, Ta/~ ~
Conalbumin 60 b 59 60 Lysozyme 67 b b 70 Ovalbumin 78 79 78 79 S-ovalbumin 82 82 82 82 And /J (g P r~ 20.6 18.2 17.1 18.5
a denaturation peak temperature b absent in this sample.
Table 2 Denaturation temperatures and enthalpies of three pure commercial egg white proteins (10% TP andpH 7)
Conalbumin Lysozyme Ovalbumin
Denaturation temperature, Td~ An d/J (g protein) -1
58 74 87
12.6 28.2 17.9
white has a denaturation enthalpy between the corresponding values of flesh egg white and of lysozyme depleted egg white. As ovomucin denaturation does never appear in the DSC curve, the coprecipitation of lysozyme occurring during the ovomucin separation may be the reason for this slight decrease in AHd.
Conclusion
It was demonstrated here that DSC helps to characterize the products obtained from egg white by some selected fractionation procedures. The calorimetric curves shown here can be used as fingerprints of some fractions of interest. In addition, the quantitative information obtained in this study is precise and coherent enough to be used for characterization of the fractions. In this study the only major protein we could not observe by DSC is ovomucin. Ovomucin denaturation seems however never to be detected by DSC.
We got a good agreement of these DSC data with H P L C and SDS-PAGE results. Thus a systematic correlation between results obtained with all these techniques could bring relevant information.
, ,it
690 FERREIRA et al.: EGG WHITE PROTEINS
References
1 J. W. Donovan, C. J. Mapes, J. G. Davis and J. A. Garibaldi, J. Sci. Agric., 26 (1975) 73. 2 J. W. Donovan and C. J. Mapes, J. Sci. Agric., 27 (1976) 197.
3 R. C. Warner, in The proteins, Vol. IIA, Academic Press, New York 1954 p. 435. 4 G. Alderton and H. L. Fevold, J. Biol. Chem., 164 (1946) 1.
5 A. Kato, R. Nakamura and Y. Sato, Agrie. Biol. Chem., 34 (1970) 854.
6 S. Barhut and C. J. Findlay, in Thermal Analysis of Foods, Elsevier Applied Science, London 1990 p. 126.