Non-invasive molecular genetics studies of
Iberian wolves in Alvão/Padrela
Mestrado em Biologia Molecular e Genética
Andreia de Oliveira Quaresma
Dissertação orientada por: Professor Doutor Francisco Fonseca
Doutora Fernanda Simões
“The wolf is neither man's competitor nor his enemy. He is a fellow creature with whom the earth must be shared.”
i
Acknowledgements
I would like to thank everyone who supported me, especially to:
Professor Francisco Fonseca, for giving me the opportunity to join Grupo Lobo and for the orientation;
Fernanda Simões, for her orientation, support, availability and technical knowledge;
Carla Borges, for the technical knowledge;
Joana Guimarães, for all the help given;
iii
Abstract
Awareness of the worldwide extinction and decline of wolf populations has led to the development and implementation of legal protection and conservation measures. Use of molecular markers in non-invasive samples can be used for population monitoring with a view towards conservation. Genotyping microsatellites serves to determine the number of offspring born per year, the genetic flux between subpopulation and damage caused by humans to habitats by fragmentation that can lead to population isolation.
In this study 93 scat samples were collected between 2014 and 2015 and analysed. Out of the samples, 54 were successfully genotyped and 13 assigned as wolves by Bayesian analysis. As 2 out of the 13 samples were recaptures, the total number of assigned wolves was 12. Genetic parameters, sex and the presence of hybrid signal (K locus) in the genotyped samples was determined. From the 54 genotyped samples, 8 were amplified for mtDNA.
The genotyped samples assigned as wolves had 33% allelic dropout and a Probability of Identity of 7.4x10⁻¹⁴. The observed heterozygosity was lower than expected (0.49 against 0.63) which could be explained by the existence of a non-panmictic population and allelic dropout. The inbreeding values are high which could derive from high inbreeding, null alleles or possibly the Wahlund Effect. Low number of reproductive individuals can lead to an allele fixation that can be determined by the presence of private alleles. For these samples, the number of private alleles was 4. Sex identification for each wolf sample gave 3 males and 7 females. Kinship showed 2 possible parent/offspring relationships and one case of full siblings. The wolves from Alvão showed a homozygous genotype for a non-mutated allele in the K locus, which means no hybrids presence. For the study of the mtDNA, from the 8 samples amplified, 3 were from wolves, 4 from dogs and 1 from a fox. The phylogenetic tree produced separated these samples in different branches according to each species. The wolf mtDNA analysis blasted against a Portuguese partial mitochondrial genome (KT448278).
This work shows that information relating to genetic diversity can be obtained using molecular markers in non-invasive samples, and such knowledge is necessary for long-term species conservation.
Keywords: Iberian wolf, Conservation Biology, population monitoring, non-invasive samples, molecular markers
v
Resumo
Inicialmente, o lobo (Canis lupus, Linnaeus 1758) tinha uma área de distribuição por todo o Hemisfério Norte, adaptando-se a diversos tipos de habitat. Depois do Homem são o segundo mamífero com maior área de distribuição. Devido à sua facilidade de adaptação e a uma dieta variada, o lobo substitui facilmente as presas selvagens pelas domésticas, entrando em conflito com o Homem.
Até meados do seculo XIII, o lobo era muito comum por toda a Europa. O seu extermínio começou a partir do seculo XIX na Europa Ocidental e a partir de 1950 na Europa de Leste, consequentemente com a destruição de habitats e o declínio das suas presas naturais, a sua área de distribuição foi reduzida a 80% na Eurásia, 98% no México e Estados Unidos e 20% no Canada e Alasca.
Atualmente, na Europa estão descritas 9 populações de lobo cinzento, uma delas encontra-se na Península Ibérica, o Lobo Ibérico (Canis lupus signatus, Cabrera 1907) e distribui-encontra-se pelo noroeste da Península Ibérica, havendo uma pequena população isolada no sul de Espanha, Serra Morena. Estima-se que existam cerca de 2 500 indivíduos e, encontra-se classificada como “Quase Ameaçada”. Em Portugal, segundo o último censo, existem cerca de 300 lobos separados pelo rio Douro em dois grupos populacionais. A população a norte deste rio encontra-se dividida em três núcleos populacionais: o núcleo de Penada-Gerês (Noroeste de Portugal), o núcleo do Alvão (Centro-norte de Portugal) e o núcleo de Bragança (Nordeste de Portugal). A população a sul do rio está dividida nos núcleos de Arada/Trancoso e Sabugal e evidencia um elevado nível de fragmentação e isolamento.
Na Europa, vários países subscreveram a Convenção de Berna (82/72 de 19 de Setembro de 1979), onde consta que tanto a espécie de lobo como o seu habitat são estritamente protegidos. Na Diretiva Habitats (92/43 de 21 de Maio de 1992), o lobo europeu é considerado uma espécie com necessidade de conservação do seu habitat (apêndice II) e encontra-se estritamente protegido (apêndice IV). Em Portugal, a espécie está considerada como “Em Perigo” e está protegida pela Lei nº 90/80, de 13 de Agosto e pelo Decreto-Lei nº 139/90, de 27 de Abril, que proíbem a sua captura e abate, a destruição do seu habitat e a sua perturbação. O Instituto de Conservação da Natureza e da Floresta (ICNF) é a instituição governamental responsável pela conservação e gestão do lobo em Portugal. Esta instituição implementou um sistema de compensação de prejuízos por ataques perpetrados por lobos e
Non-invasive molecular genetics studies of Iberian wolves in Alvão/Padrela
vi
medidas de suporte à prevenção destes ataques. Um Sistema de Monitorização de Lobos Mortos foi também implementado, em 1999, com o objetivo de recolher todos os lobos mortos encontrados no país.
A conservação de espécies ocupa um lugar de destaque na genética da conservação, compreendendo diversas áreas científicas. Através da aplicação de marcadores moleculares, como os microssatélites e SNPs, é possível estudar a variabilidade genética de uma espécie e, consequentemente estudar parâmetros genéticos importantes como: níveis de endogamia, fluxo genético ou o tamanho efetivo de uma população.
Neste projeto foi utilizado um painel de 17 microssatélites com o objetivo de estudar a população lupina na região de Alvão/Padrela. Foram recolhidos 93 dejetos, entre 2014 e 2015. Das 93 amostras retiradas dos dejetos, 54 foram amplificadas com sucesso e genotipadas. Destas 54 amostras, 13 foram identificadas como lobos, através de análise Baiseana, sendo que 2 destes genótipos representam uma possível recaptura, dando um total final de 12 lobos encontrados nesta amostragem. Os parâmetros genéticos das 54 amostras foram estimados conjuntamente com as bases de dados de cães e lobos ibéricos. Foi também determinado a presença de possíveis híbridos, através do estudo do locus K, e a identificação do sexo das amostras. Das 54 amostras genotipadas, 8 foram amplificadas com sucesso para o estudo do ADN mitocondrial (linhagem materna).
Antes de se proceder à extração do ADN dos dejetos, estes foram sujeitos a uma análise visual da qualidade do material genético que se encontra sob a forma de uma camada transparente de células na superfície da amostra recolhida. A qualidade desta camada está relacionada com a taxa de sucesso do PCR, tal como foi determinado. De uma amostragem de 26 dejetos registados como bons, a taxa de sucesso do PCR foi de 88%. Por outro lado, de 11 amostras assinaladas como más a taxa de sucesso do PCR foi de 9%.
O erro de genotipagem estimado para as 54 amostras foi 33% por loci de allelic dropout. A heterozigotia observada foi inferior à esperada (0,49 versus 0,63), o que poderá ser explicado pela existência de uma população não-panmítica, bem como, pela presença de falsos homozigotos devido aos erros de genotipagem que poderão influenciar os resultados estimados, levando a que uma menor heterozigotia seja calculada. O Índice de Fixação tem um valor mais alto que o calculado para a população de referência do lobo usada e pode dever-se à ocorrência de endogamia, alelos nulos ou ao Efeito de Wahlund que se traduz numa redução da heterozigotia numa subpopulação devido ao baixo número de indivíduos que formam essa população. Possíveis relações de parentesco que existam devido às amostras
vii serem recolhidas numa área pequena e, consequentemente haver uma grande probabilidade de pertencerem à mesma alcateia pode, também, explicar este valor. Um baixo número de reprodutores pode levar à fixação de alelos e, consequentemente, a um bottleneck da população. Estes alelos podem ser determinados pela presença de alelos privados estimados. Nas amostras de lobo foram identificados 4 alelos privados com uma frequência superior a 0,020. Foram calculadas as Probabilidade de Identidade entre indivíduos (PI), isto é, a probabilidade de dois indivíduos ao acaso partilharem o mesmo genótipo, e a Probabilidade de Identidade entre irmãos (PIsib), ou seja, a probabilidade de similaridade genética entre irmãos, obtendo-se um valor de 7,4x10⁻¹⁴ e 3,4x10⁻⁶, respetivamente. Estes valores indicam uma baixa probabilidade de duas amostras retiradas ao acaso da população em estudo terem o mesmo genótipo. Considerando as relações de parentesco foi possível estimar 2 relações ascendência/descendência e 1 possível caso de irmãos. Uma árvore filogenética foi construída com base nas 8 amostras amplificadas e sequenciadas e, é possível observar uma divisão entre os ramos de cães e lobos. As sequências mitocondriais dos lobos foram sujeitas a BLAST e uma similaridade com um haplótipo descoberto em Portugal foi encontrada (Genbank: KT448278).
Um dos atuais focos de preocupação da conservação do lobo na Europa é o aumento de casos de hibridação entre cães e lobos, principalmente em locais de baixa densidade lupina. Esta hibridação pode ter consequências importantes para a conservação dos lobos devido à intensiva seleção artificial a que os seus congéneres domésticos foram sujeitos para interesse do Homem. A propagação de genes domésticos para o lobo pode perturbar as adaptações locais ou aumentar a homogeneização genética tornando-se num dos principais problemas para a conservação da espécie selvagem. Até ao momento, em Portugal, apenas um hibrido foi encontrado na zona do Minho. Uma técnica utilizada na deteção de híbridos passa pelo estudo do gene CBD103 (locus K). Este gene sofreu uma deleção de 3 pb no cão, estando ligado à característica do pelo preto em, pelo menos, 50 raças de cães. As 12 amostras de lobo foram testadas para o locus K com o objetivo de determinar possíveis sinais de hibridação. Nenhum hibrido foi encontrado na zona de estudo.
Este trabalho mostra que o conhecimento da diversidade genética das populações pode ser obtido através do uso de marcadores moleculares em amostras não-invasivas. Esse conhecimento é necessário na conservação, a longo-prazo, das espécies.
Non-invasive molecular genetics studies of Iberian wolves in Alvão/Padrela
viii
Palavras-chave: Lobo Ibérico, Biologia da Conservação, monitorização populacional, amostras não-invasivas, marcadores moleculares
Index
Acknowledgements ... i Abstract ... iii Resumo ... v 1. Introduction ... 1 1.1. General Information ... 11.2. European wolf subpopulations ... 2
1.3. Iberian Wolf status in Portugal ... 3
1.4. Genetics: molecular markers ... 4
1.5. Determination of hybrids by coat colour ... 7
2. Methods ... 9
2.1. Sample collection ... 9
2.2. DNA extraction... 9
2.3. Microsatellite genotyping and capillary electrophoresis ... 10
2.4. Data analysis ... 11
2.5. Molecular sexing ... 12
2.6. Y-Chromosome analysis... 12
2.7. Mitochondrial haplotypes ... 14
2.8. Hybrid signal detection ... 14
3. Results ... 15
3.1. Sample preparation and genetic variability ... 15
3.2. Molecular sexing ... 20
3.3. Y-Chromosome ... 20
3.4. Mitochondrial haplotypes ... 22
3.5. Hybrid signal detection ... 22
4. Discussion ... 25
5. References ... 29
1
1. Introduction
1.1. General InformationThe wolf, commonly called the grey wolf (Canis lupus, Linnaeus 1758), is the most highly distributed of all land mammals, second only to humans. Wolves can tolerate a wide range of environmental conditions in the Northern Hemisphere and adapt to different vegetation types, feeding on large mammals or berries and living in the tundra, the desert or sometimes visiting cities (Mech and Boitani, 2003). As a widely distributed animal, wolf varies, mainly, in their body size and coat colour polymorphisms. It can vary in body size from 13 kg to 78 kg, being the southern wolves smaller than their northern cousin (Mech and Boitani, 2003). Wolf coats usually show different shades of grey, whereas southern and desert populations are brownish and reddish. Completely white wolves are common in the Arctic regions, while black wolves occur in some western North-American populations (Musiani et
al., 2007). Wolves live in packs that normally included the mating pair and their offspring
over several years (they can stay with their parents for 10-54 months); these carnivores are territorial and cover large territories so as to have high number of prey. In order to defend their territories, wolves can travel distances up to 72 km/day (Mech and Boitani, 2003; Pilot
et al., 2006).
Wolves have been perceived as evil creatures over history. The fear and killing of livestock has led to a “war” between humans and wolves. This has been a cause of mortality and some wolf populations have become extinct. The threats include not only competition with humans but also fragmentation of habitat. Therefore, habitats have become smaller and isolated and populations are not able to survive in the long-term.
To prevent the extinction of critically endangered fauna and flora, European countries have adhered to the Bern Convention (Convention on the Conservation of European Wildlife and Natural Habitats of 19th September 1979), which promotes the conservation of habitats and species of European importance. Some countries, as Spain and Slovakia have made an exception for wolf protection allowing controlled hunting. The European Habitats Directives (92/43 of 21st May 1992) ensures the conservation of a wide range of rare, threatened or endemic animal and plant species and lists European wolves in Appendix II (species in need of habitat protection) and Appendix IV (fully protected). Outside Europe, the Convention on International Trade in Endangered Species of Wild Fauna and Flora (CITES, 3rd March 1973), lists the wolf in its Appendix II (potentially endangered) with the exception for Bhutan,
Non-invasive molecular genetics studies of Iberian wolves in Alvão/Padrela
2
Pakistan, India and Nepal that are listed in Appendix I (endangered) (Mech and Boitani, 2003).
1.2. European wolf subpopulations
In Europe nine subpopulations have been described that are formed by partially isolated local fragments (Greco, 2009; “The IUCN Red List of Threatened Species”, 2007). The Italian population is estimated to have 500-800 individuals distributed along the Apennines. This population has limited exchange with the western Alps population and recent genetic evidence indicates a unidirectional flux of genes toward the Alps. It is classified as Vulnerable due to human pressures such as poison, shooting or car accidents. The Western – Central Alps population occupies the western Alps in France and Italy and south of Valle d’Aosta. The native population became extinct in the 1920s and the present one is an outgrowing from the Italian populations and so, it is still small (currently estimated to be 100-120 individuals). It has limited genetic and demographic contact with the Italian population from Apennines and has less than one successful migrant per year, thus qualifies as Endangered. The Dinaric-Balkan population extends from Slovenia to north-central Greece covering the whole Dinaric mountain area. It is a large wolf population estimated at about 5,000 individuals and is classified as Least Concern. The Carpathian population extends across several countries of Central and Eastern Europe. It is estimated that around 5,000 individuals exist and so, it is classified as Least Concern. The Baltic population is spread across the Baltic countries and have a population estimated at around 3,600 individuals. It is classified as Least Concern. The Karelia population occur in Finland and Russian Karelia. The total population is not known but is considered to be less than 10,000 individuals and it may be declining as a result of persecution. The population is assessed as Vulnerable but because is considered to be in contact with the large Russian population, which can have a potential rescue effect, is listed as Near Threatened. The Scandinavian population is estimated to be between 130 and 150 individuals. This population originated from a pair that migrated from Finland and first reproduced in 1983. It has a low genetic variability and has had no genetic exchange with the Finnish population since 1991. Therefore, it is classified as Endangered. The German population is a tiny, fragmented and isolated population with an estimated number of less than 50 individuals and thus, is considered as Critically Endangered. The Iberian wolf population is established, mostly, in the north-western area of Iberian Peninsula, including the western Basque country. It is expanding towards south and east and
3 has around 2,500 animals. There are 3 population segments within this population. The largest is at north of Douro river in both Spain and Portugal. At south of Portuguese Douro river is a small population in exchange with the animals from north of the Douro and east with the Spanish population. Lastly, a small number of about 50 wolves is isolated in a small region at south of Spain, in Serra Morena. Wolves are fully protected in Portugal and south of Spain. In Spain the management regimes are dependent of the autonomous regional governments. This population is classified as Near Threatened due to inadequate management and over-hunting. The population from Serra Morena is classified as Critically Endangered due to its distance from the main population.
1.3. Iberian Wolf status in Portugal
The Iberian Wolf (Canis lupus signatus, Cabrera 1907) has a brown coat that is darker at the body sides and black in the back (brown hair with black ends). The Portuguese population lives mainly at mountain regions with a low human population density, agricultural areas and high stock farms. It is separated by Douro river into two population groups. The northern population, divided into three subpopulations: Peneda-Gerês (northwest of Portugal), Alvão/Padrela (centre-north of Portugal) and Bragança (northeast of Portugal), and the southern population, divided into subpopulations of Arada/Trancoso and Sabugal. Its presence was detected in about 200,000 km2 but lives regularly in only 16,000 km2. It is estimated to be around 300 individuals, according to the last Census and is distributed for 63 wolf packs in Portugal (54 at north of the Douro river and 9 at south), being classified as Endangered (Pimenta et al., 2005; Malveiro, 2007; Godinho et al., 2007).
In Portugal, the conservation and management of the wolf is under the responsibility of the Institute for Nature Conservation and Forests (Instituto da Conservação da Natureza e das
Florestas – ICNF), being fully protected since the 1990s (Decree-law nº 90/80, of 13th August and Decree-Law nº 139/90, of 27th April). This institute implemented a verification system to determine livestock attacks that are assigned to this species, in order to provide compensation for livestock loss, and support measures to prevent attacks by delivery sheepdogs. Also, ICNF implemented a Dead Wolves Monitoring System (1999) to collect dead wolves found throughout the country.
The Decree-Law nº 140/99 of 24th April with the updated in Decree-Law nº 49/2005 of 24th February was adapted from the Habitats Directive (92/43/EEC of 21st May 1992) and lists the wolf as priority species in Annexes II and IV. The Bern Convention (82/72/EEC), where
Non-invasive molecular genetics studies of Iberian wolves in Alvão/Padrela
4
the wolf is a protected species in Annex II was adapted to the Portuguese law by the Decree-Law nº 316/89 of 22nd September. Council Regulation (EC) nº 338/97 listed this species as potentially threatened and thus, it was adapted to the Portuguese law by the Decree-Law nº114/90 of 5th April.
Genetics is a useful tool for conservation. This area has been expanding and, with it, new fields and new methods have arisen, helping to implement new conservation programs.
1.4. Genetics: molecular markers
Genetic changes are intimately involved with the fate of small wolf populations. Threatened species are often small populations where there is a lot of inbreeding and loss of genetic diversity that results in an increased risk of extinction (Frankham, 2003). A new area, called conservation genetics, arose from the understanding of these genetic changes.
Conservation genetics is the application of genetic methods to the conservation and restoration of biodiversity (Frankham, 2003; Frankham, 2010). It includes a variety of scientific fields, such as, population genetics, molecular genetics, ecology, evolutionary genetics and biology. Conservation of genetic variability of a population is important to the overall health since the decrease of the population variability leads to an increase in the level of inbreeding and reduces fitness (Vignal et al., 2002).
Molecular markers are one of the best tools to study animal genetics, as they can show high variability and polymorphism at the DNA level. However, there is a large variety of molecular markers and so marker selection should be made according to the aim of the study (Vignal et al., 2002; Malveiro, 2007).
Microsatellites, Simple Sequence Repeats (SSR) or Simple Tandem Repeats (STR) are tandemly repeated motifs of one to six bases found in prokaryotes and, more frequently, in eukaryotes genomes. STRs are Mendelian inherited and co-dominants and are distributed throughout the genome, mainly in non-coding regions. They are characterized by a high degree of length polymorphism and a higher mutation rate (10-2 to 10-6 mutations per locus per generation). A fast and easy detection by PCR is possible, even for highly degraded DNA samples, due to their small size and high number of loci available to all species (Vignal et al., 2002; Malveiro, 2007). These molecular markers are often preferable and allow the identification of two inherited alleles from parents at each locus. Once half of the alleles are shared between parent and offspring, these markers also serve to determine family
5 relationships, study of population social structure and sexual behaviour, due to their high polymorphism. (Mech and Boitani, 2003; Malveiro, 2007).
When using non-invasive samples, the total amount of DNA available for genetic typing can be low and is often in the picogram range. If the PCR allows detection of a single target molecule, only one allele of a heterozygous individual is often detected. This type of error, called allelic dropout, produces false homozygotes, and can be explained by sampling a small and non-homogenous amount of DNA being pipetted, which leads to only one of the two alleles being amplified and detected. Allelic dropout might also be related to extreme DNA degradation, or differential amplification of one of the two alleles. Another kind of genotyping error has been detected when using very little template DNA and when amplifying dinucleotide microsatellites: artefacts generated during the amplification process and then misinterpreted as true alleles because they have the same characteristic shadow band profile. This error is known as false allele and occurs when a homozygous individual, is recorded as a heterozygote. These artefacts generating false alleles can be easily confused with sporadic contaminations (Taberlet et al., 1996; Taberlet et al., 1999). In microsatellites analyses the so-called null alleles can occur. These derive from mutation in the flanking regions of the microsatellites, which is coincidental with the hybridization sites of the primers and may result in a wrong classification of heterozygous individuals as homozygous. If this error is frequent in a population, the heterozygosity will be underestimated which can explain the lack of heterozygosity in some populations (Malveiro, 2007).
A Single Nucleotide Polymorphism (SNP) is a single base change in a DNA sequence that can occur in the entire genome. These markers are usually bi-allelic due the low probability of two independent base changes occurring at a single position (low frequency of single nucleotide substitutions: 1x10⁻⁹ to 5x10⁻⁹ per nucleotide and per year at neutral positions in mammals). Another reason is due to a bias in mutations, leading to the prevalence of two SNP types (Vignal et al., 2002; Greco, 2009).
One advantage of using SNPs is their high density in genomes that allows analysis several at a single locus involving a few hundred base pairs. This represents a more reliable and faster genotyping method since amplifying short sequences and extending single nucleotides, SNPs genotyping should increase PCR success and reduce the allelic dropout and false allele rates (Greco, 2009). On the other hand, on large scale, this approach tends to be expensive due to the need for locus specific primers, is limited to regions with available data and produces diploid sequence where is not always easy to distinguish between sequencing artefacts and
Non-invasive molecular genetics studies of Iberian wolves in Alvão/Padrela
6
polymorphism, when double peaks, as expected in heterozygotes, are observed (Vignal et al., 2002).
Mitochondria are cytoplasmatic organelles that are responsible for the production of energy in the cell. They contain multiple copies of small circular DNA molecules that exceed the nuclear genome by a factor up to 10,000. DNA sequences from mitochondria have a high mutation rate and therefore contain more sequence diversity compared to nuclear DNA, which makes identification of closely related species easier (Mech and Boitani, 2003).
Mitochondrial DNA (mtDNA) analysis offers a unique perspective on evolutionary history because the mitochondrial genome is maternally inherited, and so, only females leave a genetic legacy. Phylogenetic analysis of dog and grey wolf mitochondrial sequences show that dog sequences are found in at least four distinct clades, implying a single origination event and at least three other originations or interbreeding events (Ostrander and Wayne, 2005). A study conducted by Vilà et al. (1999) found 34 different mtDNA haplotypes in their population study. These sequences differ by 1 to 12 substitutions and had indels at 2 positions. In the same study, Vilà and colleagues did not find any pattern between geographical and haplotypes distribution. So far 24 mitochondrial lineages for Iberian wolves have been described (Vilà et al., 1997, 1999; Randi et al., 2000; Valière et al., 2003; Björnerfeldt et al., 2006; Godinho et al., 2007 and Parra et al., 2008).
Researchers studying humans have identified SNPs and microsatellites on the Y-chromosome. These discoveries have allowed a new paternal view of evolutionary patterns that complements studies on maternally inherited nuclear genes (Mech and Boitani, 2003). Natanaelsson et al. (2006) sequenced 14,437 bp of 10 dogs Y-chromosome DNA sequences. They found 14 substitutions that defined 9 haplotypes and obtained 5 haplotypes as a minimum number of wolf founders. Ding et al. (2012) analysed the same 14,437 bp of the Y-chromosome DNA for a population of 151 dogs, using 12 wolves and 2 coyotes as reference. They found a total of 32 haplotypes, where 28 belong to dogs (one shared with wolves), 2 wolf specific and 2 coyote specific. As a way to investigate the genetic diversity of the Iberian Canis, Pires et al. (submitted) analysed a total of 108 male canids (81 unrelated dogs and 27 Iberian wolves), using 11 Y-chromosome SNPs and 4 Y-chromosome STRs. From the 11 SNPs, 6 were polymorphic and where 4 substitutions were found that separate European dogs from Iberian wolves. These differences on the Y-chromosome markers could derive from diverse geographic and genetic factors.
7 1.5. Determination of hybrids by coat colour
Pigmentation in mammals is primarily due to the presence of melanin. Mammals have two forms of melanin in their coats. One is called eumelanin, which is a dark pigment and can vary between black and brown or blue-grey and another pigment is phaemelanin, which varies from pale cream through shades of yellow, tan and red (Greco, 2009).
Within the Canidae family, dogs (a subspecies from wolves since 1993, Canis lupus
familiaris, Linnaeus 1758), jackals (Canis adustus, Sundevall 1847; Canis aureus, Linnaeus
1758 and Canis mesomelas, Schreber 1775) and coyotes (Canis latrans, Say 1823) are closely related to wolves, and so all share the same number of chromosomes (78), consequently they are all capable of interbreeding and produce fertile offspring (Greco, 2009). This interbreeding is one of the most complex problems that the conservation and management of the wolf currently faces.
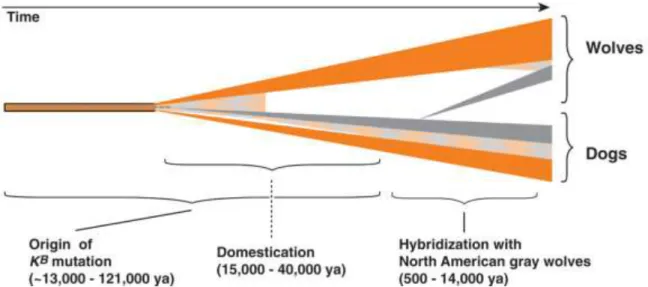
Melanism in dogs and wolves is generally controlled by the CBD103 gene (K locus), which maps on chromosome 16 and codes for a β-defensin protein that acts as an alternative ligand for the Mc1r in the melanocortin pathway. The melanistic K locus mutation is a three nucleotide deletion (KB allele), that is estimated to be more than 46,886 years old. It has been detected in 50 different black dog breeds and is widespread in wolves, as well as, in coyotes. Molecular analyses suggested that this melanistic deletion in wolves derived from domestic dog introgression that could have reached high frequency by positive selection (Candille et
al., 2007; Anderson et al., 2009; Caniglia et al., 2013). The process of hybridization and
introgression may be as old as 12,000 years, while the Italian black wolves dated 1970s (Figure 1) (Anderson et al., 2009; Caniglia et al., 2013).
Greco (2009) verified the presence of the 3bp deletion (KB) in Italian black wolf tissue samples and found completely agreement between phenotype and K locus. For the wild-type wolves analysed, the 3 bp deletion was absent, while all the carcasses described as black/dark were genotyped as heterozygous to this gene. However, all the dogs analysed were commonly heterozygous and rarely homozygous.
Non-invasive molecular genetics studies of Iberian wolves in Alvão/Padrela
8
The main objective of this thesis is to study the genetic variability of the wolf population from Alvão/Padrela using non-invasive samples. In order to achieve this aim, the following genetic analyses were carried out: i) identification of wolf scat samples and estimation of genetic parameters using a panel of 17 microsatellites; ii) determination of molecular sexing; iii) analysis of the Y-chromosome (paternal lineage); iv) analysis of the mitochondrial haplotypes (maternal lineage) and v) detection of possible hybrids in northern Portuguese wolf population.
Figure 1: Timeline scenario for K locus evolution in dogs and wolves, in which ancestral ky
chromosomes are indicated in orange and KB chromosomes in grey, and recombinant chromosomes as
an orange-grey checkered pattern. The ky -to- KB mutation may have overlapped or even predated
9
2. Methods
2.1. Sample collectionScat samples for genetic analyses were collected by a field team, non-invasively, northeast of the Douro River mainly from Serra do Alvão (Figure 2). Each scat was placed in sterile tubes and sent to the laboratory within one week. On arrival samples were stored at -60ºC without any preservation solution.
2.2. DNA extraction
All samples were prepared in a dedicated room in order to prevent external contamination. From each one, a portion of visible transparent film (mucosal outer layer) at scat surface was retrieved using a sterile scat and moved into a 2.0 ml sterile tube that was stored at -20ºC until DNA extraction. The quantity of biological material used was dependent of the faecal sample quality evaluated after visual analysis. Scats were classified in three scores: good (the visible
Non-invasive molecular genetics studies of Iberian wolves in Alvão/Padrela
10
transparent film was well visible in the scat surface), acceptable (scat with bad condition but it could be seen the transparent film at the surface) and bad (the mucosal outer layer was not visible and the scat has a high percentage of dirt, prey hair or degradation of the organic material). Genomic DNA was extracted from collected scat samples with innuPREP Stool
DNA Kit (Analytikjena), according to the protocol provided by the manufacturer. DNA
extraction was carried out using, each time, a batch of 11 samples plus a blank control. To each previously stored tube, 1.0 ml of Lysis Solution was added. Then, these samples were subjected to a clean-up step. They were transfer onto a pre-filter located in a 2.0 ml receiver tube and then centrifuged for 2 min at 10,000g. The filtrate was transferred into a 1.5 ml reaction tube with 25 µl of proteinase K and incubated for 20 min at 70ºC in a thermal mixer to digest and remove the proteins. To the lysed product was added 300 µl of Binding Solution and it was applied onto a spin filter located in a 2.0 ml receiver tube. The samples were centrifuged for 2 min at 10,000g. The receiver tube was discarded and the spin filter placed in a new one. The next two steps were carried out for sample washing. In a first step it was added to the column 600 µl of Washing Solution HS and in a second step 750 µl of Washing Solution MS. Both steps were centrifuged for 1 min at 10,000g and the spin filter was always placed in a new receiver tube. After the second washing step, the samples were centrifuged at maximum speed for 2 min to remove all traces of ethanol. Lastly, the spin filter was placed into a 1.5 ml tube and 100-200 ml of elution buffer was added and left to incubate at room temperature for 1 min. After the incubation the samples were centrifuged for 1 min at 6,000g and the extracted DNA was stored at 4ºC.
2.3. Microsatellite genotyping and capillary electrophoresis
The DNA was genotyped by Polymerase Chain Reaction (PCR) using 17 canine microsatellites (CXX.173, CXX.225, FH2010, C22.279, AHT121, FH2247, FH2054, FH2611, FH2001, PEZ08, FH4012, C38, REN247M23, FH2361, VWFx, PEZ06, FH3210) already described by many authors. The loci and primers are described in Appendix 1. For each primer pair, the forward oligonucleotide was labelled at the 5’ end with one of two fluorescent dyes: 6-FAM or HEX. Eight multiplex groups were determined between the primers, with different lengths, and the same annealing temperature.
In order to avoid cross-contamination among DNA samples during PCR preparation, all reactions were prepared in a laminar flow hood using aerosol-resistant pipette tips. The reaction mix was performed in 10 µl of final volume with Qiagen Multiplex PCR kit: 5 µl of
11 2x Qiagen Multiplex PCR Master Mix, 1.6 µl of DNA samples, primer concentration were varied for each marker (Table 1). The thermal cycling parameters were identical, consisting in an initial heat activation of 95ºC for 15 min, then 36 cycles of 94ºC for 30 sec, specific annealing temperature for each group of primers (Table 1) for 90 sec, 72ºC for 1 min and a final extension of 60ºC for 30 min. All PCR reactions were performed in a MyCyclerTM Thermal Cycler (Biorad).
Table 1: Multiplex sets with marker primer concentration and annealing temperature
Multiplex Conc.(µM) Tann Multiplex Conc.(µM) Tann Multiplex Conc.(µM) Tann
PCR1 PCR4 PCR7 FH2361 0.2 60ºC AHT121 0.2 53ºC FH2054 0.08 56ºC C38 0.2 C22.279 0.2 FH2611 0.5 REN247M23 0.2 FH2247 0.2 PCR2 PCR5 PCR8 FH3210 0.2 60ºC CXX.173 0.625 58ºC FH2001 0.2 58ºC PEZ06 0.2 CXX.225 0.625 PEZ08 0.5 VWF.x 0.2 PCR3 PCR6 FH4012 0.2 53ºC FH2010 2.5 58ºC
PCR products were separated and fluorescently detected by capillary electrophoresis, conducted on ABI PRISM 310 Genetic Analyzer (Applied Biosystems). Prior to gel loading, the samples were combined with 12 µl of formamide, 0.2 µl of GeneScan 350 ROX Size Standard (Applied Biosystems, Life Technologies) and 0.325 µl of deionized water for a final volume of 12 µl and submitted to an initial denaturation of 95ºC for 5 min.
In order to get microsatellite profiles, the samples were replicated in independent PCRs until each allele was observed at least twice. Microsatellite peaks were read using the GeneScan Analysis software
2.4. Data analysis
In order to estimate genetic diversity parameters and principal component analysis (PCoA), the GenAlex 6.5 software (Peakall and Smouse, 2006) was used. A database of 131 dogs and 61 Iberian wolves obtained from tissue samples was used as reference for assignment analysis. The software Structure 2.3.4 (Pritchard et al., 2000; Falush et al., 2003) was utilised to determine genetic structuring. It ran for 100,000,000 iterations (after 100,000 Burnin) with k value of 2 populations. To estimate the maximum likelihood of relatedness
Non-invasive molecular genetics studies of Iberian wolves in Alvão/Padrela
12
between samples, it was used ML-Relate software. GIMLET software (Valière et al., 2003) was used, for consensus genotypes construction and genotyping error rate estimation.
2.5. Molecular sexing
The sex determination was carried out by PCR using the primers SRy (Meyers-Wallen et
al., 1995) and AHTx40 (Spriggs et al., 2003). The reaction mix was made to a 25 µl of total
volume containing 12.5 µl of 2x ImmoMix Red reaction mix (Bioline), 0.4 µM of primer pair SRy, 0.6 µM of AHTx40 primers, 2.5 µl of DNA template. The thermal cycling program consisted of 10 min at 94ºC, 10 cycles of 30 sec at 94ºC, 30 sec at 58ºC and 45 sec at 72ºC, followed by more 30 cycles of 30 sec at 94ºC, 30 sec at 55ºC and 30 sec at 72ºC and a final extension of 30 min at 72ºC.
The amplified products were observed as bands on agarose gel by electrophoresis. It was not necessary to add loading buffer since the ImmoMix Red contains an inert red dye of sufficiently high density and allows direct sample loading onto the gel. PCR product sizes were determined by comparison with molecular weight markers (200 bp, BioRad) in a 2% agarose gel with ethidium bromide staining and were visualized by UV light.
2.6. Y-Chromosome analysis
For SNP analysis of polymorphic sites on Y-chromosome, a set of 3 primer pairs was used: Ydog_28, Ydog_B and Ydog_G (Borges et al., 2009) as shown in Table 2.
Table 2: Primers used in Y-chromosome PCR with their GenBank accession number
SNP Forward Reverse ydog28/ DQ973642 5'-TTCAGTTCTGTTCACACCAAAAC-3' 5'-AGAGGACAAAAAGCATATC-3' ydogB/ DQ973631 5'-AGCGCCGGAGCCGGCGG-3' 5'-GCACTGCTGACTGGGTG-3' ydogG/ DQ973626 5'-GGAATCCCTTTGCAAAGG-3' 5'-GGCAAAAGTCCGGGTGTCCTAC-3'
The PCR amplifications were performed in 15 µl of final volume reaction mix containing 8 µl of 2x BioMix (Bioline), 0.2 µM of the primer pair and 1 µl of DNA samples. The program used for the loci Ydog_28 and Ydog_G consisted of 3 min at 94ºC, 11 cycles of 30 sec at 94ºC, 45 sec at 53ºC and 1 min at 72ºC, followed by 34 cycles of 30 sec at 94ºC, 45 sec
13 at 48ºC and 1 min at 72ºC and a final extension of 20 min at 72ºC; for the locus Ydog_B the thermal cycling parameters were 94ºC for 3 min, 41 cycles of 94ºC for 30 sec, 53ºC for 45 sec and 72ºC for 1 min, and 72ºC for 20 min.
After amplification, PCR products were purified using ExoSapIT (Fermentas) to remove primers and dNTP that was not incorporated, by incubating 7 µl of PCR products with 3 µl of ExoSap at 37ºC for 60 min and then 80ºC for 15 min for enzyme denaturation. Once purified, the PCR products were subjected to a minisequencing reaction using SNaPshot kit (Applied Biosystems), with 5 µl of SNaPshot reaction mix, 1 µl of pooled mini-sequencing primers (Ydog_SNP_28B, Ydog_SNP_G-2, Ydog_SNP_B-2, (Pires et al., submitted), Table 3), 3 µl of pooled PCR purified product and 1 µl of deionized water for a final volume of 10 µl. A positive control was prepared where 5 µl of SNaPshot reaction mix was added to 2 µl of control template, 1 µl of control primers and 2 µl of deionized water according with manufacturer instructions. A negative control without the control template was also prepared. The thermal cycling consisted of 30 cycles of 10 sec at 96ºC, 5 sec at 50ºC and 30 sec at 60ºC. To the final volume of the minisequencing reaction, 1 µl of FastAP Thermosensitive Alkaline Phosphatase (Fermentas) was added and incubated at 37ºC for 60 min and 15 min at 80ºC. This post-one base extension treatment removes 5’phosphoryl group of ddNTPs to avoid unincorporated terminators from co-migrating with the extended primers and producing a high background signal.
Minisequencing products were analysed by capillary electrophoresis on the ABI Genetic Analyzer 3130. 12 µl of Formamide, 0.3 µl of GeneScan-120 LIZ size standard (Applied Biosystems) and 1 µl of minisequencing products were added in a total volume of 13 µl. Peaks were read using GeneMapper 3.7 Software (Applied Biosystems).
Table 3: Extension primer sequence used to detect Y-chromosome SNPs
SNP Extension primers Primer Length (bp) ydog_SNP_ 28B 5'-GGTAACTTACTGTGAGAAAGAATAAAGTATTTA-3' 33 ydog_SNP_ B-2 5'-GCAGCCCACAGTTTTTAGCTTCTCCAAAATGAC-3' 33 ydog_SNP_ G-2 5'-TACATATGTAAATTATATCTTCTTTGGTACTGTATATTATCTCTC-3' 45
Non-invasive molecular genetics studies of Iberian wolves in Alvão/Padrela
14
2.7. Mitochondrial haplotypes
The mitochondrial lineage was analysed using the universal primers Thr-L 15926 and DL-H 16340 (Vilà et al., 1999). PCR mix reaction was performed with 8 µl of 2x BioMix (Bioline), 0.5 µM of the primer pair, 1 µl of DNA samples and 4.5 µl of water to bring to a final volume of 15 µl. The thermal cycling program started with an initial denaturation at 95ºC for 5 min and proceeded with 5 cycles of 95ºC for 40 sec, 55ºC for 1 min and 72ºC for 1 min, 35 cycles of a touchdown program: 95ºC for 40 sec, 55ºC (decreasing 0.2ºC for cycle) for 1 min and 72ºC for 1 min; and a final extension of 72ºC for 15 min.
Samples were purified with ExoSapIT (Fermentas), incubating 3 µl of ExoSapIT with 7 µl of purified PCR product at 37ºC for 30 min and 80ºC for 15 min. Following the purification, direct sequencing of the DNA was carried out by ABI Genetic Analyzer 3130.
Data was analysed using ChromasPro (Technelysium) and BioEdit (Ibis Biosciences).
2.8. Hybrid signal detection
To analyse the presence of putative wolf-dog hybrids in this sample population the presence of the K locus mutated allele (KB) was screened, using the primer pair Locus SK described by Greco (2009). PCR mix contained 5 µl of 2x Qiagen Multiplex PCR Master Mix, 1 µM of the pair of primers, 1 µl of DNA samples and 2 µl of water to bring to a final volume of 10 µl. Amplification conditions were 95ºC for 15 min, 32 cycles of 94ºC for 15 sec, 55ºC for 15 sec and 72ºC for 30 sec and 72ºC for 10 min.
The products of PCR were separated and fluorescently detected by capillary electrophoresis, conducted on ABI PRISM 310 Genetic Analyzer (Applied Biosystems). Prior to gel loading, 1.5 µl of the samples were combined with 12 µl of formamide, 0.2 µl of GeneScan 350 ROX Size Standard (Applied Biosystems, Life Technologies) and 0.325 µl of deionized water for a final volume of 12 µl and submitted to an initial denaturation of 95ºC for 5 min. The data was read using GeneScan software.
15
3. Results
3.1. Sample preparation and genetic variabilityA total of 93 samples, collected from 2014 to 2015, were visually scored before DNA extraction into good, acceptable or bad, so as to facilitate prediction of DNA amplification results. Table 4 summarizes quantitative results from visual scoring and PCR amplification success rate. PCR DNA amplification was not possible in 39 of the samples tested. PCR amplification success rate is strongly dependent on scat condition as is shown by Table 4. Higher success rates are obtained for samples scored as good (88% amplification rate) since this scats have a highly visible transparent film on the surface and, therefore, the DNA is in better condition.
Table 4: Relation between PCR success rate and scats condition
Total Number of Processed Samples
Number of samples per scats condition
PCR Success Rate (%) 93 Good – 26 Acceptable – 56 Bad - 11 88 57 9
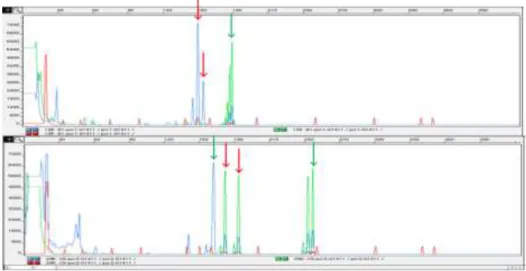
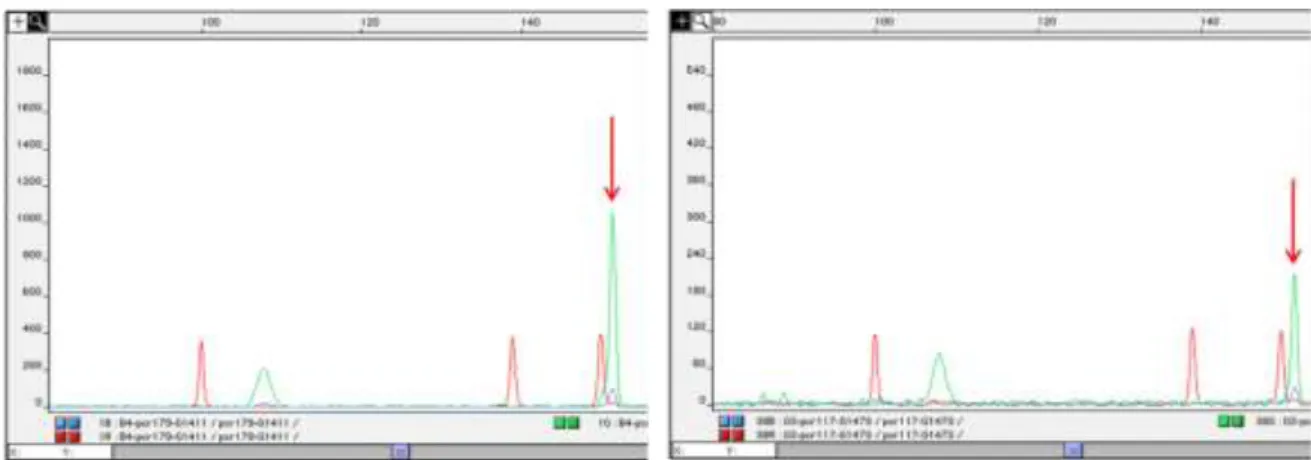
An example of the allele peaks in base pairs read by the GeneScan after microsatellite amplification in a multiplex form is illustrated in Figure 3. Homozygous and heterozygous
Figure 3: Eletropherograms of the sample G1411 for the loci C38 (blue) and
REN247M23 (green) (above) and VWFx (blue), PEZ06 (green) and FH3210 (green) (below). Heterozygous peaks are indicated with red arrows, while homozygous peaks are indicated by green arrows.
Non-invasive molecular genetics studies of Iberian wolves in Alvão/Padrela
16
peak profiles are indicated.
The total amount of DNA extracted from scat samples can be very low and is usually fragmented and degraded due to the environmental conditions that the samples were exposed to before collection. This means that during amplification there is the probability of detecting only one allele of a heterozygous. This type of error is called allelic dropout and produces false homozygous genotypes. GIMLET software was used to estimate error values using multiple replicates of each sample. The number of allelic dropout error per loci was found to be 0.333, across samples at 0.226 and per PCR at 0.182.
The Principal Coordinates Analysis (PCoA) calculated using GenAlex 6.501 separates the wolf population database (blue triangles, fourth quadrant) from the dog population database (green squares, third quadrant). The samples located along the positive vertical axis are mainly from samples that were not fully genotyped (Figure 4).
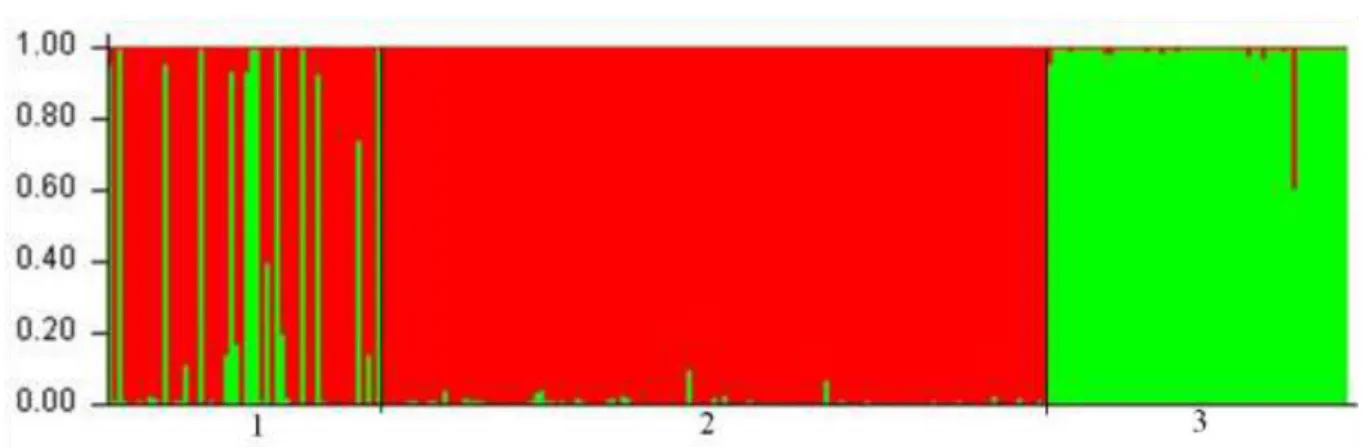
As there is strong differentiation between wolf and dog species, the Structure 2.3.4 software was used for species assignment of tested samples using the Bayesian method. The analysis was made for the Alvão population against dog and wolf databases. There is clear differentiation between dog (2) and wolf (3) reference populations in two clusters that is showed by Figure 5. The analysis showed that within the population studied, 13 samples shared almost 100% of the genetic pool with wolves: G1411, G1422, G1448, G1473, G1485,
G1411 G1413 G1422 G1433 G1437 G1435 G1440 G1441 G1442 G1445 G1447 G1448 G1449 G1451 G1457 G1458 G1465 G1472 G1473 G1476 G1477 G1479 G1480 G1481 G1485 G1487 G1490 G1491 G1492 G1493 G1494 G1495 G1496 G1497 G14100 G1502 G1504 G1505 G1507 G1508 G1509 G1510 G1511 G1514 G1515 G1519 G1520 G1521 G1522 G1523 G1525 G1527 G1528 G1530 Co o rd. 2 ( 4 %) Coord. 1 (8%)
Principal Coordinates (PCoA)
Alvão Dog PW
17 G1491, G1492, G1493, G1497, G1507, G1510, G1523, G1530 (green lines within population 1).
The 13 samples assigned as wolf by Structure 2.3.4 software were analysed for matching genotypes using GenAlex 6.5 and GIMLET software. Only samples G1497 and G1523 may represent recapture of the same individual in the field based on 9 microsatellite loci, thus one of these samples was removed from further analyses.
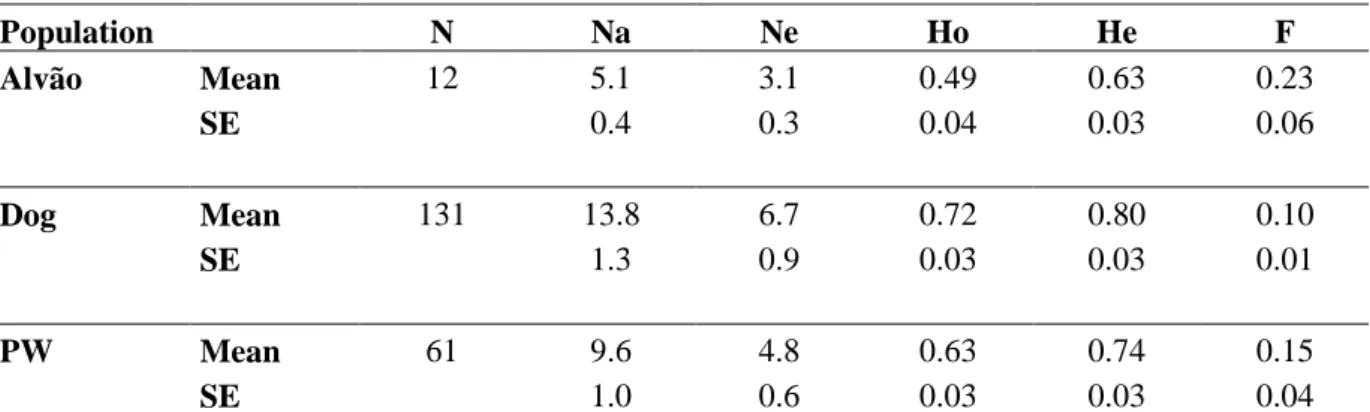
Genetic parameters were determined using a panel of 17 microsatellites and 3 populations. The populations under study contained canid samples from Alvão; the Portuguese dog database: Dogs; and thirdly, the Iberian wolf tissue database: PW (Table 5). Both observed (0.49) and expected (0.63) heterozygosity values are lower than the ones from wolf database. The average number of alleles for the Alvão population is nearly half that compared to the wolf database. The Fixation Index (F) for the Alvão population was 0.23, which may be expected given the isolated nature of the population. This value is higher than F value given in the wolf database (PW) and may be explained by inbreeding events, undetected null alleles and/or the Wahlund Effect. The higher observed heterozygosity (Ho) obtained for the wolf database (0.63) is due to a high number of wolf samples that is also more representative of biodiversity, covering regions both north and south of the Douro.
Figure 5: Bayesian analysis shows that the probability of membership of individuals in the wolf
(green) and dog (red) populations determined by the Structure 2.3.4 software. Each individual is represented by a vertical line that can be green and/or red according to the contribution of each species to the individual genotype. 1 represents the population from Alvão, 2 is the dog database and 3 the wolf database.
Non-invasive molecular genetics studies of Iberian wolves in Alvão/Padrela
18
Table 5: Genetic parameters by population
Population N Na Ne Ho He F Alvão Mean 12 5.1 3.1 0.49 0.63 0.23 SE 0.4 0.3 0.04 0.03 0.06 Dog Mean 131 13.8 6.7 0.72 0.80 0.10 SE 1.3 0.9 0.03 0.03 0.01 PW Mean 61 9.6 4.8 0.63 0.74 0.15 SE 1.0 0.6 0.03 0.03 0.04
N, Sample Size; Na, Number of Alleles; Ne, Number of Effective Alleles; Ho, Heterozygosity Observed; He, Heterozygosity Expected; and F, Fixation Index
The wolves from Alvão showed higher Ho and He values at locus FH4012 (0.83) and locus AHT121 (0.84), respectively. The lower Ho and He values were at locus VWFx (0.27) and locus FH2001 (0.42). These results are shown in Appendix 3.
Private alleles were found for all 3 populations. The private alleles estimated with a frequency above 0.020 are listed in Appendix 4. The Alvão group show 4 alleles that are not present in the database groups.
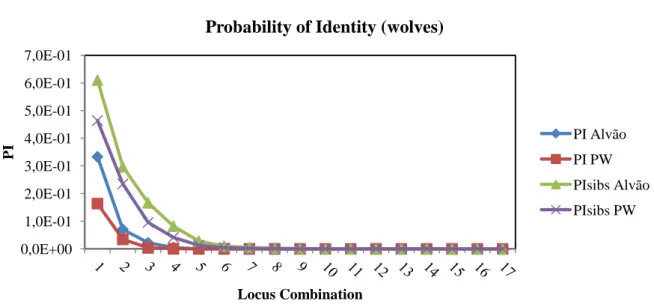
The Probability of Identity (PI) provides an estimate of the average probability that 2 unrelated individuals, drawn from the same randomly mating population, will by chance have the same multilocus genotype. The PI was calculated for each locus individually using allele frequencies obtained from Alvão population data. For the combination of all 17 loci, the PI for the population was 7.4x10⁻¹⁴ and the PIsib (genetic similarity among siblings) was 3.4x10⁻⁶ for the assigned wolves. These results are shown in Figure 6.
19 Kinship between the individuals assigned to wolves was studied with the ML-Relate software using a panel of 17 microsatellite loci. From the analysis of the data presented in Table 6, two possible parent/offspring relationships were found. Relationships were noted between samples G1491 and G1492 and samples G1507 and G1530, while individuals G1411/G1491 are possibly siblings.
Table 6: Matrix Relations
Samples G1411 G1473 G1491 G1492 G1507 G1422 G1448 G1485 G1493 G1497 G1510 G1530 G1411 - G1473 U - G1491 FS U - G1492 HS U PO - G1507 U U U U - G1422 U U U U U - G1448 U U U U U U - G1485 U U U U U U U - G1493 U HS U U U U U U - G1497 HS U HS U U U U U U - G1510 U U U HS U U U U U U - G1530 U U HS U PO U U U U U U -
U, Unrelated; HS, Half-Siblings; FS, Full Siblings; PO, Parent/Offsprings
Figure 6: Decrease of the probability of identity (PI) in “Alvão wolves” population in function of
the locus combination 0,0E+00 1,0E-01 2,0E-01 3,0E-01 4,0E-01 5,0E-01 6,0E-01 7,0E-01 PI Locus Combination
Probability of Identity (wolves)
PI Alvão PI PW PIsibs Alvão PIsibs PW
Non-invasive molecular genetics studies of Iberian wolves in Alvão/Padrela
20
3.2. Molecular sexing
The fragment lengths of the amplicons, for sex determination, amount to 190 bp (AHTx40) and 129 bp (SRy). The profile for a female wolf shows a single band (AHTx40), whereas the profile of a male wolf gives two bands (AHTx40 and SRy), as is shown in Figure 7. Out of the 12 samples assigned as wolves from Alvão, 3 individuals were considered male and 7 were female.
3.3. Y-Chromosome
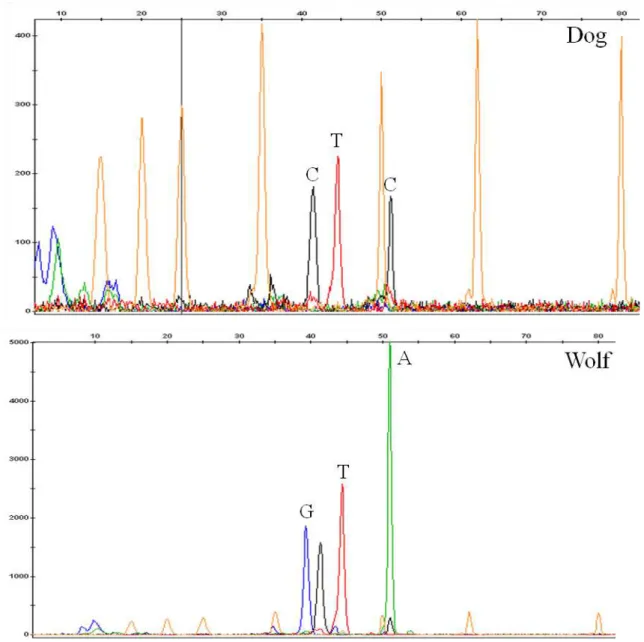
Y-chromosome SNP detection using the one base sequencing method of SNaPshot in scat samples did not produced the expected results under standard non-optimized conditions. As three SNP loci on Y-chromosome were tested 3 peaks corresponding to each targeted loci were expected (Table 7). Two electropherograms representing the profile of a putative dog and wolf are shown in Figure 8. However, the electropherograms showed multiple bands with high intensity, probably derived from non-specific interaction of primers with extra-canid DNA. More details are presented in a manuscript submitted by Pires et al. (submitted).
Figure 7 Electrophoresis for sex determination. Two bands indicate a male. DNA ladder of 200
21
Table 7: Y-chromosome haplotypes Y-chromosome fragment Dog haplogroup Iberian Wolf haplogroup ydog_28_B T G ydog_B-2 C T ydog_G-2 C A
Figure 8: Electropherogram showing a dog (G1458) profile (left) and a wolf (SLIFE14-327)
Non-invasive molecular genetics studies of Iberian wolves in Alvão/Padrela
22
3.4. Mitochondrial haplotypes
The mtDNA D-loop marker was tested in all the amplified samples but it only produced 8 PCR products that could be used for DNA Sanger sequencing. From mtDNA sequences searched by BLAST, 3 were from wolf assigned samples (G1473, G1485 and G1530), 4 from dog assigned samples (G1441, G1457, G1496 and G1525) and 1 from a fox (G1466). Appendix 7 shows a phylogenetic tree produced from mtDNA sequences. The mitochondrial sequences from structure-assigned wolves and dogs were clustered in different branches. These results are in agreement with those presented in the literature (Vilà et al., 1999).
3.5. Hybrid signal detection
The melanistic K locus mutation (KB) is estimated to be more than 46,886 years old and was propagated during dog domestication due to artificial selection by humans but has recently returned to the wolf population through interbreeding (Greco, 2009). Analysis of this molecular marker in the dog database showed that it can be homozygous or heterozygous for this locus, i.e., they are homozygous when only one peak for the 3 base deletion (KB/KB) or when only one peak corresponding to the absence of the mutation (ky/ky) is detected and heterozygous when both peaks appear (ky/KB). The analysis of the wolf database revealed that they are all homozygous, with only one genetic profile at this locus, a peak corresponding to the absence of the mutation (ky/ky).
The Alvão population showed the peak corresponding to the absence of the mutation (Figure 9), thus carrying the homozygous profile ky/ky, which means, a signal of hybridization was not detected in the area of study. Hybridization is a rare event in the Iberian Peninsula, and is only observed mainly in Spain in peripheral areas of recent wolf expansion. Godinho et
al. (2011) found 8 hybrids in the Northern Iberian Peninsula, one of which was in the
Portuguese Minho region (Table 8 shows the assigned wolves with their respective K locus genotype).
23
Table 8: Assigned wolves from Alvão with their respective K locus genotype Alvão K locus Alvão K locus
G1411 Ky/Ky G1492 ? G1422 ? G1493 Ky/Ky G1448 ? G1507 ? G1473 Ky/Ky G1510 ? G1485 Ky/Ky G1523 Ky/Ky G1491 Ky/Ky G1530 Ky/Ky
Individuals marked with “?” were not PCR amplified
Figure 9: Eletropherograms of the sample G1411 and G1473 for the K locus (green). Both samples, assigned as wolves, are homozygous (ky/ky).
Non-invasive molecular genetics studies of Iberian wolves in Alvão/Padrela
25
4. Discussion
Serra do Alvão is a small area at north of the Douro river surrounded by roads, with wind farms that break, degrade and destroy wolf habitats. According to Pimenta et al. (2005), the number of confirmed packs in Alvão/Padrela was 16, but the exact number of individuals is difficult to estimate as wolf density is very low in the area. Data from conventional monitoring methods such as direct observation and camera trapping are often difficult to obtain. Non-invasive techniques using genetic analysis of biological samples or signs, such as scats, urine, hairs and saliva, can be used in wild animals to identify, and map individual genotypes and estimate their relatedness. This study aimed to use non-invasive samples to monitor a wolf population, and attempted to obtain relevant information such as genetic variability, sex, maternal and paternal lineages and hybridization evidences. The low density of wolves in the studied area made sample detection and collection difficult.
The DNA extraction success rate in non-invasive samples depends on its condition when collected from the field. This is mostly due to climatic conditions and to the period of time that the scat samples were exposed to. Environmental conditions are the key for keeping the integrity of intestinal mucosa cells lining a scat after expelling, that typically form a visible transparent film after drying. The level of decomposition of the transparent film that contains the DNA is strongly related to the PCR success rate (88% for the 26 samples scored as good and 9% for the 11 samples scored as bad in this study). Even if the condition of these samples is scored as good, the target DNA is often scanty, fragmented and contaminated. This produces genotype errors as allelic dropout which, in the present study, was found to be 33% per loci. Marucco et al. (2009) described an error of allelic dropout of 55% and Sundqvist et
al. (2008) reported error between 27-69%. In the present study 39 of the 93 collected scats
could not be genotyped, while others were not genotyped to all loci.
The Principal Coordinate Analysis (PCoA) can be used to explore and visualize data similarity, making it possible to visualize individual and/or group differences. In this analysis, the difference between our dog and wolf database is clear, forming two distinct clusters. The samples from Alvão were widely distributed and occupy both clusters.
In order to obtain more accurate identification of the individuals, Bayesian analysis was done with Structure 2.3.4 software. This analysis allows the identification of different genetic groups by using multilocus genotype data to infer structure and assign individuals to
Non-invasive molecular genetics studies of Iberian wolves in Alvão/Padrela
26
populations. Eleven samples (G1411, G1422, G1448, G1473, G1485, G1491, G1492, G1493, G1497, G1507, G1530) can be assigned as wolves with a probability between 80-99% and two samples with a much lower probability of about 70% (G1510 and G1523).
Creel et al. (2003) tested the impact of genotyping error, from non-invasive samples, on estimates of population size. They were able to reduce this overestimation by reducing the number of loci genotyped, and consequently reducing the number of errors to create false genotypes. Overestimation was also reduced by allowing genotypes with one or more mismatches to be scored as identical, which was done with 2 samples from Alvão’s population (G1497 and G1523). These 2 samples were the only ones to be scored as a possible recapture with 3 mismatches: 2 homozygous loci where allelic dropout may have occurred and 1 heterozygous locus that could have been misread. This possible recapture gives a final count of 12 wolves in the Alvão’s region within the scope of the present study.
Observed heterozygosity was lower than the expected one within Alvão population. On the other hand, inbreeding values are higher than that found for the wolf reference population (0.23 and 0.15, respectively). These genetic parameters can be explained by the existence of a non-panmictic population or genotype errors. The random collection of samples in an area with low wolf density may also influence the data. The Wahlund Effect describes the reduction of heterozygosity as a subpopulation problem when dealing with a low number of individual samples, which may be the case of the wolf population of Alvão. These statistics may also be influenced by allelic dropout that produces false homozygous leading to lower values for heterozygosity. The determined inbreeding coefficient may be related with the collection of samples that have a relationship because they were collected from a small area but is not the case for all Iberian wolf population.
The number of private alleles found in Alvão, with frequency higher than 0.020, was lower than the database population for wolves (4 versus 13 alleles). In general terms, the presence of private alleles in a population may be due to allele fixation, as a consequence of a low number of reproductive units, which can lead to a bottleneck. In the present case, 4 private alleles are reported, that were not present in the wolf reference population. However, it should be noted that the reference wolf population consists of tissue samples from dead wolves and so, it may not include all the effective alleles present in the entire Iberian wolf population. On the other hand, the higher number of private alleles could be from wolves south of the Douro that are included in the database and are known to differ genetically from the northern ones.
27 The probability of identity (PI) is an individual identification estimator which describes the probability that 2 individuals, drawn at random from a population, will have the same genotype at multiple loci (Eichmann et al., 2005). The PI for siblings represents the upper limit for the possible range of PIs in the population (Taberlet et al., 1999). Waits et al. (2001) suggest that a PIsib between 0.001 and 0.0001 is sufficiently low for the identification of individuals in natural animal populations. The population of assigned wolves from Alvão shows a PIsib of 3.4x10⁻⁶ indicating that the probability of two random individuals having the same genotype is small, which means the use of 17 loci secures a high probability of individual identification between related individuals.
The simulation of kinship among the assigned wolves within the Alvão population identified 9 relationships, most of them as siblings or half-siblings. However, it was not possible to determine if they belong to the same pack neither was it possible to determine if more than one pack exists.
An alternate way to identify species is through mtDNA analysis which is inherited maternally and allows maternal lineages (haplotypes) to be identified. In Europe, mtDNA data suggested that most populations are genetically differentiated, with the exception of neighbouring populations, such as, Portugal and Spain (Vilà et al., 1999). In the same study the mtDNA CR sequence relationship does not show a geographic pattern in the haplotypes distribution. The total number of maternal lineages described to date in the Iberian Peninsula is 24 (2 are found in both countries (Spain and Portugal), 9 are found only in Portugal and 13 are found in Spain) (Pires et al., submitted). All mitochondrial sequences obtained from the assigned Alvão wolves were subjected to a blast searched at GenBank databases aligned with a Portuguese partial mitochondrial genome (GenBank access number: KT448278). The mtDNA species assignment is in agreement with that obtained using microsatellite markers and Bayesian analysis.
The tracking of inbreeding and knowledge relating to genetic diversity is important for informed species conservation. Molecular tools provide improved opportunities to understand the behaviour of wild animals and to establish a basic framework for a rational management.
Non-invasive molecular genetics studies of Iberian wolves in Alvão/Padrela
29
5. References
Anderson TM, Candille SI, Musiani M & Greco C (2009) Molecular and evolutionary history of melanism in North American gray wolves. Science, 323: 1339-1343
Björnerfeldt S, Webster MT & Vilà C (2006) Relaxation of selective constraint on dog mitochondrial DNA following domestication. Genome Research, 16(8): 990-994
Borges C, Simões F, Fonseca FP, Matos J & Pires AE (2009) A multiplex SNaPshot assay for detection of Y-chromosome SNPs in dogs and Iberian wolves. Archivos de Zootecnia, 58: 497-499 Candille SI, Kaelin CB, Cattanach BM, Yu B, Thompson DA, Nix MA, Kerns JA, Schmutz SM, Millhauser GL & Barsh GS (2007) A β-Defensin mutation causes black coat color in domestic dogs. Science, 318 (5855): 1418–1423.
Caniglia R, Fabbri E, Greco C & Galaverni M (2013) Black coats in an admixed wolf× dog pack is melanism an indicator of hybridization in wolves? European Journal of Wildlife Research, 59: 543-555
Creel S, Spong G, Sands J, Rotella J, Zeigle J, Joe L, Murphy K & Smith D (2003) Population size estimation in Yellowstone wolves with error-prone noninvasive microsatellite genotypes.Molecular Ecology, 12 (7): 2003–2009.
Ding ZL, Oskarsson M, Ardalan A & Angleby H (2012) Origins of domestic dog in Southern East Asia is supported by analysis of Y-chromosome DNA. Heredity, 108: 507-514
Eichmann C, Berger B, Steinlechner M & Parson W (2005) Estimating the probability of identity in a random dog population using 15 highly polymorphic canine STR markers. Forensic Science International, 151: 37-44
Falush D, Stephens M & Pritchard JK (2003) Inference of population structure using multilocus genotype data: linked loci and correlated allele frequencies. Genetics, 164: 1567-1587
Francisco LV, Langston AA, Mellersh CS, Neal CL, Ostrander EA (1996) A class of highly polymorphic tetranucleotide repeats for canine genetic mapping. Mammalian Genome, 7: 359-362 Frankham R (2003) Genetics and conservation biology. C. R. Biologies, 326: S22-S29
Frankham R (2010) Where are we in conservation genetics and where do we need to go? Conservation Genetics, 11: 661-663
Godinho R, Lopes S & Ferrand N (2007) Estudo da diversidade e estruturação genética das populações de lobo (Canis lupus) em Portugal. Relatório Final. CIBIO/UP. 56
Godinho R, Llaneza L, Blanco, JC, Lopes S, Álvares F, García E.J, Palacios V, Cortés Y, Talegón J & Ferrand N (2011) Genetic evidence for multiple events of hybridization between wolves and domestic dogs in the Iberian Peninsula. Molecular Ecology, 20 (24): 5154–66.