Non-Invasive Estimate of Cardiac Output During Exercise Based on
Impedance Cardiography and Oxygen Uptake in the Elderly
Maurício Nunes Rodrigues, Jacques Henri-Paul Vanfraechem, Paulo de Tarso Veras Farinatti
Universidade do Estado do Rio de Janeiro, Universidade Gama Filho, Université Libre de Bruxelles, Programa de Pós-Graduação em Ciências da Atividade Física-UNIVERSO, Clínica de Medicina do Exercício-Vitacor, Instituto de Desenvolvimento e Pesquisa em Atividades Físicas – IDEATIVA - Rio de Janeiro, RJ, Brazil – Bruxelas, Bélgica
Mailing Address: Maurício Nunes Rodrigues •
Laboratório de Atividade Física e Promoção da Saúde-UERJ - Rua São Francisco Xavier, 524/8133-F - 20550-900 – Rio de Janeiro, RJ, Brazil
The prescription of physical exercise for the elderly requires greater care as compared with the prescription of exercise for young individuals due to the typical physiological alterations associated with age and to the higher prevalence of several different clinical and pathological conditions. When developing exercise programs aimed at this age group it is therefore necessary to consider the specific physiological responses that occur during an exercise bout and how much risk they may originate that might jeopardize the participant’s physical integrity. Therefore the assessment of the responses of the cardiorespiratory system to exertion may contribute to improve safety during the prescription of exercise.
Heart rate (HR) is the most studied variable for this purpose, probably because its relationship with exertion intensity is accepted for all age groups1,2 and because it’s an easy-to-measure variable. However, a broader analysis of the integrity of cardiac function could be obtained if cardiac output (Q) and/or stroke volume were measured during the performance of assessment tests prior to participation in an exercise program. This is not observed in current practice, usually due to the invasive nature of methods used to quantify these variables.
The development of indirect methods to estimate Q and
stroke volume have increased the possibilities of understanding the behavior of cardiac function during exercise. The validity, accuracy and reproducibility of some of these methods during exercise, such as the indirect Fick method – by CO2 or acetylene rebreathing; impedance and inductance cardiography and oxygen uptake based methods - have been documented in the literature3-13. However, studies are scarce that focus on the assessment of the agreement between measurements generated by different indirect methods and their applicability to the elderly. Although they are of a noninvasive nature, some of them require the use of equipment and/or non-conventional maneuvers to perform these measurements which may prevent their correct use in this population.
The objective of this study is therefore to analyze the agreement of Q measurements using two non-invasive methods, i.e., impedance cardiography (IMP) and the method based on oxygen uptake (VO2), in addition to the applicability of both methods to elderly subjects.
Methods
Sample - A group of 131 apparently healthy elderly subjects, 54 men and 77 women (aged from 60-90), was randomly Objective: This study assessed the agreement between cardiac output (Q) measurements generated by two indirect methods and their applicability in 54 men e 77 women (aged 60-90).
Methods: The subjects performed a cardiopulmonary test with incremental to maximal exercise on a cycle-ergometer. “Q” was estimated based on oxygen uptake and on impedance cardiography at 50% and 100% of the maximal workload (Wmax) reached during the test. The limits of agreement and mean differences (biases) were estimated using the methodology proposed by Bland-Altman, whereas the relationship between the methods was analyzed by linear regression and intra-class correlation (ICC).
Results: For the load equivalent do 50% of Wmax, the bias between the means of the two methods was -0.58 L•min -1 (6.3%
smaller for the impedance measurement) and the limit of agreement was ± 2.54 L•min-1 (24.7%). At 100% of W
max, the bias was 1.03 L•min-1 (8.5% greater for the impedance measurement) with a limit of agreement of ± 3.35 L•min-1 (27.6%). ICC values and the regression curves obtained between the methods were: Qimp=1.82+0.75QVO2 (r2=0.765, p<0.001; ICC=0.727, p<0.01) at 50% Wmax; and Qimp=0.93+1.00QVO2 (r2=0.755, p<0.001; ICC=0.796, p<0.01) at 100% W
max.
Conclusion: These results suggest that there is a good agreement between the two methods for the measurement of Q during exercise in the elderly, which is compatible with the findings of similar studies with young subjects.
Key words: Exercise, exercise test, impedance, cardiography, aging.
. .
Estimation of cardiac output based on oxygen uptake - Oxygen uptake (VO2), carbon dioxide output (VCO2) and ventilation (VE) were assessed respectively by an O2 paramagnetic analyzer, an infrared CO2 analyzer and a pneumotachograph (Morgan, UK). These ventilatory variables
were determined in L·min-1 STPD over the same period of the impedance data and their average was calculated every 30 seconds. The difference in O2arterial venous content (Dif.
a-vO2) was estimated based on the equation: Dif.a-vO2 = 5.721 + (0.1047 x %VO2max)7, and Q was estimated based on Fick’s equation (Q= VO2 / Dif.a-vO2).
Statistical procedure - The relation between the two methods was assessed by linear regression for the data at 50% of the maximum load (40-90%VO2max) and at maximal exertion (100%VO2max). The agreement between the methods was assessed based on the intra-class correlation coefficient (ICC), the limits of agreement and the differences between methods (biases) were assessed according to the methodology proposed by Bland and Altman19. The analyses were carried out using the STATA 8.2 and STATISTICA 5.5 software programs.
Results
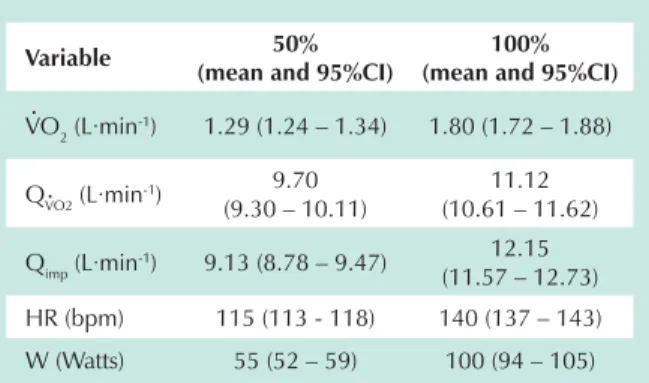
Table 1 presents the mean and confidence interval (95%CI) for the variables measured/estimated at 50% and 100% of the exertion load. Table 2 and Figures 1, 2, 3 and 4 present the data of the comparison between the two methods. At 50% of the load, the difference between the methods was 0.58 L·min-1 – corresponding to 6.3% in favor of the method of Stringer et al.7 – and with a limit of agreement of ± 2.54 L·min-1, corresponding to 24.7% (Tables 1 e 2; Figures 1 and 3). At maximal exertion, this trend, though slight, is reversed. The means presented a difference of 1.03 L·min-1 in favor of impedance cardiography, corresponding to 8.5% of the bias between the methods. The limit of agreement was ± 3.35 L·min-1, corresponding to 27.6% (Tables 1 and 2; Figures 2 and 4).
Discussion
When comparing different methods to measure the same variable, the values obtained will hardly agree in a perfect fashion, and provide identical results for all individuals. For this reason, selected among the members of thirteen senior citizen
centers in Brussels, Belgium. We used a random number table to define how many would be drawn in each center. The following exclusion criteria were applied before the final draw of the participants a) presence of cardiovascular, mobility and pneumopathological problems or recent surgeries; b) use of medication or substances that might affect acute cardiovascular physiological responses to exercise; c) use of food supplements; d) individuals who are substantially overweight (BMI > 35 kg/m2), smokers and athletes. A informed consent term was obtained prior to the subjects’ participation in the study, following the recommendation of the Helsinki Convention which was ratified in Brazil by Resolution no 196/96 of the National Health Council of Brazil on experiments with humans.
Exercise Protocol - The subjects performed a cardiopulmonary exercise test on a cycle-ergometer (Ergo-Line 900, D7474, UK). The testing protocol consisted of three phases: (a) three minutes of warm-up at 5 W; (b) work phase at 25 W for men and 20 W for women, with an incremental load equal to the initial load being added every two minutes, according to the gender; (c) five minutes of recovery, without load. The loads were selected according to the predicted maximum work capacity in order to obtain maximal exertion between 6 to 12 minutes of test, following the recommendation of theAmerican Heart Association14. The criteria of interruption of the test followed the recommendations of the American College of Sports Medicine15. The test was considered maximal when at least two of the following criteria were observed: (a) respiratory quotient (RE922 plateau despite the increase in load (increase in VO2POÃNJ-1·min-1 between the last two loads); (c) maximum voluntary exhaustion. The reproducibility of the protocol was previously tested in a subgroup of 12 elderly subjects (eight men and four women) randomly selected from the original sample.
Estimation of cardiac output based on impedance cardiography - Impedance cardiography was recorded on a Minnesota®(IFM 304b, USA) impedance recorder, with a tetrapolar configuration. The ECG and the HR were recorded on a Fukuda Denshi (FD-36, Japan) electrocardiograph,
and on a Fukuda Denshi(PL-16, Japan) phonocardiograph.
Hematocrit was quantified after a centrifugation process, and the blood sample was collected after the testing. Cardiac output (Q) and stroke volume were estimated every two minutes according to the following equation: Q (L·min-1) = 0.001 stroke volume (mL·syst-1)·HR (bpm). Considering that
the variation in thoracic impedance due to blood ejection is related with the ejection volume16, stroke volume can be calculated based on the equation: stroke volume (mL·syst-1) = (U)· (L/Z0)2·(LVET) ·(dz/dt), where U refers to blood resistivity
(ohm·cm);U = 53.2e 0.22Hct, where Hct is hematocrit17; L is the length between the signal detection electrodes (cm); Z0 is the baseline thoracic impedance (ohm); LVET is the left ventricle ejection time (second); and dz/dt is the rate of thoracic impedance change (ohm·seg-1). These equations have been previously validated by Miles and Gotshall8 and Bogaard et al.5 by comparison with direct measurements. The components of the equations presented were obtained according to previously described methods 18.
Variable 50%
(mean and 95%CI)
100% (mean and 95%CI)
VO2 (L·min-1) 1.29 (1.24 – 1.34) 1.80 (1.72 – 1.88)
QVO2 (L·min-1) 9.70
(9.30 – 10.11)
11.12 (10.61 – 11.62)
Qimp (L·min-1) 9.13 (8.78 – 9.47) 12.15
(11.57 – 12.73) HR (bpm) 115 (113 - 118) 140 (137 – 143) W (Watts) 55 (52 – 59) 100 (94 – 105)
W = Load; VO2 = O2 uptake; QVO2 = Estimated output based on O2
uptake; Qimp = Estimated output based on impedance; HR = Heart
Rate.
Table 1 - Descriptive data at different exertion intensities
. .
. .
. .
. .
.
. .
differ from one another. Actually, the cut-off point of what would be considered acceptable differences depends on the variable analyzed, and there are some variables that are believed to admit greater variability than others.
Some previous studies have used similar testing protocols in elderly subjects20, 21. And the choice of methods used to estimate Q in this study was determined considering its specific characteristics. Impedance cardiography was chosen in view of the fact that it is widely used. Although the method is based on some controversial premises5, 8 and is even not recommended by some authors22, its validity, accuracy and Bland and Altman19 proposed an approach to compare to what
extent a certain method differs from another. If the difference, which expresses the precision between the methods and the limits of agreement, which express the variability of measurements, are not elevated, there would be no problems, in principle, for the cross-interpretation of data (that is, comparing the data obtained by different methods). According to Bland and Altman19, for this type of cross-interpretation to be possible, it is at the discretion of the researchers to define to what extent measurements can
Load 50% 100%
Bias (mean and SD) – 0.577 ± 1.127 1.034 ± 1.674 Limits of agreement (2SD) ± 2.254 or ± 24.7% ± 3.348 or ± 27.6%
ICC 0.727 (p<0.01) 0.796 (p<0.01)
Linear regression Qimp=1.82+0.75QVO2
r2=0.765 / p<0.001
Qimp=0.93+1.00QVO2
r2=0.755 / p<0.001
ICC = intra-class correlation index; QVO2 = Estimated output based on O2 uptake; Qimp = Estimated output based on impedance.
Table 2 - Results of the comparison between impedance cardiography (IMP) and O2Uptake (VO2)
Fig. 1 -Bland Altman Plot of Q estimated based on IMP and VO2 at 50% of the
maximum load
Mean of methods
D
iffe
r
e
n
c
e
b
e
tw
e
e
n
th
e
m
e
th
o
d
s
Fig. 2 -Bland Altman Plot of Q estimated based on IMP and VO2 at 100% of
the maximum load.
Mean of methods
D
iffe
r
e
n
c
e
b
e
tw
e
e
n
th
e
m
e
th
o
d
s
Fig. 3 -Identity Plot of Q estimated based on IMP and VO2 at 50% of the maximum load.
Fig. 4 -Identity Plot of Q estimated based on IMP and VO2 at 100% of the maximum load.
.
. .
.
.
.
reproducibility have been documented by several studies3-5, 8, 9. As regards elderly subjects, the validity of the assessment
of Q by this method has not been sufficiently demonstrated. However, previous laboratory studies, involving more than 150 individuals above 60 years of age, did not reveal difficulties as to their applicability, in comparison with younger subjects. In fact, there were no significant differences in the quality of the signs obtained and the values usually measured generally do not depart from those reported in the literature for the age groups and intensity of exertion observed23.
The estimation of Q based on oxygen uptake is a relatively new method. It was developed by Stringer et al.7 in young individuals, based on the hypothesis that Dif.a-vO2 would increase in a predictable manner vis a vis the percentage of VO2max during exercise. Its major advantage is that it does not require the use of different pieces of equipment other than the ones used in cardiopulmonary exercise testing, or nonconventional maneuvers to take the measurements, which could facilitate its use in elderly subjects. This population would benefit from a less invasive estimate [method] that reflects the reality better during physical exercise.
Because it is a new method, the estimate of Q based on oxygen uptake lacks validation studies in elderly subjects. In the comparison with the direct measurement by Fick’s method in five young subjects doing an incremental to maximal exercise testing on a cycle-ergometer. Stringer et al.7 reported an r of 0.97 and a difference in the means between the values estimated and those effectively measured of ±2 L·min-1, corresponding to 15% of the measurement obtained directly. In a study similar to this one, comparing indirect methods, Kaplan et al.6 evaluated 23 subjects aged between 24 and 43, in that two were women. Of them, 11 subjects performed an exercise protocol in steady-state on a cycle-ergometer, beginning with 25-50 W and with increments of equal magnitude every 10-15 minutes, during a period of 45 minutes, to compare the values measured based on inductance cardiography and CO2 rebreathing. Another group of 20 subjects did a progressive ramp test, on a cycle-ergometer, with increments of 15–30 W·min-1 until exhaustion. In this case, the objective was to compare the values measured based on the inductance and O2 uptake. The authors reported limits of agreement of ± 2.8 L·min-1 in the first group, corresponding to a variability of 21%, and of ± 2.8 L·min-1 in the second group, corresponding to 22%.
Charloux et al.24 published a study in which they compared impedance cardiography with Fick’s Direct Method. Subjects with different clinical conditions participated in the study, with a total of 40 patients, of which 14 had sleep apnea and 26 had chronic obstructive pulmonary disease. The subjects performed steady-state exercise on a cycle-ergometer in supine position with loads between 10 and 50 W. The results revealed a difference of 0.29 L·min-1 between the methods and limits of agreement between -2.34 and 2.92 L·min-1; the authors reveal that in only 9.3% of the cases did the differences between the method exceed 20%.
Some studies have analyzed other methods. Davis et al.25, for instance, reported limits of agreement of ± 20% between CO2 rebreathing and Fick’s Direct Method in 18 patients with severe pulmonary disease. Espersen etEspersen et al.26 compared the methods of thermodilution and CO2 rebreathing with Fick’s Direct Method,
in 11 apparently healthy subjects during exercise performed at 50 W. The differences found were 2.3 and -0.2 L·min-1, respectively, between thermodilution and CO2 rebreathing and between the first one and Fick’s Direct Method. In another study analyzing the validity of a variation of the CO2 rebreathing method, Olszowka et al.27 reported, in 14 subjects, from rest to maximal exercise, coefficients of variation for mean values of Q between 3 and 4%, in comparison with the traditional method. The differences were between 3 to 5% in the comparison with Fick’s Direct Method and between 2 to 5% as regards the thermodilution. The same authors mentioned a similar study, of the same group, in which coefficients of variation between 11 and 22% were found in comparison between thermodilution and acetylene rebreathing. Finally, Tordi et al.28, in a recent study, compared non-invasive methods (impedance and CO2 rebreathing) in eight young men during three different bouts of steady-state exercise controlled by HR (120, 140 and 160 bpm). The authors reported an r of 0.85 and a mean difference of 0.06 L·min-1 (corresponding to 0.12 %) in the three intensities. In the lowest intensity, the mean of the values of Q estimated by impedance was lower than the estimated by CO2 rebreathing. However, this trend reversed in higher intensities. This behavior was explained by the authors as resulting from a limitation of the CO2 rebreathing method in steady-state conditions for high intensities, due to progressive acidemia (decrease in blood pH).
In this study, the estimates were compared at two different times, 50% and 100% of the maximal exertion load during incremental exercise. This strategy allowed the perception of a reasonable agreement between the methods (differences of# 6% to 8.5% and limits of agreement of # 24% to 28%), although the variation between the values obtained from both increase as the absolute values of Q increase. When approaching maximum values, Q estimated based on oxygen uptake tended to be lower than the Q measured by the impedance cardiography technique, and we also observed an upward trend of the difference between the values estimated according to the proximity to maximal exertion.
This behavior was similar to that observed by Tordi et al.28, in the comparison between impedance and CO2 rebreathing. Although these authors have justified this behavior in view of the limitations of the CO2 rebreathing method, we may theorize that, at higher intensities, the impedance method would tend to overestimate Q values in view of artifacts in the impedance curves measured. However, it becomes clear that absolute and relative values for differences and limits of agreement approach those obtained by other studies that compare direct and indirect methods to measure Q. Additionally, they fell within the ±15% range of variation reported in the work carried out by Miles e Gotshall8.
References
1. Stamford B. Exercise and the elderly. In: Pandolf K, editor. Exercise and sport sciences reviews. Baltimore: Batimore: Williams Wilkins, 1998: p. 341-79.
2. Panton L, Graves J, Pollock M, Garzarella L, Carroll JF, Leggett SH, et al. Relative heart rate, heart rate reserve, and O2 during submaximal exercise in the elderly. J Gerontol. 1996; 51: M165-M171.
3. Pianosi P, Garros D. Comparison of impedance cardiography with indirect Fick (CO2) method of measuring cardiac output in healthy children during exercise. Am J Cardiol. 1996; 77: 745-9.
4. Sackner M, Hoffman R, Krieger B, Shaukat M, Stroh D, Sackner J. Thoracocardiography. Part 2: Noninvasive measurement of changes in stroke volume; comparisons to impedance cardiograph. Chest. 1991; 99(4): 896-903.
5. Bogaard H, Woltjer H, Postmus P, de Vries P. Electrical impedance cardiography: Method and validation. Physiol Meas. 1997; 18: 95-105.
6. Kaplan V, Bucklar G, Bloch K. Noninvasive monitoring of cardiac output during exercise by inductance cardiography. Med Sci Sports Exerc. 2003; 35 (5): 747-52.
7. Stringer WW, Hansen JE, Wasserman K. Cardiac output estimated noninvasively from oxygen uptake during exercise. J Appl Physiol. 1997; 82(3): 908-12.
8. Miles D, Gotshall R. Impedance cardiography: noninvasive assessment of human central hemodynamics at rest and during exercise. In: Pandolf K, editor. Exercise and sport sciences reviews. Baltimore: Williams & Wilkins; 1989: p. 231-63.
9. Woltjer H, Bogaard H, de Vries PM. The intra- and interobserver variability of impedance cardiography in patients at rest and during exercise. Physiol Meas. 1996;17 (3): 171-8.
10. Woltjer HH, Bogaard HJ, Scheffer GJ, van der Spoel HI, Huybregts M, de Vries P. Standardization of non-invasive impedance cardiography for assessment of stroke volume: comparison with thermodilution. Br J Anaesth. 1996; 77(6): 748-52.
11. Tochikubo O, Ishii M, Minamisawa K, Miyajima E, Kuji N, Saitoh J, et al. Fully automatic, nonivasive measurement of cardiac output by means of the CO2 rebreathing method and its clinical application to hypertensive patients. Jpn Heart J. 1990; 31:461-76.
12. Pothoff G, Wasserman K, Winter UJ, Geyer D, Hilger HH. Non-invasive measurement of stroke volume in steacy-state and unsteady-state workload with CO2 rebreathing. Z Kardiol 1994; 83(suppl 3): 67-71.
13. Laszlo G. Respiratory measurements of cardiac output: from elegant idea to useful test. J Appl Physiol. 2004; 96(2): 428-37.
14. Fletcher GF, Balady GJ, Amsterdam EA, Chaitman B, Eckel R, Fleg J, et al. Exercise Standards for Testing and Training - A Statement for Healthcare Professionals From the American Heart Association. Circulation. 2001; 104: 1694-740.
15. ACSMs guidelines for exercise testing and exercise prescription. 6th ed. Philadelphia: Lippincott, Williams & Wilkins; 2000.
16. Penney BC. Theory and cardiac applications of electrical impedance measurements. CRC Crit Rev Biomed Eng. 1985; 13: 227-81.
17. Geddes L, Sadler C. The specific resistance of blood at body temperature. Med Biol Eng. 1973;(11): 336-9.
18. Vanfraechem J. Stroke volume and systolic time interval adjustments during bicycle exercise. J Appl Physiol. 1979; 46: 588-92.
19. Bland M, Altman DG. Statistical methods for assessing agreement between two methods of clinical measurement. Lancet 1986: 307-10.
20. Bovens A, van Baak MA, Vrencken J, Wijnen J, Saris W, Verstappen FT. Maximal aerobic power in cicle ergometry in middle-aged men and women, active in sports, in relation to age and physical activity. Int J Sports Med. 1993; 14: 66-71.
21. Brischetto M, Millman R, Peterson D, Silage D, Pack A. Effect of aging on ventilatory response to exercise and CO2. J Appl Physiol. 1984; 56: 1143-50.
22. Warburton D, Haykowsky M, Quinney HA, Humen DP, Teo K. Reliability and validity of measures of cardiac output during incremental to maximal aerobic exercise. Part II: Novel techniques and new advances. Sports med. 1999; 27(4): 241-60.
23. Farinatti P, Vanfraechem J. Influence of age and sex on the relationship between cardiac output and oxygen uptake during physical effort. In: VIII European Group for the Research into Elderly and Physical Activity - Physical Activity and Ageing - Proceedings. 8th EGREPA International Congress; 2000. Bruxelas: Universidade Livre de Bruxelas; 2000. p. 107-10.
24. Charloux A, Lonsdorfer-Wolf E, Richard R, Lampert E, Oswald-Mammosser M, Mettauer B, et al. A new impedance cardiograph device for the non-invasive evaluation of cardiac output at rest and during exercise: comparison with the “direct” Fick method. Eur J Appl Physiol. 2000; 82(4): 313-20.
25. Davis C, Jones N, Sealey B. Measurements of cardiac output in seriously ill patients using a CO2 rebreathing method. Chest. 1978; 73(2): 167-72.
26. Thomsen JK, Eliasen K, Olsen NV, et al. Espersen K, Jensen E, Rosenborg D. Comparison of cardiac output measurement techniques: thermodilution, Doppler, CO2-rebreathing and the direct Fick method. Acta Anaesthesiol Scand. 1995; 39(2): 245-51.
27. Olszowka AJ, Shykoff BE, Pendergast DR, Farhi LE. Revised one-step method for determination of cardiac output. Respir Physiol Neurobiol. 2004; 140(1): 99-109.