i
How do consumers react
differently to a brand owned by a
New Digital Influencer
compared to a traditional Brand,
in the high-end beauty segment?
Helena Holstein Beck
Dissertation written under the supervision of Daniela Langaro
Dissertation submitted in partial fulfilment of requirements for the MSc in Strategic
Marketing, at the Universidade Católica Portuguesa, 7
thof June of 2019.
ii
English) Abstract
Dissertation Title: How do consumers react differently to a brand owned by a New Digital Influencer
comped to a traditional one, in the high-end beauty segment?
Author: Helena Holstein Beck
Key Words: influencer, cosmetics, high-end, purchase intention, brand attitude, WOM, engagement.
The present thesis aims at studying and comparing reactions consumers have towards two types of brands: a traditional brand, one that has been in the high-end beauty segment for generations, and a brand owned by a New Digital Influencer -NDI - in the same segment.
A New Digital Influencer is someone who gathers a large online following, who has their audience’s trust by posting reliable content. The goal was to understand consumers’ reactions in Purchase Intention, Brand Attitude, Word-of-Mouth, and Engagement. Furthermore, high-end stands for “very
good quality” and “expensive”, being this the criterion applied to select the studied brands.
Following the Literature Review, a quantitative research was performed. An online questionnaire targeted at women who are on social media and who don’t reject recommendations from influencers was considered the ideal approach. An experimental in-between groups design was conducted with respondents being randomly allocated either to the traditional brand, or to the brand owned by an NDI.
Research Questions were answered by performing a Kruskal-Wallis test, where both groups were considered statistically different in three of the four dimensions analysed. Furthermore, the traditional brand has higher scores for Purchase Intention and Word-of-Mouth; for Engagement the public engages more with a brand owned by an NDI; and for Brand Attitude the reaction by consumers is equal for both brand types. All these discoveries are justified with previous literature.
The gap in academic literature has been significantly reduced. Also, it is confirmed: influencers are a possible competitor in the retail industry.
iii
(Português) Resumo
Título: No mercado de cosmética de luxo, de que maneira reagem os consumidores a uma marca
lançada por um “New Digital Influencer” em comparação uma que já exista no mercado e esteja estabelecida?
Autor: Helena Holstein Beck
Palavras-chave: influencer, cosmética, luxo, intenção de compra, atitude marca, Boca-a-Boca,
interação.
A presente tese pretende estudar e comparar a reação de consumidores a dois tipos de marcas: uma marca tradicional, marca presente no mercado de beleza de luxo há gerações, e uma marca lançada por um Novo Influenciador Digital – NDI- no mesmo segmento.
Novo Influenciador Digital é alguém que ganha uma rede de seguidores considerável online, que
detém a confiança dos mesmos através da postagem de conteúdo confiável. O objetivo traçado foi o de compreender a reação de consumidores em termos de Intenção de Compra, Atitude com a Marca, Boca-a-Boca e Interação. Ainda, o conceito de luxo é “alta qualidade” e “caro” pelo que foi este o critério utilizado na seleção das marcas estudadas.
Posteriormente à Revisão de Literatura, foi efetuada uma análise quantitativa. Um questionário online tendo como alvo mulheres ativas nas redes sociais, que não rejeitam influenciadores foi considerada a abordagem ideal. Foi feita uma experiência entre grupos na qual os respondentes foram aleatoriamente alocados à marca tradicional, ou à marca lançada por um NDI.
As Perguntas de Pesquisa foram respondidas através do teste de Kruskal-Wallis, e os dois grupos foram considerados estatisticamente diferentes em três dimensões. A marca tradicional obteve resultados mais elevados em Intenção de Compra e Boca-a-Boca; Interação com uma marca lançada por um NDI é superior; Atitude com a Marca é igual em ambos os grupos. Os resultados foram justificados de acordo com a literatura.
A lacuna na literatura académica foi significativamente reduzida, e é possível afirmar: influenciadores são possível concorrência no mundo do retalho.
iv
Acknowledgments
First and foremost, I would like to thank my parents and my grandparents that made this all possible for me. Their interest and constant support were crucial so that I was able to reach this state of proficiency in a certain area. Thank you.
Second, my boyfriend João for being a constant support through every stage.
My sister Teresa was of incalculable help throughout this entire process, and without her I certainly could not have done it.
My closest family and friends, who might have taken a hit through this time, but who I promise to make up to!
Last, but certainly not least, the two teachers who helped me throughout this process: Professor Daniela Langaro and Professor Isabel Moreira. Thank you for your patience and kindness, and especially your help.
v
Contents
English) Abstract ... ii
(Português) Resumo ... iii
Acknowledgments... iv
Table of Tables ... vii
Table of Figures ... viii
Table of Abbreviations ... ix 1. Introduction ... 10 1.1. Problem Statement ... 13 1.2. Research Objectives ... 13 1.3. Research Questions ... 14 1.4. Scope of Analysis ... 14 1.5. Thesis organization... 14 2. Literature Review ... 16
2.1. Social Influence Theory ... 16
2.2. The Online Social Environment ... 17
2.2.1. Online Social Networks ... 17
2.2.2. Social Media Platforms ... 18
2.2.2.1. Luxury and Social Media ... 19
2.3. eWOM ... 19
2.4. New Digital Influencers ... 20
2.5. Engagement... 22
3. Methodology ... 24
3.1. Research Approach... 24
3.2. Research Instrument ... 25
3.2.1. Population of the study ... 25
vi
3.2.3. Questionnaire ... 26
3.2.4. Measures ... 31
4. Results’ Analysis ... 32
4.1. Preliminary Analysis ... 32
4.1.1. Data collection and Analysis ... 32
4.1.2. Sample Characterization ... 32
4.1.3. Data Screening: Univariate Outliers, Multivariate Outliers ... 35
4.1.4. Data Reliability ... 36
4.1.5. Principal Component Analysis (PCA) ... 37
4.1.6. Scale Correlation analysis (Pearson) ... 39
4.1.7. Kruskal-Wallis Test ... 40
4.2. In-depth Analysis ... 41
5. Conclusions ... 43
5.1. Academic Implications ... 43
5.2. Managerial Implications ... 43
5.3. Limitations and Future Research ... 44
6. References ... 46
vii
Table of Tables
Table 1: Stimuli of online questionnaire. ... 28
Table 2: Univariate Outliers. ... 35
Table 3: New Cronbach’s alphas. ... 38
Table 4: Pearson Correlation coefficient for Word-of-Mouth ... 39
viii
Table of Figures
Figure 1: Luxury goods’ price premium relative to Europe (%) ... 11
Figure 2: European Luxury brands’ Share prices ... 11
Figure 3: Global evolution of Luxury Goods’ industry throughout the years ... 12
Figure 4: Country of origin of respondents ... 33
Figure 5: Age of respondents... 33
Figure 6: Occupation of respondents ... 34
Figure 7: Educational Level of respondents ... 34
ix
Table of Abbreviations
1. OSN: Online Social Network 2. NDI: New Digital Influencer 3. WOM: Word-of-Mouth
4. eWOM: Online Word-of-Mouth 5. UGC: User Generated Content 6. PCA: Principal Component Analysis
10
1. Introduction
OSN’s (Online Social Networks) increasingly serve as an important way for brands to interact with interesting audience segments (Murdough, 2009). One way that brands use to communicate online is though Influencers (in this paper they will be referred to as New Digital Influencers, NDI’s), asking them to review products sent to them. A staggering 89% of consumers state that reviews influence their purchasing decision (e-tailing group, 2012). “Influentials” may drive product diffusion (Katz & Lazarsfeld, 1955; Katz, 1957; Merton, 1968; Gladwell, 2000), being this one of the reasons why so many companies rely on this form of communication to promote their launches.
Many NDI’s have managed to gather a large following, through basic characteristics appealing to the great public. Katz (1957) characterized the dimensions of opinion leaders on three characteristics: “personification of certain values (who one is); competence (what one knows); and strategic social location (whom one knows)” (73). Uzunogly E., & Kip S. (2014) supported this theory by adding that Personification stands by traits and values of someone; Competence refers to how proficient on the given subjects are the opinion leaders; Social Location is related to the breadth of their network, in particular the network that values their knowledge on the given field.
By managing to collect and keep a substantial following, some NDI’s have launched their own products and brands. Some of these brands are reaching outstanding market shares. The present academic paper aims at studying how consumers react to these launches. It is going to be shown, in the luxury beauty (cosmetics and skincare) segment, the difference in consumer behaviour towards these “influencer brands” in comparison to brands that are more traditional. There is no academic literature regrading this topic, being this the main reason for research. To one’s knowledge, the only sources of information on influencers (in this case, celebrities, not NDI’s) launching their products are non-academic ones. These are somewhat comparable in the way that celebrities are people turned into a brand, but not quite applicable in this case due to context. Some influencers have launched products and started brands in the fast market, but these cases haven’t been studied yet.
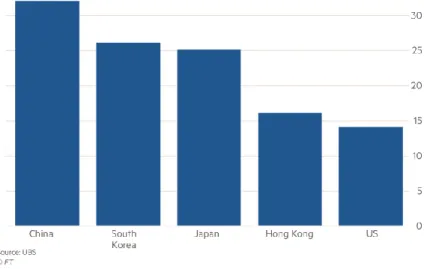
China has been a power-force in the luxury goods’ market (Agnew H., 2019). However, this tendency is reversing as authorities are now imposing taxes on goods bought abroad, in order to avoid daigou1
(Whiffin A., 2018). This change has forced a drop in the premium between prices in China and other
1 Network of Chinese tourists and nationals living overseas re-sell highly sought-after consumer goods originally
11
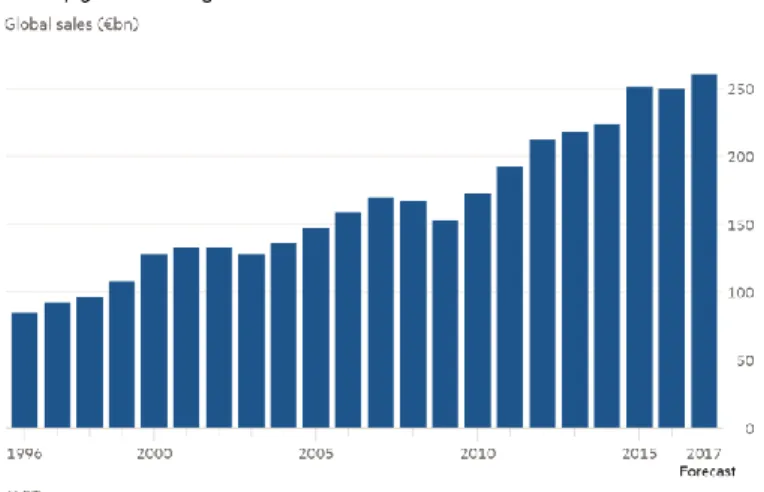
countries (Figure 1). According to Financial Times (2019), these changes have been causing an on-going dispute between US and China that might slow down the sector’s growth. During the past month of October 2018, the share prices of the sector’s biggest names decreased, on average, 12 per cent (Figure 2). For the past 22 years, the global luxury industry has tripled in size (Figure 3), having consultants like Bain & Co saying that by 2025 the industry will be worth €390bn (in 2018 it was worth €280bn) (Sanderson R., 2018).
Figure 1: Luxury goods’ price premium relative to Europe (%) Source: 1 Financial Times by Whiffin A., 2018
Figure 2: European Luxury brands’ Share prices Source: 2 Financial Times by Whiffin A., 2018
12
Figure 3: Global evolution of Luxury Goods’ industry throughout the years Source: 3 FT Series Europe's corporate comeback by Sanderson R., 2018
In the beauty market, the current scenario is rather interesting and dynamic. The younger cohort of consumers are looking for new products and brands, “rejecting the large brands their parents preferred and seeking out locally-made, artisanal, natural products in all consumer categories” (Kestenbaum, R., 2018). Although there is demand for these smaller companies, bigger and more traditional ones are acquiring smaller companies so that competition in non-existent, thus augmenting their market share.
Focusing on the beauty segment of the luxury goods’ market, the geographic tendency for growth is opposite to the one presented above: China and Japan are now overpowering US’ sales in high-end beauty and skincare products. Increasing demand for L’Oréal luxury products, ie. Kiehls, Giorgio Armani, Vichy, has boosted demand for the company’s competitors like Estée Lauder and LVMH’s Sephora (Agnew H., 2018).
In Portugal, brands in this segment are marketing a different message than they were previously. Jornal Expresso (Unknown author, 2018) says the goal is to steer away from perceived “negative” words such as anti-aging and focus on more “positive” terms like regeneration, renovation, glow. This change is occurring due to millennials having a great buying power in today’s days, and them understanding there is no need for treating ani-aging. Millennials are the ones increasing sales, due to globalization and to the so called “Lipstick Effect”2 (Nunes C., 2018). At L’Oréal Portugal, home
to brands like Lâncome, Giorgio Armani, Kiehls, among others, managers are stating that women are
13
now wearing makeup and skincare at a level never seen before, mainly thanks to millennials using themselves and influencing others (Nunes C., 2018).
1.1. Problem Statement
In a world where companies are changing the way they are communicating with customers, shifting from traditional advertising like billboards, magazines, etc., to digital forms of communication, it is crucial for marketing teams to understand what triggers consumers to want to buy their product or to feel connected to their brand. In addition to this, in this constantly changing world of media, Influencers are gaining a power within online communities that has never been seen before.
“Influentials” can conduct product diffusion (Katz & Lazarsfeld, 1955; Katz, 1957, Merton, 1968; Gladwell, 2000). Moreover, opinion leaders can be said to have a great sized network, to be crucial in influencing others (Weimann, 1994) and to be considered as a source of wisdom and guidance (McQuail & Windahl, 1993) to peers. However, little research has been done on how consumers react to products/brands owned by these New Digital Influencers.
The present thesis has as its main investigation purpose to study in what way do consumers react differently to a brand owned by a New Digital Influencer compared to one that has been on the luxury beauty market for generations, from here onwards denominated as traditional brand. For example, how do consumers react in terms of purchase intention: Dior vesus a hypothetical comparable brand owned by Chiara Ferragni3.
1.2. Research Objectives
In order to study the Research Problem presented above, one should aim at understanding in what way do people react to traditional brands in comparison to brands owned by New Digital Influencers, in terms of Purchase Intentions, Attitudes, Word-of-Mouth, and Engagement.
14
1.3. Research Questions
According to Andrews R. (2003), Research Hypothesis are thought to be more precise than Research Questions. But they also require a certain degree of previous knowledge, which in the present case did not exist. Research Questions may be asked on a basis of no prior knowledge. This leads one to believe Research Questions are the most advisable option.
As a way of achieving the objectives declared, the following Research Questions ought to be answered:
o RQ1: What is the impact of NDI’s/traditional brands on purchase intention? o RQ2: What is the impact of NDI’s/traditional brands on attitudes?
o RQ3: What is the impact of NDI’s/traditional brands on WOM? o RQ4: What is the impact of NDI’s/traditional brands on engagement?
1.4. Scope of Analysis
In order to provide a pioneer approach to the study, the market considered is the luxury beauty industry.
1.5. Thesis organization
The present academic paper is composed of six main chapters. Before chapter 1 (Introduction), one can find an Abstract both in English and in Portuguese, followed by Acknowledgments and then by tables of: contents, tables, figures, and abbreviations.
In the first chapter, Introduction, it is defined the Problem Statement that is being studied here, the Research Objectives to solve that problem and the corresponding Research Questions. In addition to this, it is present briefly the scope of analysis of the research study.
The second chapter is the Literature Review, which is divided in the topics that provide an extensive knowledge about the issues presented in the Research Questions.
The following section explains in detail the methodology used to conduct the research and the collection of data. Subsequently, in the fourth chapter, the Results obtained with the collection of data
15
are analysed and interpreted. Then, some final Conclusions are derived, namely academic and managerial implications, as well as limitations as future research.
For anyone who wishes to consult any of the ideas presented here, all References are presented in chapter six.
16
2. Literature Review
2.1. Social Influence Theory
Many authors have studied Social Influence, that is how people affect their peers.
In 1958, Kelman belownoted that the shifts in attitudes and behaviours produced by social influence may occur at different “levels”. Depending on how much influence is accepted by the individual, one can distinguish three levels of social influence: compliance, identification, and internalization.
• Compliance occurs when someone accepts influence in hopes to obtain a positive outcome (approval, belonging, or simply no punishment), not because he/she believes in the content subject to influence. The influence will only occur while the influenced subject is under surveillance;
• Identification exists when someone accepts influence because he/she may either try to act like the other person or try to establish a reciprocal relationship. The author verified that, since this type of influence is based on attractiveness, it only verifies under conditions of salience; • Internalization happens when a person conforms due to identification between the subject of
influence and their own core values. The author is credible, and influence will only be accepted when the issue is relevant, regardless of surveillance or salience.
Brands ought to assess what kind of changes happen in consumers’ attitudes: are they superficial changes (ones that dissipate after a short period of time, i.e. a word), or permanent changes (ones that act upon behaviours and beliefs). In order to know how attitudes will evolve in the future, one should always understand what kind and how deep the changes that occurred were (Kelman, 1958). Depending on the attributes of the product used to exert influence, these can enable or constrain the level of influence exerted (Aral, 2011). Depending on the degree of importance of the attributes, the degree of conformity will also vary.
In some cases, there may not be a lot of knowledge on what happens if someone conforms to social influence. In these cases, individuals rely on their closest peers to determine the most appropriate decision (Aral, 2011). This happens with more important decisions.
Although the depth of influence is rather important, its breadth is no less. Dodds & Watts (2004), highlighted that the longer individuals around me see me using a product, the more likely it is for them to be influenced (non-voluntarily) to use it. This happens due to cumulative exposure. This is
17
called “contagion”, and it lasts if the consumers keep using and talking about it. The opposite also occurs, that is if an individual has a bad experience with a product and forms a negative impression about it, he/she may influence others to stop using it (Aral, 2011). This shows that, the more negative things people hear about the product, the more people will not want to use it.
Having looked through the different levels of influence (compliance, identification, internalization), one should look at what makes individuals vary in between these levels. Kelman (1958) suggests there are three key aspects that determine whether an individual accepts influence or not, and to what extent: the relative importance of the anticipated effect, the relative power of the influencing agent, and the potency of the induced response.
2.2. The Online Social Environment
2.2.1. Online Social Networks
Network effects can either accelerate product diffusion due to the “bandwagon effects” (Economides & Himmelberg,1995), or slow initial adoption rates due to people wanting to see what their peers will do (Farrell & Saloner, 1986; Goldenberg et al., 2010).
Online Social Networks, have brought an ease in creating and sharing content with peers who have comparable interests (Uzunogly E. & Kip S., 2014). Nowadays, brands recognize the importance of social media as it represents a key channel for them to communicate with their audience (Murdough, 2009).
OSN’s (Barreda, A.A. et al., 2015) allow people, right from their homes, to express their own thoughts and opinions, interact with others, form social communities, and share experiences (Ip, Leung, & Law, 2011). This portrays the freedom people love to have and that makes OSN’s such a powerful tool to companies.
Social Networks have acquired a status that makes them indispensable for brands to invest in. The younger generations were the first to adopt and utilize digital media (Lewis, 2009; McCreanor et al., 2005), therefore, they have become proficient in using it.
Nowadays, brands create their own pages and interact with consumers. In these interactions, brands should make their messages user-centred and not message-centred (Chi, 2011). This shows that users
18
are self-absorbed, meaning they will pay more attention to content that is related to them rather than to content that is related to the brand exclusively. Brands should find a way to always relate the message they are trying to pass on to consumers with that same target group of consumers. Although there ought to be a combination of both previously stated factors (consumer needs and brand message), the latter one can never be different from the truth. Since the consumer is not in direct contact with products or the brand, trust is decisive in order to maintain a long-term satisfaction relationship (Coppola, Hiltz, & Rotter, 2004; Metzger, 2004).
One other rather important factor is the Self-expansion Theory. This theory suggests “consumers communicate with and about brands due to overlapping identities and parasocial relationships with the brands.” This shows brands can potentially be harmed in case consumers feel brands don’t interact with them or that they engage in behaviour that is inconsistent with consumers’ core values (Huang & Mitchell, 2014).
In 2002, Luo concluded that the three most decisive factors in consumers using OSN’s are: need for entertainment (need for escapism, hedonism, aesthetic enjoyment, emotion); need for information (need for resources and helpful information); and need to relax (irritation is a demotivator, so consumers need to avoid distractions; anxiety; things that dilute human experiences).
2.2.2. Social Media Platforms
Social media is highly related to the concept of Web 2.0, which roots back to O’Reilly (2007) who realized that the companies that had survived the dot-com bubble in 2001 seemed to have some principles and practices in common. Above anything, Web 2.0 pages allow and encourage the creation of user-generated content and interaction between people.
Brands can take advantage of social media by establishing an online brand community, which is a “specialized, non-geographically bound community, based on a structured set of social relations among admirers of a brand” (Muniz & O'Guinn, 2001, p.412). The most popular social media platforms today are Twitter, Facebook, and YouTube as they allow for internet users to interact, express, share and create content about anything, including brands. On YouTube, consumers may watch or post a video about a product/brand, on Twitter they may talk about it, or they may upload pictures about it on Facebook (Micu C.C. et al., 2019). This is what one calls User Generated Content (UGC) and it is, in general, brand related (Arnhold U., 2008) and has the power to change and influence consumers’ brand perceptions (Christodoulides G. et al., 2012).
19
Brand-related UGC differs across these three social media platforms on some dimensions, such as brand focus, information, and brand connection (Smith et al., 2012), which means that each platform should be used for different purposes.
In their 2012 study, Micu C.C. et al. found that in what concerns utilitarian (functional) products, YouTube seemed to provide several advantages over Facebook and Twitter, as it is more prone to positive feedback and it takes more effort to participate. For hedonic (emotional) products, Facebook is the best, as it provides more information not only about experiential consumption (through experiential beliefs), but also about factual, functional brand information (though functional beliefs). Additionally, Facebook seems to offer more opportunities for brands to collaborate with customers to talk about their positive feelings about their own hedonic products.
2.2.2.1. Luxury and Social Media
Phan M. et al. (2011) studied Burberry’s social media strategy. As the brand’s revenues had been decreasing, some changes were made to the brand both strategically and operationally. Part of this new strategy was to increase digital media expenditures from 1,5% (in 2008) to 40% (in 2010). In addition to regularly posting news, pictures and videos on Facebook, Twitter and YouTube, Burberry launched its own web site, called Art of the Trench in October 2009, where consumers are encouraged to share their own pictures and stories. The ability to create content and to become a featured part of the website, creates a sense of belonging and affinity to the brand (Phan M. et al., 2011). Industry expert Phipps B. (2009), is of the opinion that F-commerce (or Facebook commerce4) is greatly
important, as it helps consumers to engage even deeper with the brand by creating more frequent connections.
2.3. eWOM
Word-of-mouth is a common and highly effective marketing tool (Munzel & Kunz, 2014), as it is product/service information that can flow between consumers (Brown et al., 2005). It is therefore considered as being their own experience and their own honest opinion, not fabricated by companies.
20
In today’s world, WOM has acquired a rather important position in the online context as it is one of the most effective ways of advertising (Enos, 2001). Online WOM is also known as eWOM.
eWOM is, in general, considered to be more trustworthy when compared to other messages released/advertised by companies (Uzunogly E. & Kip S., 2014). It allows the world to know about consumers’ honest opinions and about their experiences with the product/service (Wu & Wang, 2011). This tells us that eWOM reaches a much greater public and has the power of anyone being able to say anything they want about anything, making it one of the most powerful marketing tools of today. The main factor for this power attribution is that, usually, companies don’t have influence over it (Berthon, Pitt, & Campbell, 2008; Brown, Broderick, & Lee, 2007).
There are two types of eWOM: positive and negative. In this paper, these topics won’t be researched any further as they are not relevant for the subject.
2.4. New Digital Influencers
Offline, influencers are individuals perceived as being persuasive experts in a given topic, and as people who have an ease in making connections and establishing a network (Gladwell, 2000; Goldenberg et al., 2009). In the digital era, this definition has been greatly magnified in the sense that these individuals now have a tool that allows them to have great visibility, thus, great power. This power has been critical in conducting product diffusion (Katz & Lazarsfeld, 1955; Katz, 1957; Merton, 1968; Gladwell, 2000), and keeping followers interested (Gruhl et al., 2004).
The two-step flow theory (Katz & Lazarsfeld, 1955), defines opinion leaders as people who receive information and then disseminate it, this way increasing their influence. New Digital Influencers can be seen as individuals who are online opinion leaders, people who others look up to, respect (Weimann, 1994), listen to, and follow (McQuail & Windahl, 1993). Nisbet & Kotcher (2009) suggest the source of power possessed by NDIs5 is Identification – in Kelman’s (1958) Social Influence
Theory - because he/she acts “as the connective communication tissue that alerts their peers to what matters among political events, social issues, and consumer choices”.
In 1962, Rogers defended the Diffusion of Innovation theory, where an innovation may be spread through five different consumer profiles over time: innovators, early adopters, early majority, late majority, and laggards. In 2003, Rogers made an interpretation of his own model stating that opinion
21
leaders are identical to the early adopters’ segment of an innovation in products/services. When it comes to product diffusion, in particular, Aral et al. (2009), attribute over 50% of influence to occur due to homophily6.
Brands are now acknowledging how powerful influencers are (Uzunogly E. & Kip S., 2014). NDI’s are identified by companies, and brands have the task of getting them to spread the brand message that the public must see (Aral, 2011). In 2014, Uzunogly E. & Kip S., adapted the two-step-flow theory. In their digital interpretation, the influencer is crucial in spreading the brand message to the target audience, and to the non-target audience who will pass it on to their friends. Furthermore, influencers can potentially create viral effects, thus making it crucial to brands to maintain a close relationship with them (Uzunogly E. & Kip S., 2014).
One major factor that attracts the public to NDI’s is their authenticity. If an influencer can maintain a status of being “trustworthy” and “authentic”, he/she possesses great power (Uzunogly E. & Kip S., 2014). Most brands advertise through NDI’s as they can show their real reactions, opposite to conventional media who tend to fabricate more their opinions (Uzunogly E. & Kip S., 2014).
There are a few criteria that brands have in mind when targeting NDI’s (Uzunogly E. & Kip S., 2014): • Blogger and brand match: the influencer should be relevant to the brand and be able to
increase brand equity;
• Tone of voice: the behaviour/style of the influencer should be in line with the brand identity; • Number of followers;
• Content: engaging content, speaking with expertise to a broad spectrum of people;
• Reliability: the trust an influencer portrays is an asset to brands, as it allows him/her more persuasive power;
• Popularity.
6
The tendency to form strong social connections with people who share one’s definingcharacteristics, as age, gender, eth nicity, socioeconomic status, personal beliefs, etc.: political homophily on social media.
22
2.5. Engagement
In Online Social Networks (Barreda, A.A. et al., 2015), consumers’ engagement may be passive or active: passive, if it involves simply consuming the social content; active if it includes behaviours such as submitting consumer-generated stories (Hutton & Fosdick, 2011), or commenting.
In what concerns the concept of brand-consumer engagement, many academic researchers have studied this topic. Engagement can be said to be about emotional and affective commitment (Mollen & Wilson, 2010), participation and connection (Vivek, Beatty, & Morgan, 2012), interactions (Stringer, 2006; Mollen & Wilson, 2010), and collaborative creation (Vargo & Lusch, 2004). In a digital approach, the decisive factors for influencer engagement are trust and mutual understanding (Uzunogly E. & Kip S., 2014). In 2007, Rappaport determined two key aspects in engagement, that seem common to all other studies made: “emotional connection” and “brand relevance”.
Emotional Connection
Nowadays, most companies use social media as a big player of their marketing strategies, as the ones that do so have more followers and higher engagement scores, and as it is related to financial success (Ashley C. & Tuten T., 2015). Since this is a rather recent phenomenon, not a lot is known about how to develop messages that create an emotional connection with the consumer, whilst maintaining brand identity (Ashley C. & Tuten T., 2015). Emotional/psychological engagement is crucial when developing a campaign, as consumers become active participants rather than passive (Schmitt, 2012); it is directly related to consumers’ needs, purposes, and goals (Ashley C. & Tuten T., 2015).
Sinha et al. (2011) concluded that once social media increases the knowledge a consumer has about a brand, so does the emotional connection, regardless of the nature of the communications made by the brand (functional or emotional).
Many studies have been made concerning the type of messages that each group of consumers (high/low involvement) responds best to. When consumers are in the high-involvement category, they are emotionally attached, whereas low-involvement consumers aren’t. So, high-involvement consumers react best to functional messages, and low-involvement consumers to transformational messages, in order to connect (Areni, 2003; McMillan et al., 2003).
23
Jahn & Kunz (2012) studied engagement between consumer-brand on Facebook and discovered that the functional and emotional content were both drivers for engagement. This can be explained by the
Uses and Gratification Theory, that says human beings have an inclination for messages oriented to
content, relationships, and self (Luo, 2002).
Brand Relevance
Campaigns with social objectives that are supported by brands contribute for the establishment of the relationship of the consumer with that same brand, as they are a common ground (Murdough, 2009) – consumer associates the brand in his/her memory with this common ground, with thoughts, feelings, perceptions, images, and experiences (Keller, 2009). These types of campaigns encourage consumers to give feedback that marketers should take advantage of, and they also persuade consumers to engage with online content (Murdough, 2009). Once marketers are in consumers’ minds, they may be able to influence brand attitude, as well as to provide consumers content to share online, thus engaging (Ashley C. & Tuten T., 2015). For NDIs, coherent content and integration across platforms, increases follower engagement, popularity, messages, number of followers, and effectiveness (Uzunogly E. & Kip S., 2014).
When marketers focus on engagement, the brand’s messages go from being transactional to interactional, where the brand becomes part of the consumers’ personality and character (Ashley C. & Tuten T., 2015). In this case, the consumer engages with the brand in self-relevant ways (Schmitt, 2012), meaning the value of interactions with the brand will be consumer relevant.
In 2015, Ashley C. & Tuten T. found that consumers’ engagement depends on five factors: valence (value), form (type of resources utilized), scope (temporal and geographic), impact, and customer goals for engagement. Timing and dialogue with the consumer are crucial, since consumers use social media to build social capital and contribute to their psychological wellbeing.
Regardless of the reason for engagement, marketers ought to intervene and engage with their consumers, encouraging them to give feedback, to comment, to rate products, and to review. This alone represents added value for consumers and promotes long-term relationships with current and potential consumers (Phan M. et al., 2011).
24
3. Methodology
3.1. Research Approach
Traditionally, there are three possible research methods one may use (Saunders et al., 2009): exploratory studies, explanatory studies, and descriptive studies.
Exploratory Studies
Exploratory research is utilized when the researcher doesn’t have a lot of understanding of the issue due to it not having been thoroughly studied before. There are three ways to conduct this type of research: through literature, by interviewing experts, or by conducting surveys (Saunders et al., 2009). In the present research, the exploratory type of study was applied in the initial stage: the literature review. There was not a deep knowledge on the subject, and a lot of topics had to be studied.
Explanatory Studies
According to Saunders et al. (2009), in what concerns Explanatory research, the goal is to establish connections between variables. In other words, the researcher aims at discovering if one variable determines the values/reactions of the other variables. The methods utilized to conduct this type of research are usually surveys or experiments.
Once again, the explanatory type of research was also used for the conduction of the online survey as the approach used in performing the self-administered online questionnaire was the following: respondents were part of an in-between groups experiment, where they were randomly assigned to one group - either a traditional Brand, or an NDI’s brand.
Descriptive Studies
Lastly, there are Descriptive studies, which are useful when the goal is to obtain an exact profile of people/events/situations. This may be a combination between Exploratory and Explanatory research. The methods to perform this type of research are through literature, surveys, panels, and observation. It is possible to characterize this type of study as ideal to provide:
25
• Relevant characteristics of groups; • Consumer evaluations of attributes;
• Degree to which marketing variables are associated with each other; among others.
Descriptive studies were also used during the process, to decode the data from de survey.
As it has been stated previously, whether influencers are or aren’t a competition to traditional brands has not been studied before, thus making it essential for a thorough analysis to occur, thus the following research methods were utilized:
• Analysis of all the literature available on the topics surrounding;
• Release of an online survey, to see in what way do consumers react differently to a high-end brand than they do to an NDI’s brand, with an in-between groups experiment.
By performing an online survey, one may enjoy great advantages, such as having a lower costs and a higher speed, more accurate results, download of results, and easiness in contact with certain target groups. On the other hand, it has some disadvantages like low response rates, no opportunity for question clarification, and the results don’t always represent the entire population. Given the topic in question and the type of research that had to be done, an online questionnaire was considered the most suitable research approach.
3.2. Research Instrument
3.2.1. Population of the study
The population of a research study comprises all the sets of cases from which a sample is extracted, being these cases not necessarily people (Saunders et al., 2009).
As it has been previously explained, the present research paper has as its main goal to understand in what way do consumers react differently to a brand/product owned by a New Digital Influencer in comparison to a traditional brand, in the high-end beauty segment. So, it is possible to state that the population for the current study are women, 18 years old and older who are on social media.
26
3.2.2. Sample
Sampling is an excellent substitute to studying every case of the population since it would be infeasible to do so, costly, and time consuming (Saunders et al., 2009). The sample of a population is the portion of that same population that will be subject to analysis and study. The sampling technique used to conduct the present academic research was the non-probability sampling, since there is time, financial, and access constraints that don’t allow for either every case to be studied or for completely random cases to be analysed.
The sample of the population that one can analyse in order to solve the Research Problem is women who don’t reject recommendations from influencers.
3.2.3. Questionnaire
In order to collect data, the present research paper utilized a structured and self-administered test - questionnaire. In order to achieve all the Research Objectives, the chosen method to publicize the questionnaire was through social media (Facebook, Instagram, WhatsApp), as it is wildly used within the population and fits with the topic. Furthermore, Qualtrics platform was used to perform the questionnaire.
When the formulation of questions took place, it was considered that respondents might consider questions ambiguous. Therefore, each question was constructed in a clear and direct manner, in order to avoid both ambiguous questions and answers.
In case a respondent wouldn’t be willing to respond to a question, it was not permitted for him/her to advance in the questionnaire, this way avoiding a common error in surveys (missing answers). Furthermore, in order to avoid inability in response formulation, the questions were multiple-choice, they considered the sample, and responses were anonymous (thus avoiding invasions of privacy, courtesy bias and prestige seeking); still, it was a priority to keep the length the shortest possible while studying everything necessary.
The questionnaire has as a purpose to evaluate the Attitudes, Purchase Intentions, Word-of-Mouth and Engagement respondents would have towards a brand owned by a New Digital Influencer and a traditional Brand. Respondents were randomly divided into two groups: one was presented with the stimuli for the Influencer (facts and images about the brand in question), and the other with the stimuli
27
for the traditional Brand (facts and images about the brand in question). After the stimuli is exerted, questions that aim at answering the Research Questions are performed. Answers are comparable as they pay respect to the same sample.
The survey was based on a compilation of scales from various academic research papers. Each academic paper comprised, then, one part of the survey. The online questionnaire was divided into 6 sections.
Section 1 - Selection
In the first section, the respondent was asked if he/she uses social media (If “No” End of Survey), and what is their attitude towards the recommendation of brands/products by:
a) Brands b) Influencers c) Friends/Family
If the respondent answered “Don’t accept” in Influencers, he/she was redirected to another question, asking their opinion about recommendations by influencers. Here, using a Semantic Differential Scale, respondents had to rate in a scale from 1 to 7 what was their feelings about influencers’ opinions in the following aspects (all these are 7 in the scale, being 1 the opposite):
• Trustworthiness • Appealing • Personal Value • Very Interesting • Usefulness • Correct
After this question, the survey would end, since there is no point in targeting the respondent.
All respondents who said they accept or were indifferent to recommendations by influencers, were randomly allocated to 2 groups, one with a brand or one with an influencer.
28
Section 2 – Purchase Intention
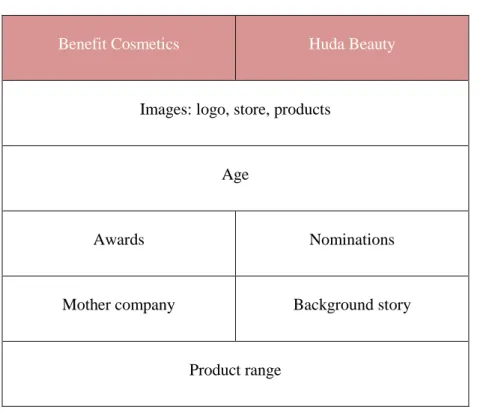
At this point, each group of respondents was assigned into their stimulus. This consisted of basic information about the brand/influencer (and her brand) (Table 1: Stimuli of online questionnaire.)
Benefit Cosmetics Huda Beauty
Images: logo, store, products
Age
Awards Nominations
Mother company Background story
Product range
Table 1: Stimuli of online questionnaire.
In the table above it is described the stimuli each group received in order to make an informed decision - even if someone didn’t know one of the brands, she would be able to answer the questions. Nonetheless, respondents were asked at this point if they knew the brand or not.
The traditional brand chosen was Benefit Cosmetics as it is the only high-end beauty brand of the ranking with the highest following on social media (Statista, 2019) that has an Instagram account in Portugal. The influencer chosen was Huda Kattan, who owns a makeup brand called Huda Beauty. Now the Research Questions started to be investigated. In order to do that, many research papers were thoroughly studied, and some scales from academic research papers were used as they had been successful.
The scale to measure Purchase Intention was based on Spears N. & Singh S. (2004)’s research paper titled “Measuring Attitude Toward the Brand and Purchase Intentions”. Respondents were asked if, having in mind the images and facts of the brand they had just seen and read, what was their purchase
29
intention? There were six dimensions, to which responses were rated on a Likert Scale from 1 to 7, being 1-Strongly Disagree and 7- Strongly Agree:
a) In the future, I would definitely buy makeup from this brand; b) I am curious to know this brand;
c) The probability that this brand is trustworthy is very high; d) It will easily become my main makeup brand;
e) I will frequently buy it;
f) If this brand is not available in the places I usually shop at, I will look for it somewhere else.
Section 3 – Brand Attitude
The following section was also based from Spears N. & Singh S. (2004)’s research paper titled
“Measuring Attitude Toward the Brand and Purchase Intentions”. Respondents were asked for their
feelings towards the brand presented. Having to rate in a Likert Scale from 1 to 7, where 1-Strongly Disagree and 7- Strongly Agree, there were five dimensions:
a) Appealing b) Good c) Pleasant d) Favourable e) Likable Section 4 – Word-of-Mouth
Regarding the scale to measure WOM, it was based on the academic article by Goyette et al. (2010) titled “e-WOM Scale: Word-of-Mouth Measurement Scale for e-Services Context”. The researches considered the following three-item scale as being ideal to evaluate Word-of-Mouth:
a) I will recommend this brand frequently to friends who ask me for advice; b) I will recommend this brand more than any other makeup brand;
30
c) I will speak about this brand positively.
Once again, it was used a Likert Scale that ranged from 1 to 7, where 1-Strongly Disagree and 7- Strongly Agree.
Section 5 – Engagement
In order to measure Engagement, Keller’s (2013) research titled “Strategic brand management
building, measuring, and managing brand equity” was pivotal. Following the same scale used
previously, Likert, respondents were asked to rate their level of agreement to the following statements:
a) I really like to talk about this brand to others; b) I am interested in learning more about this brand;
c) I would be interested in merchandise with this brand’s name on it; d) I al proud to have others know I use this brand;
e) I like to visit the brand’s social media page;
f) Compared to other people, I follow news about this brand closely.
Following this question, respondents were asked to rate on a Likert Scale from 1 to 7 their level of trust on the given brand.
The final version of the questionnaire presented to respondents is available on Appendix A: Online Questionnaire.
Section 6 – Demographics
Lastly, respondents were asked to answer questions about their country of origin, gender, age, occupation, academics, and time spent daily on social media.
In sum, the authors who contributed with scales from their own research to the present academic paper were:
31
Purchase Intentions Spears, N., & Singh, S. N. (2004)
Brand Attitudes Spears, N., & Singh, S. N. (2004)
Word-of-Mouth Goyette, I., Ricard, L., Bergeron, J., & Marticotte, F. (2010)
Engagement Keller (2013)
3.2.4. Measures
Following the research made within the Literature Review and whilst elaborating the Online Questionnaire, many measures from previous research papers were utilized.
The main scale used was the Likert scale, destined to understand the level of agreement of respondents to a given statement. The questions were explained in depth in section Questionnaire, but Likert was used to measure Purchase Intentions, Brand Attitudes, Word-of-Mouth, Engagement, and the level of trust respondents had on the given brands. When using this type of scale, people are asked to rate on a scale from 1 to 7, where 1-Completely Disagree and 7-Completely Agree.
The Semantic Differential scale was also employed, as it is useful in determining underlying attitudes (Saunders et al., 2009). In order to understand why some people don’t accept recommendations from influencers, this scale was considered the most suitable.
32
4. Results’ Analysis
4.1. Preliminary Analysis
4.1.1. Data collection and Analysis
Data collection was made through online platform Qualtrics, and data analysis was performed though SPSS 25. The latter one enabled the Research Problem to be solved and the Research Questions to be answered.
While the questionnaire was present online, about 172 responses were recorded, but only 153 were valid. The brand group was comprised of 77 valid respondents, while the influencer group accounted for 76 valid responses.
Results show that people who reject recommendations from influencers do so because they think influencers are not trustworthy, their content is not valuable, not interesting, and not useful.
Regarding the brand and the influencers in this research, about 75,6% of respondents knew the brand (Benefit Cosmetics), while only 25% percent knew the influencer (Huda Kattan). But, 54,5% of respondents stated they knew the NDI’s brand Huda Beauty, even though they didn’t know its founder.
When asked specifically about Benefit Cosmetics, 15,6% of respondents said they “Completely trust” the brand, and 4,4% said they “Do not trust at all”. In Huda Beauty’s case, 6,8% of people stated they “Completely trust” the brand and no one said they “Do not trust at all”, but about 63,6% said they “Neither don’t trust nor trust”, which is coherent with the fact that the influencer and the brand aren’t as known as Benefit Cosmetics.
4.1.2. Sample Characterization
At the end of the survey, some more personal questions were asked; ones about country of origin, age, gender, occupation, among others. These are crucial in order to better understand the target sample of the research.
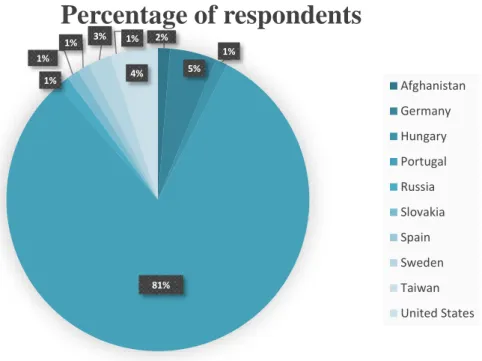
Regarding country of origin, respondents who answered were from 10 different nationalities, being that vast majority from Portugal (81%), 5% from Germany, and 4% from the United States. The
33
remaining respondents were residual percentages from the remaining nationalities present in Figure 4: Country of origin of respondents below.
Figure 4: Country of origin of respondents
In what concerns gender, the questionnaire was sent and advertised only to women, therefore 100% of respondents were in fact women.
Furthermore, while there was a designated effort to have only women respond to the survey, it was also intended for the widest array of women to answer as possible, in terms of age. About 68,5% of respondents were between the ages of 18 and 24 years old, respondents between 25 and 34 years old accounted for 28,1%, and only 3,4% of respondents were aged between 35 and 44 years old. This evolution makes sense regarding the theme of the present thesis, as social media users are younger.
Figure 5: Age of respondents
2% 5% 1% 81% 1% 1% 1% 3% 1% 4%
Percentage of respondents
Afghanistan Germany Hungary Portugal Russia Slovakia Spain Sweden Taiwan United States 0.00% 100.00%18-24 years old 25-34 years old 35-44 years old
18-24 years old,
68.50% 25-34 years old,
28.10% 35-44 years old, 3.40%
34
Occupation wise, students comprise 47,2% of the sample, while student-workers account for 4,5%. Average workers account for 41,6%, there are 2,2% self-employed respondents, 3,4% unemployed ones, and 1,1% stated to be enjoying another unspecified type of occupation (not retirement).
Figure 6: Occupation of respondents
As for the respondents’ educational level, the majority have completed their bachelor’s Degrees (48,3%) and almost the same amount has completed their Masters’ Degrees (40,4%). The remaining respondents, 10,1% have finished High School and 1,1% only did Primary School.
Figure 7: Educational Level of respondents
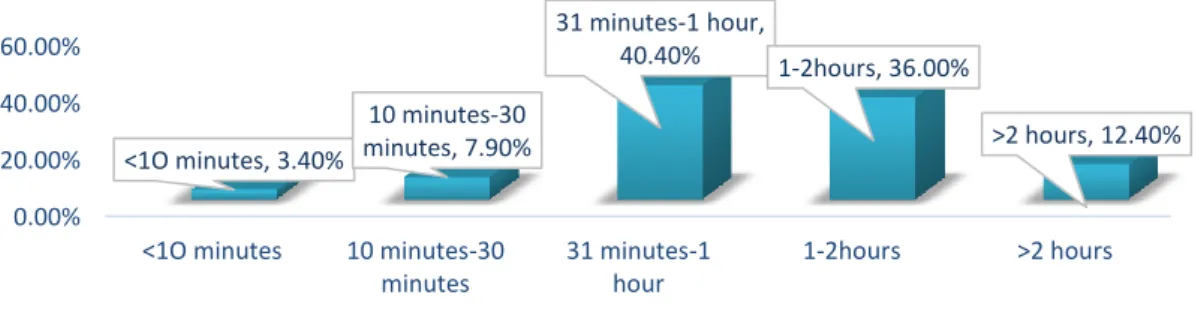
Lastly, as for time spent on social media per day, 40,4% of respondents spend between 31 minutes to 1 hour of their day on social media, 36% spend between 1 to 2 hours, and about 12,4% over 2 hours. Only 3,3% spend less than 10 minutes on social media, and around 7,9% spend between 10 to 30 minutes. Occupation 0.00% 50.00% Student, 47.20% Employee, 41.60% Employer, 2.20% Unemployed, 3.40% Student-worker, 4.50% Other, 1.10%
Occupation
0.00% 20.00% 40.00% 60.00%Primary school High School Bachelor's Degree Master's Degree Primary school, 1.10% High School, 10.10% Bachelor's
Degree, 48.30% Master's Degree, 40.40%
35
Figure 8: Time/day spent on social media by respondents
4.1.3. Data Screening: Univariate Outliers, Multivariate Outliers
Screening for outliers is of utmost importance as it identifies the cases of inconsistencies in the research data, and these may affect results. There are two types of outliers: univariate and multivariate.
Univariate outliers consist of an extreme value in recorded data. In order to screen for these outliers, one transforms the variables in question into standardized Z-scores, and within those new variables any value greater than absolute 3,29 – outlier – is either deleted or ignored. (the outlier is >3,29 standard deviations away from the mean). There is no proof in literature that suggests what to do in case outliers are found; some authors suggest deleting them, while others suggest ignoring them. As for responses for Benefit Cosmetics, there were no univariate outliers, as all z-scores were below the absolute value of 3,29. Regarding Huda Beauty, two outliers were identified paying respect to the same respondent (Table 2: Univariate Outliers.).
Outliers
Having in mind the images above, what are your feeling towards the brand? Use a scale from 1 to 7: Good
Min: -3.51949 Max: 1.91411 1 Having in mind the images above, what are your feeling towards the brand? Use a scale
from 1 to 7: Likable
Min: -3.52552 Max: 1.50549 1 Table 2: Univariate Outliers.
0.00% 20.00% 40.00% 60.00%
<1O minutes 10 minutes-30 minutes 31 minutes-1 hour 1-2hours >2 hours <1O minutes, 3.40% 10 minutes-30 minutes, 7.90% 31 minutes-1 hour, 40.40% 1-2hours, 36.00% >2 hours, 12.40%
36
From here on out, these outliers will be excluded from the analysis.
Multivariate analysis for outliers is a more in-depth process, as it searches for combinations of unusual scores on at least two variables. In order to identify these cases, the Mahalanobis distance was performed.
The variables considered were Purchase Intention, Brand Attitude, Word-of-Mouth, and Engagement. In order to carry on with the procedure, one first computes a linear regression with Dependent variable “Time spent on Social Media”, and Independent Variables (four ones mentioned previously). In order to be sure there are in fact outliers, one ought to compare the Mahalobis’ values to a chi-square distribution with the same degrees of freedom (in this case, four because of the number of predictors). In case any of the values of chi-square is <0.001, this is an outlier.
By running the regression and then comparing it to the chi-square values, there was one outlier found (p-value<0,001) while analysing Benefit Cosmetics, but none for Huda Beauty. Once again, any outlier case detected was disregarded from this point onwards.
4.1.4. Data Reliability
Although all the scales used on this research paper were from previous researches, it is vital to retest for their validity and reliability. In order to do that, one uses the Cronbach’s alpha test. For each scale the Cronbach’s alpha was computed, as well as the Cronbach’s alpha for the scale if that item was deleted (Appendix B: Cronbach’s AlphasAppendix B: Cronbach’s Alphas).
All the Cronbach’s alphas verified are high, not necessarily proving high reliability. Tavakol et al. (2011) state an alpha of 0,7<α<0,9 is the recommended value. In this case, all alphas are higher than 0,9 signalling that some items on those scales may be redundant or that the respective test should be shorter.
When testing for Purchase Intention, the scale could be improved. By removing one of the six items, the scale’s Cronbach’s alpha increases to 0,988 (before = 0,987).
Furthermore, in the scale for Word-of-Mouth the value obtained was 1. Ideally one would want to decrease this value to a more acceptable one (0,9) in order to avoid redundancy in questions. When this approach was taken the alpha did not decrease, therefore no item was excluded from the original
37
scale and if more than one was excluded the test would not work. In this case, all items are perfectly reliable and measure the same thing (true score), being this a limitation.
In conclusion, all scales from past literature are at their most reliable state except for the Purchase Intention one, where one item of the scale was extracted.
4.1.5. Principal Component Analysis (PCA)
The following analysis is conducted given that all scales had acceptable values (>0,7) in the Cronbach’s alpha test of reliability. It is of great importance to perform PCA in order to understand the underlying constructs in the questionnaire, as well as to reduce the number of variables of the data set as much as possible while maintaining as much information as possible, condensing them. The Principal Component Analysis is a type of Factor Analysis that is based on the total variance explained.
The procedure followed was the Principal Component Analysis with Varimax rotation, and four components were extracted in order to address the four dimensions studied.
The KMO test scores were good as these were >0,5 (0,873) showing that the Principal Components’ Analysis is useful. In the Bartlett’s Test for Sphericity, the null hypothesis is that the correlation matrix is an identity matrix, in that case there is no chance for reduction of variables. This hypothesis is rejected as there is scope for reducing the number of dimensions in this data set (p<0,001). Furthermore, factor 1 explains 65% of the Total Variance, factor 2 explains 13,10 %, factor 3 explains 6,52%, and factor 3 explains 3,87% of Total Variance.. This shows that factor 1 is the most distinct construct of all four. By analysing Appendix C: Scores for Principal Component Analysis, it is possible to see that Word-of-Mouth and Purchase Intention are overlapped. In theory, the item of the scale that has a high value in both constructs would have to be eliminated, but in this case that was not possible since a minimum of two items per scale is necessary in order to proceed with the analysis. Therefore, the item was kept on the construct where it made sense.
Having reached these results, new Cronbach’s alphas should be computed in order to assess the new scales’ reliability (Table 3: New Cronbach’s alphas.):
38 Scale Initial number of items Cronbach’s alpha Cronbach’s alpha based on standardized items Item deleted Final number of items Purchase Intention 2 0,984 0,984 - 2 Brand Attitude 4 0,926 0,926 - 4 Engagement 3 0,993 0,993 - 3
Table 3: New Cronbach’s alphas.
Similarly to before, all Cronbach’s alphas are high and above the recommended value of 0,9 (Tavakol et al., 2011). As has been stated previously, high alphas may occur in the case of long scales or redundant items. Having verified the Inter-item Correlation Matrix, the only scale where most items are not highly correlated (>0,8) with each other is the Brand Attitude scale, meaning that the high value of alpha is due to high reliability; regarding Purchase Intention and Engagement, the alphas are compromised due to the high interrelatedness of the items in each respective scale. This fact does not discredit the alphas, it merely explains the reason why it has a rather high value – some questions are redundant.
As has happened when testing previously to scales’ reliability, Word-of-Mouth has a true score, meaning all items are perfectly reliable and measure the same thing. In literature, there is no consensus as to what the approach to measure reliability should be when there is a two-item scale; some authors defend Cronbach’s alpha should continue to be used, whereas others state Pearson Correlation coefficient should be employed. Previously it was stated that by excluding one item from this scale the alpha would stay the same, so the Pearson Correlation coefficient was the approach taken in this step.
39
Measure
I will recommend this brand frequently to friends who ask
me for advice.
I will recommend this brand more than any other makeup
brand.
I will recommend this brand frequently to friends who ask me for advice.
Pearson Correlation 1
Sig. (2-tailed)
I will recommend this brand more than any other makeup brand.
Pearson Correlation .999** 1
Sig. (2-tailed) .000
Table 4: Pearson Correlation coefficient for Word-of-Mouth
As can be seen on Table 4: Pearson Correlation coefficient for Word-of-Mouth, the correlation for both items in the scale is high, showing that there is a statistically significant correlation between both items (p-value<0,05), specifically of 0,999.
Given that all Cronbach’s alphas are close or equal to their respective Cronbach’s alpha based on standardized items, no item of that same scale was ignored in order to increase reliability.
4.1.6. Scale Correlation analysis (Pearson)
The following analysis is of great importance as assesses the association and correlation between two or more variables. Pearson’s correlation coefficient intends to measure the strength of a linear relationship between paired data. As can be seen in Appendix D: Pearson Correlation for Brand,variables are either highly or poorly correlated. WOM and Engagement, Purchase Intention and Brand Attitude, Purchase Intention and Engagement, and Purchase Intention and WOM are all highly correlated (statistically significant to the p-value of 0,05). Furthermore, only some variables are positively correlated, as if one variable increases the others also increase (positive association): Word-of-Mouth and Brand Attitude, Purchase Intention and Brand Attitude, and Purchase Intention and Word-of-Mouth. All other variables’ relationships are opposite: as one variable increases the other decreases. For example, as Purchase Intention increases Engagement decreases.
40
4.1.7. Kruskal-Wallis Test
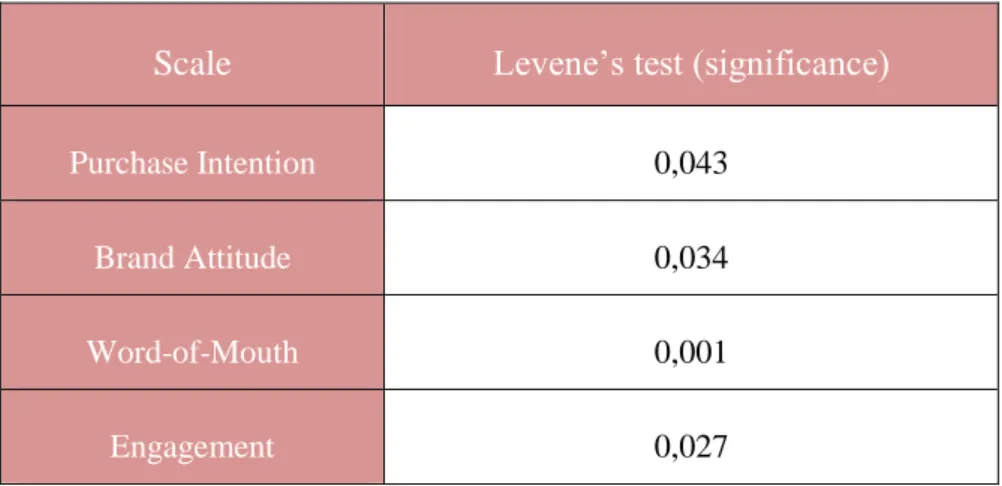
In order to proceed with the analysis, it was crucial to perform the Leven’s test of Homogeneity of Variances in order to understand if variances between groups are equal or not. In case they were, one would proceed with an ANOVA test, whereas if they were not equal, one would perform a non-parametric test equivalent to ANOVA in order to compare both groups. As it can be seen in Table 5: Levene’s test scores, all scores are below 0,05 significance level, showing that there is a difference in variances of each group. Furthermore, when testing for Normality with the Shapiro-Wilk test, all dimensions have a statistically significant score (<0,05) showing that the distribution is not normal.
Given that two of ANOVA’s assumptions were violated, one should use a non-parametric test equivalent to ANOVA, Kruskal-Wallis, to compare control variables7 between groups.
Scale Levene’s test (significance)
Purchase Intention 0,043
Brand Attitude 0,034
Word-of-Mouth 0,001
Engagement 0,027
Table 5: Levene’s test scores
By conducting a Kruskal-Wallis test, one assumes that the data points are independent of each other, there is one independent variable (Group) with two or more levels to the independent variables (Purchase Intention, Attitude, Word-of-Mouth, Engagement), the dependent variable is an ordinal/ratio/interval scale, and all groups should have similar shaped distributions.
As it is demonstrated on Appendix E: Kruskal-Wallis test, there are two items – “Time spent
daily on social media” (greater for the NDI’s brand) and “Trust” (greater for the traditional Brand)
- that are statistically significant to the level of 0,05. Given that most of the control variables are not statistically significant, both groups were considered comparable. It may however affect results and
41
be considered a limitation the fact that the Trust deposited on both brand types is statistically significant.
4.2. In-depth Analysis
The final goal of the present thesis is to solve the Research Problem and in turn answer the Research Questions proposed in the beginning. Having performed an extensive Literature Research as well as a Quantitative one, it is safe to begin. In order to do so, it is necessary to perform a Kruskal-Wallis test as the distribution is not normal (see Kruskal-Wallis Test). Having all the test’s assumptions
been verified, one was able to proceed with the analysis.
In what concerns the impact of NDI’s/traditional brands on Brand Attitude, the KW test revealed that the difference between both groups is not statistically significant (p-value=0,128>0,05). Brand Attitude represents a somewhat permanent, one-dimensional summary evaluation of the brand which optimally leads to behaviour engagement. It is however different to “Feelings towards a brand” as feelings are volatile and attitudes are not (Spears N. & Singh S., 2004). Lacroix C. & Jolibert A. (2017) state consumer attitudes toward luxury depend on excellent quality, very high price, scarcity, aesthetics, and extravagance. To this end, it makes sense the attitudes towards the NDI’s brand are not statistically different to the attitudes towards a traditional luxury brand as the NDI’s brand has extremely high quality, high price, its stock availability is reduced, it is very aesthetically pleasing, and the products look rich.
As for the impact of NDI’s/traditional brands on Purchase Intention, the test score was significant to the level of 0,05 (p-value=0,000) indicating that there is a statistically significant difference in the intention to buy from a traditional brand and the intention to buy from a brand owned by a New Digital Influencer, being the intention greater for a traditional brand. Behavioural intentions are someone’s intention to engage in a given behaviour (Spears N. & Singh S., 2004). In this case purchase intentions are someone’s conscious intentions to try and purchase from a given brand. According to Salehzadeh R. & Pool J. (2017), customers are willing to pay a premium in order to be associated with the name of known brands, fact that marketers are aware and use to keep generating behaviour. Although the attitudes for both brand types are statistically equal, the behaviour intentions are still not, given this image people want to portray of being associated to a certain group.
Regarding the impact of NDI’s/traditional brands on Word-of-Mouth, the Kruskal-Wallis test revealed that the difference between both groups’ scores are statistically different, as the p-value