M
ASTER OF
S
CIENCE IN
M
ANAGEMENT AND
I
NDUSTRIAL
S
TRATEGY
M
ASTER
’
S
F
INAL
W
ORK
DISSERTATION
C
LUSTERS AND THE
C
ONTEXT FOR
C
OMPETITIVE
A
DVANTAGE
:
A
S
TRATEGIC
A
NALYSIS OF THE
E
NGINEERING
&
T
OOLING
C
LUSTER
LUÍS PAULO RAMOS NETO
M
ASTER OF
S
CIENCE IN
M
ANAGEMENT AND
I
NDUSTRIAL
S
TRATEGY
M
ASTER
’
S
F
INAL
W
ORK
DISSERTATION
C
LUSTERS AND THE
C
ONTEXT FOR
C
OMPETITIVE
A
DVANTAGE
:
A
S
TRATEGIC
A
NALYSIS OF THE
E
NGINEERING
&
T
OOLING
C
LUSTER
LUÍS PAULO RAMOS NETO
S
UPERVISOR
P
ROFESSOR
J
AIME
S
ERRÃO
A
NDREZ
i
ACKNOWLEDGEMENTS
When I first started this research, I was aware of the complexity of the endeavour but could not foresee that, more often than not, more questions would be raised than answers would be given. I was reminded of what André Gide once said: ‘one does not discover new lands without consenting to lose sight of the shore for a very long time.’ Now that this journey is about to end, I realise that reaching the destination is not nearly as important as what I have learned and become by getting there.
Therefore, I thank my supervisor Professor Jaime Andrez for his support, critical remarks and for allowing this study to be my own work. I first came across the Engineering & Tooling cluster when the Professor handed me a brochure on the Portuguese clusters at the start of a lecture on Industrial Organisation. The existence of multiple types of positioning strategies, along with the alleged strong interplay between local institutions and firms serving global markets urged me to examine the sources of competitive advantage in this particular cluster.
I extend my thanks to the questionnaire respondents as well as to the business leaders and political decision-makers who generously contributed with their time during interviews. Learning from your first-hand experience and knowledge was one of the most enjoyable aspects of writing this dissertation. A special word of gratitude must also be expressed to Mrs Ana Amaral and Mrs Rita Pereira, librarians at the Lisbon School of Economics and Management, for having granted me access to otherwise unavailable materials that proved crucial to this study. I am equally grateful to my friends and family who have, either directly or indirectly, encouraged me throughout this journey.
My special tribute goes to my parents who have supported me in every possible way during my education, to my sister for her kindness and open arms, to my grandfather Joaquim Ramos whose memory still warms my heart during difficult times, and to Luís Grou for being the older brother I have always wanted to have. I am deeply grateful to my soulmate Daniela Pérez, who figuratively held my hands during this lengthy endeavour, for the love and inspiration she has brought into my life. I cannot thank you all enough for your care. I dedicate this dissertation to these six extraordinary human beings.
ii
ABSTRACT
This dissertation illustrates an empirical application of Porter’s (1990, 2004) Diamond Model using the Partial Least Squares Structural Equation Modelling (PLS-SEM; Wold, 1975, 1982) method in order to assess the effects of the microeconomic business environment on firms’ competitive advantage and the government’s supportive role in improving such an environment. It follows a concurrent triangulation design and takes firms in the Portuguese Engineering & Tooling cluster as the basic unit of analysis. The findings from the path analysis derive from a total number of 168 questionnaire responses obtained from firms in the cluster, which were subsequently triangulated with secondary data and interviews conducted with several cluster stakeholders. These findings reveal a positive effect of the related and supporting industries, the context for firm strategy and rivalry, and the factor (input) conditions at the cluster level on firms’ competitive advantage. Government action has also been shown to have a positive effect on the four determinants of the Diamond Model. Conversely, respondents’ perceptions do not support a positive effect of the demand conditions at the cluster level on firms’ competitive advantage.
The positive and negative effects of the Engineering & Tooling cluster’s environment on the competitive edge of firms highlight the catalytic roles of the government and collective action in cluster upgrading.
Keywords: Cluster; Cluster Policies; Competitive Advantage; Diamond Model; Engineering & Tooling Cluster; Mixed-methods Research; Partial Least Squares Structural Equation Modelling (PLS-SEM).
iii
RESUMO
A presente dissertação ilustra uma aplicação empírica do Modelo do Diamante de Porter (1990, 2004) recorrendo ao método de modelação de equações estruturais com base nos mínimos quadrados parciais (PLS-SEM; Wold, 1975, 1982), com vista a avaliar os efeitos da envolvente microeconómica na vantagem competitiva das empresas e do apoio governamental na melhoria desta envolvente. A investigação adota um design de triangulação simultânea e toma como unidade de análise as empresas do cluster
Engineering & Tooling.
Os resultados da análise de equações estruturais (path analysis) decorrem de um número total de 168 de respostas obtidas através de um questionário dirigido às empresas do cluster, os quais foram subsequentemente triangulados com dados secundários e entrevistas realizadas com vários intervenientes do cluster. Estes resultados revelam um efeito positivo tanto das indústrias relacionadas e de suporte, como do contexto para a estratégia e rivalidade empresarial, e das condições de fatores ao nível do cluster na vantagem competitiva das empresas. Também foi demonstrado que a ação do governo tem um efeito positivo nos quatro fatores determinantes do Modelo do Diamante. Contrariamente, as perceções dos respondentes não suportam um efeito positivo das condições da procura do cluster na vantagem competitiva empresarial.
Os efeitos positivos e negativos da envolvente do cluster Engineering & Tooling na vantagem competitiva das empresas realçam o papel catalisador do governo e da ação coletiva na melhoria das condições do cluster.
Palavras-chave: Cluster; Políticas de Clusterização; Vantagem Competitiva; Modelo do Diamante; Cluster Engineering & Tooling; Investigação por Métodos Mistos; Modelação de Equações Estruturais com base nos Mínimos Quadrados Parciais (PLS-SEM).
iv
RESUMEN
La presente disertación ilustra una aplicación empírica del Modelo del Diamante de Porter (1990, 2004) recurriendo al método de modelación de ecuaciones estructurales con mínimos cuadrados parciales (PLS-SEM; Wold, 1975, 1982), con el objetivo de evaluar los efectos del contexto microeconómico en la ventaja competitiva de las empresas y del apoyo gubernamental en la mejora de dicho contexto. La investigación adopta un diseño de triangulación simultánea y toma como unidad de análisis las empresas del cluster Engineering & Tooling.
Los resultados del análisis de ecuaciones estructurales (path analysis) provienen de un número total de 168 respuestas obtenidas a través de un cuestionario dirigido a las empresas del cluster, los cuales fueron subsecuentemente triangulados con datos secundarios y entrevistas realizadas a varios integrantes del cluster. Estos resultados revelan un efecto positivo tanto de las industrias relacionadas y de soporte, como del contexto para la estrategia y rivalidad empresarial, y de las condiciones de factores a nivel del cluster en la ventaja competitiva de las empresas. También fue demostrado que la acción del gobierno tiene un efecto positivo en los cuatro factores determinantes del Modelo del Diamante. Por el contrario, las percepciones de los encuestados no corroboran un efecto positivo de las condiciones de demanda del cluster en la ventaja competitiva empresarial.
Los efectos positivos y negativos del contexto del cluster Engineering & Tooling en la ventaja competitiva de las empresas destacan el rol catalizador del gobierno y de la acción colectiva en la mejora de las condiciones del cluster.
Palabras Clave: Cluster; Políticas de Clusters; Ventaja Competitiva; Modelo del Diamante; Cluster Engineering & Tooling; Investigación de Métodos Mixtos; Modelación de Ecuaciones Estructurales con Mínimos Cuadrados Parciales (PLS-SEM).
v
EPIGRAPH
Disruption of the status quo is strategic behaviour, not mischief. The ability constantly to ‘break the mould’ could be a core competence.
vi
TABLE OF CONTENTS
ACKNOWLEDGEMENTS ... i ABSTRACT ... ii RESUMO ... iii RESUMEN ... iv EPIGRAPH ... v TABLE OF CONTENTS ... viLIST OF TABLES ... viii
LIST OF FIGURES ... viii
GLOSSARY OF TERMS AND ABBREVIATIONS ... ix
1. INTRODUCTION ... 1
2. LITERATURE REVIEW... 2
2.1. Theoretical Framework ... 3
2.2. Location and Competition ... 3
2.2.1. From a Static to a Dynamic View of Competition ... 3
2.2.2. The Quest for Competitive Advantage ... 4
2.3. The Quality of the Microeconomic Business Environment ... 5
2.4. Clusters and Competitive Advantage ... 7
2.4.1. Defining Clusters ... 7
2.4.2. Clusters and Competitive Advantage ... 8
2.4.3. Cluster Development and Upgrading ... 8
2.5. Research Hypotheses and Conceptual Model ... 10
3. RESEARCH METHODOLOGY ... 13
3.1. Research Design and Philosophy ... 13
3.2. Sampling Technique ... 14
3.3. Quantitative Strand ... 14
3.3.1. Sampling Procedures ... 14
3.3.2. Questionnaire Design and Piloting ... 15
3.3.3. Construct Development and Measurement... 16
3.3.4. Questionnaire Administration ... 16
3.4. Qualitative Strand ... 17
3.4.1. Sampling Procedures ... 17
3.4.2. Selection and Access Strategy to Participants ... 17
3.4.3. Data Preparation Procedures ... 18
vii
3.4.5. Data Analysis Procedure ... 19
3.5. Research Quality Assurance ... 19
4. EMPIRICAL SETTING: THE PORTUGUESE E&T CLUSTER ... 20
4.1. The Competitive Environment of the Cluster ... 20
4.2. Cluster Policies in Portugal ... 20
5. DATA ANALYSIS AND RESULTS ... 22
5.1. Data Preparation and Descriptive Statistics ... 22
5.2. Final Sample Profile ... 23
5.3. Characteristics of Respondents ... 24
5.4. Model Estimation and Analysis ... 24
5.4.1. Measurement Models Assessment ... 24
5.4.2. Structural Model Assessment ... 26
5.4.3. Path Analysis and Hypothesis Testing ... 27
6. CONCLUDING REMARKS ... 34
6.1. Implications for Academia, Public Policy and Management Practice ... 34
6.2. Limitations and Future Research ... 35
BIBLIOGRAPHICAL REFERENCES ... 36
APPENDICES ... 51
Appendix A – Firm’s Value Chain and the Value System... 51
Appendix B – The Diamond Model ... 51
Appendix C – Nuclear and Support Activities of the E&T Cluster ... 52
Appendix D – Constructs and Respective Indicators ... 52
Appendix E – Overview of Interviews Conducted ... 54
Appendix F – Questionnaire ... 55
Appendix G – First E-mail ... 61
Appendix H – Follow-up E-mail ... 62
Appendix I – Consent Form ... 63
Appendix J – Interview Protocol (Pool-net)... 64
Appendix K – Interview Protocol (CCDRs) ... 65
Appendix L – Descriptive Statistics of Indicators and Statistical Tests ... 67
Appendix M – CTA-PLS Results ... 69
Appendix N – Redundancy Analysis ... 71
Appendix O – Overview of the Formative Measurement Models Evaluation ... 72
viii
LIST OF TABLES
TABLE 1 – Determination of the Minimum Sample Size………...……p. 15 TABLE 2 – Reliability and Validity Assessment………...…………..…p. 19 TABLE 3 – Overview of Hypothesis Testing..……..………...………...… p. 28
LIST OF FIGURES
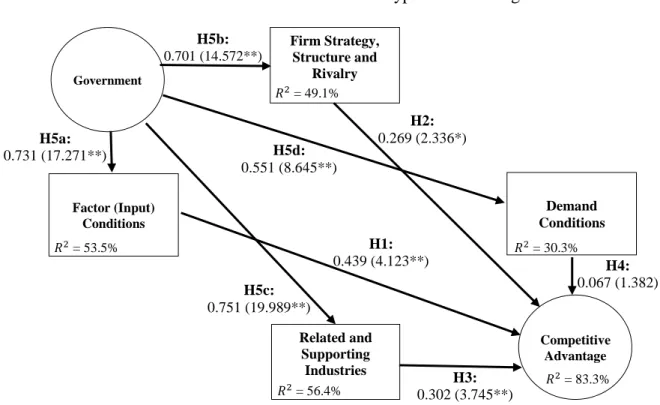
FIGURE 1 – Conceptual Model ………...……….…………...…p.10 FIGURE 2 – Concurrent Triangulation Design………...………….p. 13 FIGURE 3 – Path Model: Overview of Hypothesis Testing……...……….……p. 28
ix
GLOSSARY OF TERMS AND ABBREVIATIONS
APIP – Associação Portuguesa da Indústria de Plásticos1 BCa – Bias-corrected and Accelerated Bootstrap
CAE (Rev.3) – Classificação Portuguesa de Atividades Económicas (Revisão 3)2 CCDR-C – Comissão de Coordenação e Desenvolvimento Regional do Centro3 CCDR-N – Comissão de Coordenação e Desenvolvimento Regional do Norte4 CEFAMOL – Associação Nacional da Indústria de Moldes5
CENTIMFE – Centro Tecnológico da Indústria de Moldes, Ferramentas Especiais e
Plásticos6
Centro 2020 – Programa Operacional Regional do Centro (2014-2020)7
CES – Collective Efficiency Strategies
COMPETE 2020/ PO CI – Programa Operacional “Competitividade e
Internacionalização” (2014-2020)8
DC – Demand Conditions esp. – Especially
E&T Cluster – Engineering & Tooling Cluster EU – European Union
FC – Factor (Input) Conditions FDI – Foreign Direct Investment GSI – Global Single Item
GVCs – Global Value Chains
IAPMEI – Agência para a Competitividade e Inovação, I.P.9 I&D+i – Investigação, Desenvolvimento e Inovação10
I&DT – Investigação e Desenvolvimento Tecnológico11
1 Portuguese Plastics Industry Association
2 Portuguese Classification of Economic Activities (CAE Rev.3) 3 Centro Portugal Regional Coordination and Development Commission 4 Norte Portugal Regional Coordination and Development Commission 5 Portuguese Association for the Mouldmaking Industry
6 Portuguese Technological Centre for the Mouldmaking, Special Tooling and Plastics Industries 7 Centro Portugal Regional Operational Programme (2014-2020)
8 Operational Programme ‘Competitiveness and Internationalisation’ (2014-2020) 9 Portuguese Agency for Competitiveness and Innovation
10 Research, Development and Innovation (RD&I) 11 Research and Technological Development (RTD)
x
INPI – Instituto Nacional da Propriedade Industrial, I.P.12 IPAC – Instituto Português de Acreditação, I.P.13
IPQ – Instituto Português da Qualidade, I.P.14 MSc – Master of Science
n/a – Not Applicable
n.e.c. – Not Elsewhere Classified No – Number
Norte 2020 – Programa Operacional Regional do Norte (2014-2020)15 NS – Not Significant
NUTS – Nomenclature des Unités Territoriales Statistiques16 OLS – Ordinary Least Squares
PIEP – Pólo de Inovação em Engenharia de Polímeros17
PLS-SEM – Partial Least Squares Structural Equation Modelling Pool-net – Portuguese Tooling & Plastics Network
QREN 2007-2013 – Quadro de Referência Estratégico Nacional 2007-201318
RBV – Resource-based View of the Firm
RIS3 – Research and Innovation Strategies for Smart Specialisation RSI – Related and Supporting Industries
SBUs – Strategic Business Units
SCTN – Sistema Científico e Tecnológico Nacional19 SMEs – Small and Medium-sized Enterprises
SSR – Firm Strategy, Structure and Local Rivalry
12 Portuguese Institute of Industrial Property 13 Portuguese Institute for Accreditation 14 Portuguese Institute for Quality
15 Norte Portugal Regional Operational Programme (2014-2020) 16 Nomenclature of Territorial Units for Statistics
17 Portuguese Hub of Innovation in Polymer Engineering 18 Portuguese National Strategic Reference Framework (NSRF) 19 Portuguese National Scientific and Technological System
1
1. INTRODUCTION
In the past, the internal analysis of an organisation was at the core of strategic thinking (Porter, 2000a). Yet, the prevalence of industrial agglomerations in economies over the centuries has long puzzled scholars, especially since Alfred Marshall (1920 [1890]) first drew a link between production costs and the strategic co-location of related and specialised industries.
In a ‘world [that has gone] flat’ (Friedman, 2007, p. 5) as a result of the ever-deepening globalisation, a surge of interest in the local dimension from the 1990s onwards (Pyke & Sengenberger, 1992; Cruz & Teixeira, 2009) has paved the way for new theoretical accounts, amongst which the cluster literature. Following the trail laid down by Marshall (1920 [1890]), Michael Porter (1990) coined the term ‘cluster’ to refer to the geographical agglomeration of interconnected companies and associated institutions that compete but also cooperate in a particular field (Porter, 2000b).
In stark contrast to the resource-based view of the firm (RBV; i.a., Selznick, 1957; Penrose, 1959), cluster theory has highlighted that competitive advantage, to a large extent, ‘(…) lies outside companies and even outside their industries, residing instead in the locations at which their business units are based’ (Porter, 2000b, p.16). This led to the so-called ‘location paradox’ (Porter, 1998a; Ketels, 2006; Pisano & Shih, 2012) according to which, in a global economy, location still plays a key role in firms’ innovative capacity due to the constant interplay with other actors, agglomeration economies, knowledge spillovers and the transfer of tacit knowledge (Porter, 1994; Tinguely, 2013).
In line with these theoretical developments, the quest for competitive advantage gained prominence amongst academics, politicians and business leaders during the 1990s, at both the European and national levels (Fórum para a Competitividade, 1995). In the Portuguese case, it culminated in the publication of Building Competitive Advantages in
Portugal (Fórum para a Competitividade, 1994), commissioned by the Portuguese
government and under the direction of Michael Porter, in which clusters were deemed instrumental in attaining a national competitive edge. Today, more than 20 years later, the legacy of this movement is still found in the European and Portuguese cluster policies.
Consistent with previous research on clusters, this study draws on the Diamond Model proposed by Porter (1990, 2004) with a view to analysing the effects of clusters
2
on competitive advantage. Put simply, the model maintains that firms’ competitive advantages in a cluster depend on the microeconomic business environment, particularly on the factor (input) conditions, the context for firm strategy and rivalry, the demand conditions, as well as related and supporting industries at the cluster level (Porter, 2004).
This research nevertheless departs from previous studies in two fundamental ways. First, the unit of analysis is not the overall economy but firms in the Portuguese Engineering & Tooling (E&T) cluster. Second, this study goes beyond a qualitative analysis of the effects of clusters on firms’ competitive edge as in prior research. Rather, based on a questionnaire administered to cluster firms, it operationalises the Diamond Model using the PLS-SEM method and thereafter triangulates the estimated relationships with secondary data and interviews conducted with cluster stakeholders.
The objective of this study is twofold. On the one hand, it aims to assess empirically the effects of the determinants of the microeconomic business environment (formalised in the Diamond Model) on the competitive advantage of firms in the E&T cluster. On the other hand, it seeks to examine empirically the government’s supportive role in improving such determinants. In this endeavour, the contribution of the Portuguese Tooling & Plastics Network (Pool-net cluster association) has also been taken into account given its intermediary role between the private sector and government institutions, as well as due to its contribution to upgrading the conditions of the cluster.
The dissertation is structured as follows. The next section presents the results of the systematic review of the literature conducted. Section three describes the research design and the methodological procedures employed. Section four briefly characterises the unit of analysis as an introduction to the data analysis and results presented in section five. The final section summarises the argument of the study in five broad conclusions with implications for academia, public policy and management practice.
2. LITERATURE REVIEW
This section presents the results of the literature review carried out. The question ‘in the global economy, does the co-location of firms play a role in competition?’ served as a starting point for identifying relevant studies. The literature was thereafter assessed for its relevance to the study’s hypotheses, as suggested by Lewis, Saunders & Thornhill (2012).
3
2.1. Theoretical Framework
This study draws upon the contributions of the Positioning School of Thought (i.a., Hatten & Schendel, 1977; Porter, 1980, 1985) and the Resource-based View of the Firm (RBV; i.a., Penrose, 1959; Barney, 1991, 2001; Grant, 1991), which have been deemed complementary in many respects (see Cockburn, Henderson & Stern, 2000).
The literature on industrial agglomeration has evolved through several theoretical approaches, such as (i) the industrial districts (i.a., Becattini, 1979, 1990; Belussi, 1996; De Bernardy, 1999), (ii) les milieux innovateurs (i.a., Aydalot, 1986; Aydalot & Keeble, 1988; Camagni, 1995) and (iii) the industrial clusters (Porter, 1990). All these accounts share the idea that many of a firm’s competitive advantages are rooted in the locations where they operate (Porter, 1990). However, it is beyond the scope of this research to pay full tribute to all theories. Instead, focus will be placed on the cluster theory due to its contribution to understanding the sources of competitive advantage.
2.2. Location and Competition
2.2.1. From a Static to a Dynamic View of Competition
In the first half of the 20th century, a static view of competition based on cost-based competition was pervasive in the mainstream literature. In a context where economies were closed to foreign trade and following Adam Smith’s ideas, neoclassical scholars postulated that successful firms would need to have the lowest production costs or the greatest economies of scale (Goddard, Lipczynski & Wilson, 2005).
By that time, Alfred Marshall (1920 [1890]) was the first economist to draw the link between production costs and the agglomeration of related and specialised industries. The author pointed outa triad of external economies of scale: (i) an immediate pool of qualified and specialised labour, (ii) a quick dissemination of knowledge through knowledge spillovers, and (iii) an easier access to ‘non-traded local inputs’ provided by specialist suppliers (Marshall, 1920 [1890]; McCann & Shefer, 2004; Karlsson, 2008).
After the mid-1970s, however, changes in the competitive factors pushed the boundaries of competition beyond the price/cost paradigm associated with the mass production system (Hayes et al., 2005). In addition, the advent of the ‘New World Economy’, characterised by globalisation, technology-intensive activities and the role of network partnerships in tapping into immobile knowledge-based sources (Hayes et al.,
4
2005), in tandem with advances in transportation and communications technologies (Grossman & Rossi-Hansberg, 2008; Rouvinen et al., 2011), introduced increased dynamism in competition. But before diving into the effects of this dynamism on firms’ competitive advantage, it is first necessary to unravel the concept at issue.
2.2.2. The Quest for Competitive Advantage
In spite of earlier references dating back to Penrose (1959), the concept of competitive advantage was to be coined by Michael Porter a few decades later:
Competitive advantage grows out of the value a firm is able to create for its buyers that exceeds the firm’s cost of creating it. Value is what buyers are willing to pay, and superior value stems from offering lower prices than competitors for equivalent benefits or providing unique benefits that more than offset a higher price. There are two basic types of competitive advantage: cost leadership and differentiation.
In Porter (1985), p. 3 Hence, firms can either offer clients similar value but perform activities more efficiently than their rivals (i.e., cost leadership), or perform activities differently so as to create greater client value and command a premium price (i.e., differentiation) (Porter, 1990; The Economist, 2008). Many researchers argue that, as a result of the shift from a static to a dynamic approach to competition (Porter, 1994), the effect of location on competitive advantage has become less reliant on higher (static) productivity, but more on firms’ productivity growth (Porter, 2000a), i.e., on the rate of dynamic improvement through ongoing innovation and by upgrading their skills and technologies (Porter, 1994). Both productivity and innovation ultimately rely on the sophistication of a firm’s approach to competition in terms of (i) operational effectiveness and (ii) strategic positioning, in other words, the type of competitive strategy pursued (Porter, 2000a).
Whilst an external analysis of competitive advantage entails making choices about the types of positioning strategy (cost leadership or differentiation) and competitive scope (focusing on a narrow segment or targeting broad segments; Porter, 1990), an internal analysis involves deciding how firms attain (or develop) and protect their resources20 and
20 In line with Hitt, Hoskisson & Ireland (2016), ‘resources’ are distinguished from ‘capabilities’ in the
5
capabilities (Barney, 1991, 2001; Conner, 1991), as well as how activities are internally performed and managed (Porter, 1990, 2000a; Grant, 1991). In this regard, the Value Chain Analysis (Porter, 1985; Appendix A) provides a means for categorising the set of activities performed within and around a firm (Johnson, Scholes & Whittington, 2008) into primary and ancillary activities. Once firms’ activities are disaggregated in this way, the model allows for a clear understanding of the behaviour of existing and potential sources of competitive advantage in each activity (Porter, 1985, 1990; Tinguely, 2013).
Competition takes place at the strategic business unit level (SBU; Johnson, Scholes & Whittington, 2008), which implies that firms’ processes for creating competitive advantages ultimately depend on the location of their business units (Porter, 2000b). Thus, the contribution of a SBU to the competitive advantage of the respective firm is influenced by (i) the quality of the microeconomic business environment (section 2.3.) and (ii) the state of cluster development (section 2.4.3.; Snowdon & Stonehouse, 2006; Tinguely, 2013).
2.3. The Quality of the Microeconomic Business Environment
The quality of the microeconomic business environment affects firms’ degree of sophistication by means of a system of four interrelated determinants (Clancy et al., 2001) that together make up the so-called ‘Diamond Model’ (Porter, 1990, 2004; Appendix B):
Factor (Input) Conditions (FC) refer to the quantity, cost, quality and
specialisation of the available factor endowments in a given business environment that are required to gain competitive advantage in a specific industry (Porter, 1990; Huggins & Izushi, 2015). Basic factors, such as natural resources or unskilled labour, are readily available in a given location (Porter, 1990). Advanced factors, by contrast, require investments in human and physical capital by firms and governments, and include skilled and specialised labour, information, scientific and technological infrastructure, as well as capital resources (Porter, 2000b). Such factors may be either generalised in the sense that can be deployed in different industries, or specialised when restricted to a small number of industries (Porter, 1990). According to Porter (1990), the more advanced and specialised these factors are, the more sustained a firm’s competitive advantage will be.
Firm Strategy, Structure and Local Rivalry (SSR) relate to the types of strategies
6
and rivalry. Both dimensions are closely interrelated since the sophistication of firms’ operations and strategies depends chiefly on the rules, incentives and norms dictating the type and intensity of local competition (Porter, 1998c). Thus, the business environment affects how firms are created, organised and managed, the nature of local rivalry, as well as the processes of strategy and capability development (Porter, 1990).
Related and Supporting Industries (RSI) concern the availability and technical
quality of specialist local suppliers and related firms sharing the same technological or scientific basis (Porter, 1990). Such companies provide downstream industries with raw materials, components, machinery and services (e.g., accounting, law and advertising; Karlsson, 2008). Non-captive, world-class suppliers in the local area may also be a driver of innovation since the insights gained from their international activities often challenge client firms and assist them in their improvement efforts (Porter, 1990).
Demand Conditions (DC) refer to downstream industries, both clients and
distribution channels (Porter, 2000a), locally-based firms and subsidiaries of foreign companies (Porter, 1990). According to Porter (1990), the extent to which local demand boosts the ability of firms to gain and sustain a competitive edge depends on (i) its degree of sophistication, (ii) its absolute size and rate of growth which affect firms’ investment behaviour, (iii) its degree of internationalisation to pull firms’ products abroad, and (iv) its ability to anticipate global and not just local needs, particularly lead users21 who may help to develop well-targeted products when entering new markets (Ketels, 2006). The key features of the local demand are those providing a sustained stimulus to innovative investments and to compete in more sophisticated market segments (Porter, 1990).
Government (G) and Chance affect the process of creating competitive advantages
by influencing at least one of the four determinants of the quality of the business environment (Porter, 1990; Fórum para a Competitividade, 1994; Ketels, 2006; Fornahl & Menzel, 2009; Tinguely, 2013). On the one hand, chance events (e.g., technological discontinuities or unexpected changes in demand and input costs) are exogenous factors that give rise to discontinuities responsible for changing the ‘diamond conditions’ (Porter,
21 Lead users can be seen as ‘(…) users whose present strong needs will become general in a marketplace
7
1990). On the other hand, government bodies play a role in upgrading the business environment as a means of bolstering productivity growth (Delgado & Ketels, 2012).
2.4. Clusters and Competitive Advantage
Although clusters correspond to related and supporting industries, the interactions amongst all four determinants of the Diamond Model provide a more accurate representation of cluster dynamics (Porter, 2000a; Brakman & van Marrewijk, 2013).
2.4.1. Defining Clusters
Far broader in scope than the so-called ‘industrial districts’ (De Marchi & Grandinetti, 2014; Gereffi & Lee, 2018), (industrial) clusters have been defined as ‘(…) geographic concentrations of interconnected companies, specialized suppliers, service providers, firms in related industries, and associated institutions (…) in a particular field that compete but also cooperate’ (Porter, 2000b, p. 15). These are non-random spatial agglomerations (Karlsson, 2008) of local suppliers, related firms (Porter, 2000a), supporting institutions (e.g., cluster organisations, research, academic and financial institutions) and government bodies (Porter, 1998a,b; Ketels, Lindqvist & Sölvell, 2012). Clusters operate as systems linked by complementarities and commonalities (Simmie, 2008) that influence firms’ value-creating activities (Ketels, 2006). Such linkages are embedded in social relationships and networks, involving vertical chains of upstream and downstream industries with different but complementary capabilities and activities, as well as horizontal chains of related industries sharing similar capabilities, activities (Maskell, 2001) and/ or supply-side linkages, such as the use of similar specialised inputs and technologies (Porter, 1998a; Simmie, 2008).
Therefore, clusters embody a form of spatial organisation of economic activity rooted in ‘coopetition’ (Rees, 2005; Tinguely, 2013), in which competition for clients amongst rivals coexists with strategic cooperation (Porter, 1998b, 2000a). This is because many cluster firms serve different segments of the same client industry (and, thus, do not compete directly) and share many competitive threats and opportunities in the external environment (Porter, 2000a; Goddard, Lipczynski & Wilson, 2005).
Although some scholars (i.a., Gordon & McCann, 2000; Martin & Sunley, 2003; McCann & Sheppard, 2003) have criticised the concept’s porous boundaries, it has been
8
argued that cluster analysis has the upper hand over traditional sectoral analyses when explaining the changing nature of competition and the sources of competitive advantage.
2.4.2. Clusters and Competitive Advantage
Whilst the effects of some economy-wide aspects of the business environment cut across all industries, others are cluster specific (Porter, 2000a). Many scholars (i.a., Porter, 1985, 2000a; Pisano & Shih, 2009) have contended that, paradoxically, the cluster-specific aspects of the business environment have been instrumental in creating sustained competitive advantages in the global economy (Porter, 1990). A firm’s competitive edge is increasingly a function of how well it manages intra-cluster linkages within its value system (Porter, 1990; Appendix A), i.e., how a firm combines and integrates its activities with those from the value chains of upstream and downstream industries (Porter, 1990). Firms have therefore tended to focus on a few core activities and outsource to specialist suppliers those activities that are weakly linked to their core knowledge base and do not fit well into their competitive advantages (Dunning, 1997; den Hertog & Roelandt, 1998). As a result, cluster firms have been claimed to achieve greater sophistication (and hence higher productivity and innovation) vis-à-vis their non-clustered counterparts, both in terms of (i) operational effectiveness and (ii) strategic positioning, based on specialisation and competitive differentiation (Porter, 2000a). Several accounts, however, have argued against the benefits of specialisation and differentiation in clusters, stressing the path dependency underlying cluster development (Malmberg & Maskell, 2002; Sonderegger & Täube, 2010; Damgaard & Ingstrup, 2013) and the dangers of firms getting locked-in when chance events render the knowledge-base obsolete, the prevailing routines inefficient and the institutional framework inflexible (Cornwall & Cornwall, 2001; Barnes, Gartland & Stack, 2004; Malmberg & Maskell, 2007). This highlights the importance of upgrading the conditions in clusters.
2.4.3. Cluster Development and Upgrading
As discussed in section 2.3, the state of cluster development is related to the quality of the microeconomic business environment because it depends on the efficiency of the relationships between the determinants of the Diamond Model (Porter, 1998a).
Cluster development initiatives are key to cluster upgrading as they catalyse the efforts of industries, government bodies and local institutions into the design of concrete
9
actions that tackle clusters’ systemic imperfections (Lloyd & Peck, 2008), which are at the root of any constraints and inefficiencies in the ‘diamond conditions’ (Porter, 1998a).
With regard to the private sector, cluster initiatives are best carried out when collective efficiency22 is in place (Gereffi & Lee, 2018). Since local constraints are often related toincidental externalities and the need to develop specialised training (Schmitz, 1995) and public goods (Porter, 1998a), it is appropriate to do it via supporting institutions such as cluster associations (Schmitz, 1995; Giuliani, 2005; Gereffi & Lee, 2018).
Cluster associations, in addition to representing clusters and not particular industries, aim to build up trust and a platform for cooperation between rival firms (Mesquita, 2007; Damgaard & Ingstrup, 2013). These associations act as cluster facilitators and intend to raise awareness, foster commitment and create an efficient flow of resources (Bourgeois et al., 2010), technological and market knowledge (Coletti, 2010) around a cluster-wide strategy (Zagorsek et al., 2008; Damgaard & Ingstrup, 2013).
As for public policy, cluster theory suggests a horizontal, systemic and market-facilitating role for the government (Desrochers, Hospers & Sautet, 2008; den Hertog & Roelandt, 1998) in upgrading the ‘diamond conditions’, which usually requires a long-term commitment (Porter, 1990; Lloyd & Peck, 2008). Whilst this form of intervention concerns all levels of government, it should draw on place-specific knowledge and be implemented at the local level (Karlsson, 2008). Although this role is still a matter of debate in the literature due to a number of potential pitfalls (see den Hertog & Roelandt, 1998; Desrochers, Hospers & Sautet, 2008), Warwick (2013) notes that it is consistent with the so-called ‘systems approach’ that has been adopted in industrial policy.
In the context of the global economy, global value chains (GVCs) also play a role in cluster upgrading on at least two accounts. First, leading companies in decentralised production systems (e.g., global buyers), international organisations and trade agreements have facilitated the diffusion of international standards (Gereffi et al., 2005; Gereffi & Lee, 2018). Second, the ‘Smiling Curve’ model (see Shih, 1996) suggests that firms can expect increases in profitability arising from chain upgradings, in other words, by moving up the GVC towards related industries performing higher value-added activities (Gereffi, 2005a; Fernandez-Stark & Gereffi, 2018; Gereffi & Lee, 2018). Profitability is a key issue
22 Collective efficiency refers to those advantages stemming from strategically pursued joint action and also
10
due to the need for ongoing investment in innovation and cluster upgrading in order to allow firms to sustain a competitive edge (Porter, 1990).
2.5. Research Hypotheses and Conceptual Model
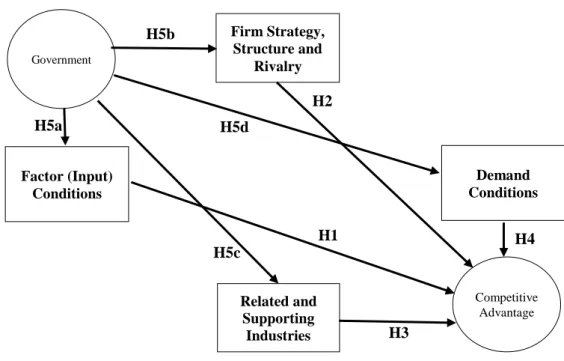
As noted by Hulland (1999), any causal-modelling process study begins at the conceptual level. The conceptual model proposed below is an adaptation of the Diamond Model (Porter, 1990, 2004). The effects of chance events have been dismissed given the focus of this study on the sources of competitive advantage that can be controlled or at least influenced by firms. Consistent with Mboya (2015), the concept of ‘Competitive Advantage’ has also been added as an outcome variable. As depicted in Figure 1, eight research hypotheses have been formulated, whose rationale is presented below.
FIGURE 1 – Conceptual Model
Source: Author based on Porter (1990, 2004).
Clusters are typically associated with the development of high-quality and highly specialised factors conducive to innovation (Porter, 2000b), such as human resources, applied technology and scientific, administrative and information infrastructure, as well as capital resources tailored to the needs of cluster industries (Council on Competitiveness
et al., 2001a). These theoretical arguments lead to the following hypothesis:
H1. Factor conditions positively influence the competitive advantage of cluster firms.
Government Factor (Input) Conditions Firm Strategy, Structure and Rivalry Related and Supporting Industries Demand Conditions Competitive Advantage H2 H1 H3 H4 H5a H5b H5c H5d
11
The context for firm strategy and rivalry in clusters comprises a set of rules, incentives and pressures that give rise to sophisticated forms of competition and intense local rivalry. Such a context thus promotes appropriate types of investment and sustained upgrading that foster productivity growth (Porter, 2000b; Council on Competitiveness et
al., 2001a). These theoretical arguments lead to the following hypothesis:
H2. The context for firm strategy and rivalry positively influences the competitive advantage of cluster firms.
Local sourcing from skilled suppliers boosts firms’ productivity and innovative capacity by allowing quicker and less expensive communication, promoting the flow of ideas and enhancing flexibility via outsourcing (Council on Competitiveness et al., 2001a). In this regard, specialisation of production and division of labour enable firms to reap the benefits of economies of scale and scope (Cruz & Teixeira, 2009). These theoretical arguments lead to the following hypothesis:
H3. Related and supporting industries positively influence the competitive advantage of cluster firms.
The development and improvement of products and services benefit from sophisticated and demanding clients and distribution channels in the local area (Porter, 2000b; Council on Competitiveness et al., 2001a). Similarly, lead users (von Hippel, 1986) and a distinctive local demand in specialised segments capable of serving international markets may offer insights into both existing and future needs, and compel firms to improve (Council on Competitiveness et al., 2001a). These theoretical arguments lead to the following hypothesis:
H4. Demand conditions positively influence the competitive advantage of cluster firms. Governments are responsible for providing and improving the quality (Council on Competitiveness et al., 2001a) of specialised education and training programmes, fostering local academic research in cluster-related technologies, supporting in compiling cluster-specific information and enhancing specialised transportation, communications and other relevant infrastructure (Porter, 2000b). Public incentives may also contribute to
12
firms’ innovation efforts (Council on Competitiveness et al., 2001a). These theoretical arguments lead to the following hypothesis:
H5a. The government positively influences the factor conditions in a cluster.
The public sector is accountable for setting up rules, regulations and incentives aimed at removing barriers to local competition (Porter, 2000a) in order to stimulate innovation and cluster upgrading (Council on Competitiveness et al., 2001a). Government bodies may influence the competitive conditions under which firms compete by means of regulations, tax policies and competition law (Council on Competitiveness
et al., 2001a). The public sector may also be organised so that relevant departments can
efficiently assist clusters, for instance, by supporting joint export promotion and by channelling efforts to attract foreign direct investment (FDI) inflows around clusters (Porter, 2000b). These theoretical arguments lead to the following hypothesis:
H5b. The government positively influences the context for firm strategy and rivalry in a cluster.
Governments are expected to play a facilitating role in sponsoring forums to bring together cluster members and undertake cluster-specific efforts to attract suppliers and service providers in other locations (Porter, 2000b). These theoretical arguments lead to the following hypothesis:
H5c. The government positively influences the related and supporting industries of a cluster.
The public sector is responsible for creating simplified and pro-innovation regulation in order to (i) mitigate uncertainty, (ii) stimulate the early adoption of new products and technologies, and (iii) encourage ongoing skill and technology upgrades (Porter, 1994). In addition, government bodies are accountable for sponsoring independent testing and the certification of products and services developed by cluster firms (Porter, 2000b). These theoretical arguments lead to the following hypothesis: H5d. The government positively influences the demand conditions in a cluster.
13
3. RESEARCH METHODOLOGY
This section delves into the rationale behind the research design and methodological choices. It also devotes a few words to enlighten the reader on the overarching philosophical assumptions embedded in this dissertation.
3.1. Research Design and Philosophy
The philosophical stance underpinning this study is called Pragmatism (James, 1907; Peirce, 1984), according to which researchers may choose multiple methods, techniques and procedures for data collection and analysis in order to better understand the research problem (Creswell, 2009). In line with the research philosophy embraced, this study follows a mixed-methods approach and adopts a concurrent triangulation design (Creswell, 2009), as illustrated schematically in Figure 2.
FIGURE 2 – Concurrent Triangulation Design23
Source: Creswell (2009) based on Creswell et al. (2003).
)
This research design allows for (i) corroboration via triangulation, (ii) a more detailed analysis of the research hypotheses, and (iii) finding new research avenues based on surprises or paradoxes (Rossman & Wilson, 1984, 1991; Huberman & Miles, 1994). A final remark on the research design is related to the explanatory purpose of the study. Following a deductive research approach (Lewis, Saunders & Thornhill, 2012), quantitative data were statistically analysed (via path analysis) to explain, based on respondents’ perceptions, the relationships between the government, the cluster’s microeconomic business environment and firms’ competitive advantage. Qualitative data were collected from a broader range of stakeholders to validate these relationships.
14
3.2. Sampling Technique
A concurrent mixed-methods sampling (Teddlie & Yu, 2007) was employed. Accordingly, a probability sampling technique was used to meet the representativeness requirement for the quantitative strand of the research (section 3.3.1.). With regard to the qualitative counterpart, a purposive sampling technique was used to meet the data saturation requirement (section 3.4.1.).
3.3. Quantitative Strand
3.3.1. Sampling Procedures
As regards the quantitative strand of the research, the sampling plan followed the steps24 pointed out by Hair et al. (2010). First, the target population was defined as the group of industrial companies operating in Portugal that carry out nuclear and support activities in the E&T cluster, including both members and non-members of the Pool-net association (vide Appendix C).
A sampling frame was thereafter generated by complementing the business directory provided by Informa D&B Portugal (Gomes, 2017) with missing e-mail addresses published on Pool-net’s website25. The directory targeted all sectors of the cluster. It covered the period from 2010 to 2015 (the latest available data at the time of request) and included the following information: firms’ activity status, turnover, number of employees and values of exports and imports. In order to ensure that the sampling frame was precise, duplicates were removed as well as addresses of firms belonging to industries that fell outside the target population, such as institutions and engineering firms. From an initial number of 3728 firms, a final number of 980 firms was reached.
The minimum sample size required was thereafter computed by means of a prospective multiple regression power analysis (Ellis, 2010) using the G*Power v. 3.1.9.2 software (Buchner et al., 2009) in order to ensure that the statistical tests performed in section 5.4. would have sufficient statistical power. For a medium effect size 𝑓2 = 0.15, according to Cohen’s (1988) guidelines, and following the five-eighty convention (i.e.,
α = 0.05 and 1–β = 0.8; Cohen, 1988; Ellis, 2010), Table 1 indicates that the sample size
should be no fewer than 55 cases.
24 The statistical method used to analyse the quantitative data (PLS-SEM) will be presented in section 5.4. 25 See <http://www.toolingportugal.com/index.php?lang=en>, last accessed on the 2nd of August 2019.
15
TABLE 1 – Determination of the Minimum Sample Size
Type of Model Predicted Variable No Predictors Minimum Sample Size required Structural Model CA26 4 43 Measurement Models G 12 55 FC 6 55 SSR 4 55 RSI 4 55 DC 4 55 CA 9 55
Source: Author’s calculationsusing G*Power (v. 3.1.9.2).
3.3.2. Questionnaire Design and Piloting
As recommended by Churchill (1979), ordinal closed-ended questions were adapted from previous studies (see Appendix D). General instructions were provided and respondents were asked how strongly they agreed or disagreed with a series of statements using Likert-type rating scales. Jargon and unfamiliar concepts were avoided, yet some of them had to be used for purposes of convergent validity assessment, as will be discussed later. In such cases, the literature has urged the use of a concise description (Cheah et al., 2018) or examples so that respondents understand the questions in the same way (Rasinski, Rips & Tourangeau, 2000; Lee et al., 2003). In order to increase the validity of responses and minimise dropout rates, a ‘do not know’ category was added to policy-related questions and, as suggested by de Vaus (2002), a filter question was added to ensure that only firms having local clients could answer demand-related questions.
Pretesting was carried out based on a two-staged pilot study. First, the questionnaire was checked for its structure and the suitability of its questions by two academics acquainted with the business environment of the E&T cluster. Prior research (i.a., Converse & Presser, 1986; Oksenberg et al., 1991; Fowler, 1993; Czaja & Blair, 1996; Czaja, 1998) has supported that a questionnaire must also be tested under field conditions. Hence, 12 think-aloud interviews (Czaja, 1998; see Appendix E) were conducted with respondents from the target population, both in Marinha Grande and Oliveira de Azeméis on the 27th of July 2017, 3rd and 9th of August 2017. As suggested by Czaja (1998), respondents were asked to fill in a draft questionnaire, report any
26 In accordance with the guidelines provided by Hair et al. (2014, p. 21), the highest number of arrows (4)
16
difficulties encountered and were queried about their understandings of the questions. The refined questionnaire can be found in Appendix F.
3.3.3. Construct Development and Measurement
Construct development was performed on the basis of a thorough literature review, as recommended by Churchill (1979) and Rossiter (2002). Gudergan et al. (2016) point out that the process of construct definition also involves determining constructs’ dimensionality. Given the conceptual comprehensiveness of this study’s constructs, these were conceptualised as multidimensional and measured by a set of formative indicators.
As regards the indicators’ measurement scales, 5-point Likert-type scales with a balanced number of positive and negative categories (Hair et al., 2010) were used27. Appendix D enumerates the items adapted from Porter & Schwab (2008), Mboya (2015), the Council on Competitiveness et al. (2001a, b) and the European Cluster Observatory (2012) to measure the various dimensions of the constructs. A study carried out by Hair
et al. (2012b) examined the use of PLS-SEM in 37 papers in the field of Strategic
Management and reported that, on average, the number of formative indicators per construct is 3.6. Accordingly, each construct in this study contains at least 4 indicators.
3.3.4. Questionnaire Administration
Data were collected using a self-administered, web-based questionnaire (Lewis, Saunders & Thornhill, 2012) for several reasons, including the low cost per completed questionnaire and fast data collection (Christian, Dillman & Smyth, 2014).
On the 17th of August 2017, an e-mail (Appendix G) presenting the research and providing an URL for the questionnaire was sent out using the Qualtrics online survey software (Qualtrics LLC, 2017) to a simple random sample28 drawn from the sampling frame. Since most firms in the E&T cluster are family-owned small and medium-sized enterprises (SMEs), questionnaires were administered in Portuguese and were primarily addressed to owner-managers and those managers involved in the strategic decision-making process and/or who had a holistic understanding of their firms’ value chains.
27 For instance, 5-point Likert-type scales ranging from Strongly Disagree (1) to Strongly Agree (5). 28 In line with Silva (2011) – a PLS-SEM study that also relied on a small sampling frame – the size of this
17
Two follow-up reminders (Appendix H) were sent out at two-week intervals in order to encourage non-respondents and respondents who had not yet completed the questionnaire. The data collection period ended on the 15th of September 2017. Of the 637 eligible respondents, a total of 304 responses were collected, yielding a response rate of 47.7%, which is substantial when compared to the likely response rate for web-based questionnaires that tends to be 11% or lower (de Vaus, 2002; Baruch & Holtom, 2008; Lewis, Saunders & Thornhill, 2012).
3.4. Qualitative Strand
3.4.1. Sampling Procedures
Members of the target population were selected using criterion sampling. This non-probability, purposive sampling technique requires participants to be selected on the basis of some predetermined criterion (Patton, 2002; Teddlie & Yu, 2007; Patton, 2015). Bearing in mind the role of institutions in improving the ‘diamond conditions’, the selection criterion was defined as being a cluster institution, governmental or otherwise, involved in managing the process of cluster development.
In the context of the E&T cluster, three institutions met this criterion: the Pool-net cluster association, responsible for coordinating the cluster’s strategy; and the Regional Coordination and Development Commissions of the Norte and Centro regions (CCDR-N and CCDR-C, respectively), where most cluster firms are based. These decentralised agencies of the Portuguese government (Lämmer-Gamp & zu Köcker, 2017) affect the execution of the cluster’s strategy through (i) its role in coordinating the regional research and innovation strategies (RIS3) and (ii) the application of the European Union (EU) funds falling under their operational programmes (Koehler, 2015; CCDR-C, 2017).
Consistent with prior recommendations, the determination of sample size was based on the principle of theoretical saturation (Bryman, 2012; Lewis, Saunders & Thornhill, 2012), i.e., when an additional interview only provided redundant information.
3.4.2. Selection and Access Strategy to Participants
Once the relevant institutions had been selected, a preliminary search within their respective websites was carried out in an attempt to access to their organisational charts. This made it possible to determine the departments or individuals involved in the process of cluster upgrading. Both Rui Tocha, general manager of the Pool-net association, and
18
Alexandra Rodrigues and Rui Monteiro, heads of the CCDR-C and CCDR-N Departments for Regional Development, respectively, were deemed the most appropriate participants. Initial contacts were made both in person and via e-mail. Rui Tocha was approached on the 25th of November 2016 in Lisbon at the end of a lecture at ISCTE Business School. Alexandra Rodrigues was approached on the 6th of July 2017 at the end of a RIS3 conference held in Torres Vedras. Rui Monteiro was contacted by e-mail on the 18th of July 2017. Prospective participants were briefly introduced to the research and interview requests were made thereafter.
3.4.3. Data Preparation Procedures
Interviews were scheduled and, as recommended by Cooper, Cronin & Reimann (2007), a thorough search of secondary data were conducted for the purpose of devising the interview guides. This was done by consulting publications, reports and studies available on each organisation’s website, as well as on other official online sources. There was a need to tailor the guides in order to adapt the research topic to the specific organisational contexts encountered (Lewis, Saunders & Thornhill, 2012).
3.4.4. Data Collection Procedures
Once informed consent29 had been given, primary data were obtained via semi-structured interviews (Appendix E), which are useful when ‘(…) highly sensitive and subtle matters need to be covered, and where long and detailed responses are required to understand the matter the respondent is reporting on’ (Ackroyd & Hughes, 1992, p. 104).
By adopting a conversational interviewing approach (Kvale, 1996; Kvale & Brinkmann, 2008; Patton, 2015), the researcher was able to learn about participants’ views in their own words. Interviews were conducted in accordance with the protocols in Appendices J and K, which display both the list of questions and the procedure followed in the interview process (Furgerson & Jacob, 2012). Questions were followed up by probes aimed at tapping into more contextual data (Lewis, Saunders & Thornhill, 2012). Two complementary sources of qualitative data were considered. On the one hand, follow-up probes used in pretest interviews with firm managers yielded contextual data.
29 In addition to an oral consent, interviewees were asked to fill in and sign the consent form set out in
19
On the other hand, secondary data were obtained from a variety of interview articles in O
Molde, Jornal de Leiria and Região de Leiria magazines.
3.4.5. Data Analysis Procedure
Interviews were fully transcribed and analysed using the Template Analysis technique proposed by King (2012), which is appropriate for studies examining the views of different groups in a given context and involves the following steps (King, 2012): 1. Read through the transcripts for familiarisation purposes and to detect any errors; 2. Given the deductive approach of this study, a template (i.e., a list) of six themes30 was
built, each one representing the constructs/ latent variables in the conceptual model; 3. Coding process, i.e., attach a single code or multiple codes to each section of text deemed relevant to the research hypotheses. Coded data were thereafter grouped into the six themes mentioned in the previous step;
4. Modify the initial template whilst working through the set of transcripts;
5. Data interpretation and analysis by looking at the frequency of themes and their distribution patterns. As recommended by King (2012), the most frequently mentioned themes across all transcripts and those which were constantly occurring in a single transcript (i.e., key exceptions) were both taken into account;
6. Discuss the relationships between the selected themes and draw illustrative quotations from transcripts. As suggested by Lewis, Saunders & Thornhill (2012), counterexamples not conforming to the relationships underlying the research hypotheses were considered for validation purposes.
3.5. Research Quality Assurance
In order to ensure the validity and reliability of the information obtained, the following procedures were put in place (see Table 2).
TABLE 2 – Reliability and Validity Assessment
Criteria for Assessing Quantitative/Qualitative Research
Actions Taken by the Researcher Quantitative Strand
(Questionnaire)
Qualitative Strand
(Interviews) Internal Validity/ Credibility
- Literature review and pilot study (content validity).
- Redundancy analysis (convergent validity).
-Pattern recognition amongst interviews and explanation of the existing relationships.
30 According to King (2012, p. 431), themes in qualitative analysis concern ‘(…) the recurrent and
distinctive features of participants’ accounts in interviews (…) that characterize perceptions and/or experiences, seen by the researcher as relevant to (…) a particular study.’
20
- Non-response bias analysis (Appendix L). - Interview guides provided before interviews.
- Triangulation of methods and data sources. External Validity/
Transferability
- Simple random sampling technique. - The use of a filtering question to tackle heterogeneity in the sample.
- Description of data collection and analysis procedures to enable replication.
- Broad generalisations at the cluster level followed by warnings about the heterogeneity in the cluster, when appropriate.
Reliability/ Dependability
- Pilot testing under field conditions. - The questionnaire was addressed to respondents involved in firms’ strategic decision-making processes.
- Appropriate number of items per construct.
- The use of interview protocols. - Interviews were audio-recorded. - Data from interviews were compared with recent secondary data.
Objectivity/ Confirmability
- Compliance with the guidelines and rules of thumb reported in the literature about data preparation and analysis.
- Search for counterexamples to test the remarks that were made. - Storage of audio recordings and transcriptions.
Source: Author based on Arora, Donnelly & Trochim (2015).
4. EMPIRICAL SETTING: THE PORTUGUESE E&T CLUSTER
4.1. The Competitive Environment of the Cluster
The Portuguese Engineering & Tooling cluster is the unit of analysis in this study. The cluster encompasses the mouldmaking, plastics and special tools industries (Tocha, 2017a), which are mostly clustered around Marinha Grande (Centro region) and Oliveira de Azeméis (Norte region; Castro & Mota, 2004). The cluster’s value chain consists of four main activities (Sociedade Portuguesa de Inovação, 2008): (i) mould design and engineering; (ii) prototyping; (iii) mould and tool manufacturing; and, (iv) injection moulding to produce parts and components.
There is a wide range of competitive positions in the cluster, which is typically determined by a firm’s size (Sociedade Portuguesa de Inovação, 2008). Small-sized firms tend to be restricted to mould manufacturing, and many of these companies approach the market via mould-trading firms that act as distribution channels. Large-sized firms, by contrast, offer a greater variety of value-added activities beyond mould manufacturing, and make use of their commercial teams to approach the market (Sociedade Portuguesa de Inovação, 2008).
4.2. Cluster Policies in Portugal
The Collective Efficiency Strategies (CES) were the first cluster initiative launched in Portugal under the National Strategic Reference Framework (QREN 2007-2013; Sociedade Portuguesa de Inovação & inno TSD, 2013a). In July 2009, 11 poles and 8 clusters were formally recognised in light of their relevance to the Portuguese economy
21
(Sociedade Portuguesa de Inovação & inno TSD, 2013b). A second cycle was launched in 2015 (Diário da República, 2015) for the 2017-2023 time frame (European Cluster Collaboration Platform, 2019). In February 2017, 20 ‘competitiveness clusters’ were recognised under the coordination of the Portuguese Agency for Competitiveness and Innovation (IAPMEI, I.P.; Diário da República, 2015; IAPMEI, 2019).
The E&T cluster was recognised in both cycles and it has been managed by Pool-net, a private association representing the cluster’s value chain from mould design to plastic parts and tool manufacturing (European Cluster Observatory, 2019). In partnership with the Portuguese Association for the Mouldmaking Industry (CEFAMOL) and the Portuguese Technological Centre for the Mouldmaking, Special Tooling and Plastics Industries (CENTIMFE; Tocha, 2017b), it coordinates a set of projects that implement the cluster’s action plan (Bagchi-Sen & Farinha, 2019; Pool-net Association, 2019a,b).
Government support to the E&T cluster stems largely from the EU funding allocated by the regional (esp. Centro 2020 and Norte 2020) and thematic (esp. COMPETE 2020) operational programmes under the Portugal 2020 Partnership Agreement, the successor of QREN 2007-2013. Despite the importance of thematic, nation-wide incentives, OECD research has emphasised incentive-based competitive processes that ‘(…) foster valuable regional specialisations (…) and promote regional clustering experiences, in a relatively small country like Portugal’ (OECD, 2008, p. 85). Given the current place-based approach to the EU cohesion policy (McCann & Ortega-Argilés, 2013; Moodysson, Trippl & Zukauskaite, 2017), firms’ compliance with RIS3 strategies has been an ex-ante conditionality (Koehler, 2015; CCDR-C, 2018) during the programming period of 2014-2020 for the approval of investment projects geared towards research, development and innovation (RD&I) and information technology. The Research and Innovation Strategies for Smart Specialisation (RIS3) aim to provide a systemic and strategic vision to the cluster policy by structuring public and private investments in the process of cluster upgrading (Lämmer-Gamp & zu Köcker, 2017). The regional development policy in Portugal is organised at the NUTS II level (Hassink & Marques, 2016) and the CCDRs are responsible for assessing whether or not firms’ projects comply with the RIS3 priorities of each region (Ecorys et al., 2014).