On
the
Po
l
i
t
ica
l
S
ide
of
Luxury
Mar
ia
do
Mar
Be
lch
ior
D
isser
ta
t
ion
wr
i
t
ten
under
the
superv
is
ion
of
Professor
Dan
ie
l
Fernandes
D
isser
ta
t
ion
subm
i
t
ted
in
par
t
ia
l
fu
lf
i
lmen
t
of
requ
iremen
ts
for
the
MSc
in
Managemen
t
w
i
th
a
Spec
ia
l
iza
t
ion
in
S
tra
teg
ic
Marke
t
ing
,
a
t
the
3
ABSTRACT
This dissertation investigates the influence of political ideology on the perception of luxury products of Portuguese consumers. A positive relationship between political conservatism and higher willingness to pay for luxury products was demonstrated via a statistical analysis, indicating that conservative-leaning consumers are more likely to pay a premium for luxury products than liberal-leaning consumers (in accordance with previous literature). Furthermore, this dissertation explores the influence of a review, by an opinion leader, on the willingness to pay for a product. On the one hand, the majority of the respondents did not change their willingness to pay on the product after reading the review; on the other hand, among those who changed, a greater part effectively recognized a higher value on the product after reading the review. Moreover, it is suggested that conservative-leaning consumers are more likely than liberals to value external approval (in this case, a review by an opinion leader on the field) on luxury products in order to buy them. This conclusion is consistent with previous works on the consuming patterns of these opposed political groups. In parallel, the qualitative opinion on the product was not influenced by the external review, with the participants keeping their original positions on the analyzed luxury products.
RESUMO
Esta dissertação investiga a influência que a ideologia política tem na perceção de produtos de luxo em consumidores portugueses. Foi demonstrada uma relação positiva entre conservadorismo político e mais disposição a pagar através de análises estatísticas, indicando que consumidores mais conservadores tendem a pagar um extra por produtos de luxo do que consumidores mais liberais (de acordo com literatura desenvolvida anteriormente). Esta dissertação explorou também a influência de uma review, por um líder de opinião, na disposição a pagar por um produto. Por um lado, a maioria dos participantes do estudo não alterou a sua disposição a pagar após terem lido a review. Consequentemente, é sugerido que consumidores mais conservadores tenham mais probabilidade do que consumidores mais liberais a valorizar aprovação externa (neste caso, uma review de um líder de opinião no assunto) no que toca à compra de produtos de luxo. Esta conclusão é consistente com trabalhos prévios relativamente aos padrões de compra destes grupos de opostos políticos. Em paralelo, a opinião qualitativa de um produto não foi influenciada pela opinião externa, já que os participantes mantiveram as suas posições originais sobre o produto de luxo em questão.
5
Table of Contents
Introduction ... 9
Explanation of Significance ... 10
Literature Review ... 11
Political Ideology in Europe ... 11
Liberals and Conservatives ... 11
Luxury Consumption ... 13
Forms of Differentiation... 15
Differentiation and Political Ideology ... 16
Statement of Objective, Research and Constraints ... 16
H1: Conservative-leaning consumers react more positively to reviews than liberal-leaning consumers ... 16
H2: The overall opinion of the products does not change significantly after reading the reviews ... 17 Analyses Performed ... 18 Variables Added ... 19 Sample Description ... 21 Demographics ... 21 Political Ideology ... 24
Opinion on Luxury Products ... 25
Analysis I ... 27
H1: Conservative-leaning consumers react more positively to reviews than liberal-leaning consumers ... 27
Method ... 27
Results ... 28
Discussion ... 28
Analysis II ... 29
H2: The opinion of the products tends to stay the same. ... 29
Method ... 30
Results ... 30
Discussion ... 32
Other Relevant Results ... 33
Income and Age ... 33
Income and Savings ... 34
Conclusion... 35
6 Future Research ... 37 Appendices ... 38 Appendix 1. Survey ... 38 Appendix 2. Pordata ... 49 References ... 52
7
Acknowledgements
This dissertation would not have been possible without the help and support of many people.
First and foremost, I want to thank my supervisor, Professor Daniel Fernandes, who gave me the opportunity to write a dissertation on some of the subjects I am truly passionate about.
To my Professors during the Master’s program who contributed to my personal and professional development. In particular, I want to thank Professor María Fondo, for everything she taught me.
To my friends and close relatives for being kind, supportive and cheerful.
Finally, I want to thank the people who were with me during every step of this stage. Mom, Dad, Luis and Francisco, thank you for always celebrating with me the small victories and overall giving me the opportunity to grow, improve and persevere.
9
Introduction
The present study aims at understanding the role of political ideology on the perception and consumption of luxury products.
On the one hand, the theme of political ideology has been subject to the most varied research, not only in relationship with marketing and consumer behavior, but also on many other disciplines, like sociology and psychology (Fraley, 2012, Graham, Haidt and Nosek, 2009). As will be explored further on during this dissertation, political ideology has been proven to have an impact that goes way beyond the party chosen on elections day. Specifically, the dependence of consumption patterns on the political ideology (in this case simplified with the opposition conservatism – liberalism) was a target of this research.
By understanding more of the consumers’ perspectives on politics, it is possible to collect more information on several dimensions of their lives. For example, which types of products are consumed, which kinds of diets are adopted, which stores are preferred and even which financial services are chosen (Dhont and Hodson 2014, Experian Simmons 2011).
This data is extremely important for a marketer, because it not only allows for a more accurate communication strategy, but also for making products that better fit the preferences of consumers throughout industries and regions.
On the other hand, the areas of luxury strategies and marketing will be addressed, since the products analyzed in this dissertation can be considered to be luxury ones (Chloé,
Patek Philippe, Aston Martin and Cartier).
By definition, a luxury product is one that behaves such as when “the consumer gets more
income, he consumes more of both goods but proportionally more of one good (the luxury good) than of the other (the necessary good)” (Varian, 1992). This means that the higher
the income, the more luxury products the consumer will buy (Caserta, 2008).
It is well-known that Classical Economics is based on the rationality of the consumer. Economically speaking, the agent searches for the product that offers maximum quality for the minimum price. “The economic man was assumed to make economic and financial
decisions based on logic. If aware of all the pertinent facts, the economic man would take the actions that led to the most profitable outcome. The economic man was assumed to
10 be self-aware, self-disciplined, analytical, self-centered, and able to delay gratification for a greater gain or good” (Moglia, 2013).
However, it has been found that many times the consumer acts irrationally, prioritizing hedonic feelings and emotions over logic and reason. This may help to explain the strength and success of the luxury and hedonic markets (Bilge, 2015). The consumer doesn’t assess whether he needs the product or not. Instead, it has more to do with whether he likes it or not. The reason to buy something is rather linked with the way the consumer is going to feel about himself later on (Levy, 1959).
Hedonic experiences can be described as experiences that involve “multisensory, fantasy
and emotive” dimensions of the consumer’s relationship with the product. The
multisensory aspect has to do with tastes, sounds, scents, etc. (Hirschman, 1982). Having this in mind, one of the characteristics of the luxury industry is to include hedonic experiences during the purchasing process, whether that is with the music in store, the scent, with the way the bags and wrapping paper feel or even with the way products are disposed in the store (Kapferer, 2011).
The main purpose of this dissertation is to understand the role political ideology plays on the consumer’s perception and behavior towards luxury products. Moreover, it also studies how sensitive different consumers are (with different political stances) to product reviews by opinion leaders on the field.
Explanation of Significance
Even though there is extensive research on political ideology and luxury products, which have been thoroughly investigated separately, the author considered that there was not enough literature on the role political ideology played on the perception of luxury products. Thus, the main objective of the present study is to bring together the two aforementioned themes and establish a relationship between them.
Particularly the article developed by Orbadayeva and Fernandes (2018) demonstrated a clear relationship between political ideology and consumption, in a general sense (newspapers, media and entertainment, etc.). However, this dissertation aims at deepening the theme of that article, by focusing solely on luxury products rather than on general ones.
Furthermore, it is hypothesized that the quest for status depends on the individual’s political ideology. Hence, the relationship between the way consumers value (and react
11
to) reviews elaborated by opinion leaders and their political ideology will be added to the present literature.
Literature Review
Political Ideology in Europe
Even though most of the research that precedes this investigation is based on American consumers, this study took place in Portugal. Before moving on to the remaining literature, it is important to draw attention to the differences in politics perspective between European and American consumers.
The scale of “liberals versus conservatives” provides an overall, rough idea of the range of today’s political ideologies. Nonetheless, it can be restrictive and not represent the broader reality, as there can exist several dimensions on each ideology (Social and Economic, for example) that are not covered by the simple spectrum that is used hereby. It is suggested that there can even exist different combinations of consumers. For instance, consumers can be economically conservative but socially liberal. Therefore, it is possible to prove that a self-proclaimed conservative can actually be liberal in other dimensions, which is in fact neglected by the present scale of ideology. (Everett, 2013).
The concepts of liberalism and conservatism in Europe are rather different than the same concepts in America. One of the fact that contributes to the difference of ideas can be that, whereas Europe has witnessed revolutions and wars in the name of democracy (the French, for instance), America was born a free country (out of the American Revolution) (Schlesinger, 1956).
Liberals and Conservatives
As mentioned above, the subject of political ideology has been controlled under innumerous studies, given its impact on so many levels of society. Despite the fact that the study of the present dissertation was conducted with Portuguese consumers, the consumers were characterized using a political spectrum that went from extremely liberal to extremely conservative.
12
What are some of the characteristics found on conservatives and liberals? Is their way of consuming influenced by their political orientation?
Indeed, political ideology can be defined very early in the life of an individual, and not only when young adults are eligible to vote. Behaviors and education experienced by children during their childhood and teenage years can be a predictive factor of their political ideology later on (events marked even on 1 month old children). It was possible to observe that authoritarian behaviors from the parents promoted conservative ideologies at 18 years old. For example, parents agreeing that children should always behave to their parents, or that the most important thing to teach is to obey to whoever is in authority were behaviors that contributed to more conservative young adults. Similarly, parents who promoted egalitarian attitudes were likely to lead their children to be liberals at 18 years old. For example, parents agreeing that children should be allowed to disagree with them or seriously considering children’s ideas when making family decisions were contributive factors to raise liberal individuals (Fraley, 2012).
The difference of political ideologies is such that it is even theorized that conservatives and liberals rely on different moral sets. According to Graham et al., liberals would more likely base their morality on the psychological foundations of Harm/Care (e.g. “it can never be right to kill a human being”) and Fairness/Reciprocity (agreeing or disagreeing whether or not someone was denied his or her rights), while conservatives would add to these elements the layers of Ingroup/Loyalty (e.g. “the government should strive to improve the well-being of people in our nation, even if it sometimes happens at the expense of people in other nations”), Authority/Respect (e.g. “if I were a soldier and disagreed with my commanding officer’s orders, I would obey anyway because that is my duty”) and Purity/Sanctity (e.g. “chastity is still an important virtue for teenagers of today, even if many don’t think it is”). The authors considered these different sets of moral foundations an important cause of why liberals and conservatives often don’t understand each other and disagree on so many subjects (Graham et al. 2009).
As Jost et al. importantly pointed out, conservatives tend to resist change, while liberals tend to enforce it; furthermore, conservatives may be more comfortable with accepting inequality than liberals. The variability of results is often explained by different needs to reduce uncertainty and threat (Jost et al. 2008). These differences can also be argued by another example, which is the fact that in more conservative counties, it is less likely to complaint and dispute resolutions than in less conservative counties (not only to report a complaint, but also to dispute the proposed resolution) (Jung et al. 2017).
13
Variety seeking can also be traced to the positive indirect effect of conservatism when it comes to following the social norms. This effect is even greater than the negative indirect effect by the desire of control, which means that variety seeking is more present in more conservative consumers rather than on less conservative consumers. And because conservatives are comfortable with the idea of inequality, they have a higher inclination to engage in materialism and conquer for social status (Fernandes and Mandel 2014, Altemeyer, 1998, Jost et al. 2008).
Based on one’s political ideology, it is possible to predict a series of behaviors and consumption habits on food, entertainment and even insurance- for example, liberals are likely to own Mac Books and republicans are expected to have a mutual fund with Fidelity Investments. Even in terms of diet, it is possible to verify that political ideology plays its role. Conservatives demonstrate higher consumption of meat and animal exploitative products than liberals, not only because they enjoy the taste of meet, but because giving up meat would mean disrupting the social norms as well, and conservatives are characterized as consumers who are not comfortable with breaking the social rules (Dhont and Hodson, 2014, Jost et al. 2008, Experian Simmons 2011).
Another study found that when the advertising appeal corresponded to the viewer’s political ideology, the message would resonate with the consumer and would make him feel good about the ad’s message. The key argument that would make liberal consumers resonate with the appeal, in this case recycling, had to be one that stressed fairness and avoiding harm to others. Yet with conservatives, it was found that they responded better to an argument that focused on duty and an obligation to adhere to authority (Kidwell et
al. 2013).
In light of some of the arguments presented, it is possible to infer that more conservative and more liberal consumers respond differently to distinct stimuli and behave often antithetically in the marketplace, which means their needs must be addressed separately with tools and arguments that should be adapted accordingly.
Luxury Consumption
It is hypothesized that luxury has been present ever since the humanity gained consciousness of mortality. A simple example can be when humans started burying their
14
loved ones along with their most precious objects (jewels, horses, weapons, etc.) so that they could be successful in their following journey (Kapferer, 2011).
For so long, luxury was a “visible result” (Kapferer, 2011) and a clear sign of social stratification. An individual signaled to the society that he was superior and wealthier by using precious stones or expensive clothing. Even so that only certain people were allowed to wear special fabrics or designs. Nonetheless, the world witnessed an evolution in society and around the XVIIIth Century the social stratification, as a rule, disappeared.
The new concept in place was that the rich had money because they had earned it fairly through their intelligence, merit and hard work, not because they were simply born into aristocracy or wealthy families. Luxury, therefore, reappeared in order to recreate the stratification that had once existed. Luxury products are now used to show others that the individual can afford it, to show his wealth and to be perceived as belonging to a higher social status (Kapferer, 2011, Han et al. 2010).
As of today, luxury goods can be bought by anyone, although considering their financial limitations. As a rule of thumb, the higher the income, the higher the propensity to buy this sort of product (Dubois and Duquesne, 1992). But not all luxury products are the same nor remotely serve the same purpose. Different products convey different perceptions to others and specific brands or models will allow an even greater (or smaller) differentiation of classes. Some groups try to communicate to their inferiors (those they want to dissociate from) and others try to communicate to their perceived peers (with whom they want to associate), and the products used for each purpose are absolutely different. In fact, loud items, with the brand visible and clear, are often used to signal to a higher class that they belong up there. However, more sober articles, without the brand visible or without logos, are normally used to signal to their connoisseur peers, in the same social hierarchy (Han et al 2010).
“The desire for status motivates much of consumer behavior” (Eastman and Goldsmith 1999). Success is believed to be transmitted through objects that possess status. Thus, objects that are more expensive than the average show how much money one has made and the success conquered. After all, if regarding an individual as the sum of all his possessions, then his success can also be measured by them, not only in terms of quantity but also in terms of quality (Belk, 1988).
15
Forms of Differentiation
In fact, the motivation to associate with a particular group and to dissociate from another can be extremely strong. Sets of brand associations play a key role on peoples’ personalities, not only in terms of what they aim to achieve in life, but also when it comes to their own construction of self. The motivation behind the choice of each brand in their set can be found in the groups they want to identify with or want to be perceived as part of. The identity of people can also be traced to which groups they want to belong to and to which groups they want to distance themselves from, and even the types of products chosen signal the kinds of groups they are trying to avoid or integrate. This choice of products is mostly correlated to self-presentational concerns (Escalas and Bettman, 2003, White and Dahl 2006).
Because the members of society are not all equal, some want to show-off their possessions in a loud manner (in which case everyone recognizes their status) and others in a sober manner (only communicating with their peers and connoisseurs), depending on the message that is intended to be transmitted. In both cases, there is the need to show, to whomever, that they are worthy of status and recognition, and that they belong to a higher social hierarchy (Han et al. 2010).
Differentiation is an extremely important variable to study, because it is the basis for the construction of self-identity, as means of self enhancement through social comparison. It actually was proved that the distinctiveness principle is not exclusive to individualistic cultures, which proves its dimension and power across countries and cultures (Vignoles et al. 2000).
It has been hypothesized that there are two types of differentiation- the vertical and the horizontal. The vertical differentiation is often characterized by an attempt to be recognized as superior by others in the perceived social hierarchy, showing more success and wealth, owning better things overall (higher-status brands). On the other hand, horizontal differentiation is related to individual differentiation within the same perceived level of the hierarchy. The purpose is not to stand out as “better” but simply as “different”, unique and original, showing the personality through external cues (bold colors, unique designs). This categorization of consumers lets on a division into two groups with different consumer patterns, decision making processes and preferences (Hsee et al. 2008, Vignoles et al. 2000, Belleza et al. 2014).
16
Differentiation and Political Ideology
The differences in political ideology can be rooted to the concept of social hierarchy. In fact, conservatives and liberals, despite perceiving and interpreting it in a different way, are both aware of it and are both able to recognize it in the society (Norton and Ariely, 2000). The key difference, however, lands on its legitimacy. While conservatives believe that the social hierarchy is legitimate and a direct consequence of individual actions and competences, liberals are against it and hold that all individuals have the same opportunity to climb the social ladder on their own, regardless of the level they were born into (Graham et al. 2009, Crawford et al. 2015).
Ordabayeva and Fernandes (2018) propose that political ideology plays a significant role when it comes to individual differentiation (vertical vs. horizontal) and also when it comes to hierarchy beliefs. It was proved by their study that conservatives are more likely to vertically differentiate and liberals more likely to horizontally differentiate. This is linked again with the notion of social hierarchy and how to perceive it. While conservatives try to vertically differentiate, using high-status products to convey a higher position in the social hierarchy, liberals differentiate in a horizontal manner, by using original and unique products that position themselves alongside their peers in society (Bellezza et al. 2014).
Thus, for each type of consumer, the communication to address its needs, desires and aspirations has to be adequate and flexible. The question on how to best address each type of consumer will be further discussed.
Statement of Objective, Research and Constraints
This research will focus on the way political ideology influences the appreciation and perception of luxury products.
Not only that, but also the importance of a review on the consumer’s opinions and willingness to pay.
H1: Conservative-leaning consumers react more positively to reviews than
liberal-leaning consumers
17
As studied by Flynn et al. (1996), consumers influence other consumers and are influenced by other consumers as well, not only directly (by giving advice or explaining the product/store) but also indirectly (by acting as role models and spreading information).
In fact, consumers are much more likely to trust the opinions of others rather than advertisement or impersonal advice from people they do not find familiar. Particularly in social media, it was found that for tourists, the reviews read and opinions of others influenced them even after the trip was over (Flynn et al. 1996, Song et al. 2017).
On the other hand, as previously explained, conservatives tend to follow the social norms and rules (Fernandes and Mandel 2014, Altemeyer, 1998). This means that they will most likely try to stick to what is accepted and mainstream to the general public’s opinion. Arguing that a certain decision was made due to the ideas of an opinion leader can be recognized as more legitimate than justifying it only based on a personal choice.
Thus, it is hypothesized that more conservative-leaning consumers are more likely to change their willingness to pay for a specific product after reading a review of an opinion leader than more liberal consumers.
H2: The overall opinion of the products does not change significantly after
reading the reviews
The second hypothesis suggests that the respondents’ opinions (qualitative opinions) will subtly increase, yet in a non-significantly manner.
The first variable to analyze will be source credibility. The effect of source credibility is stronger when the consumer is reading the review in a heuristic manner, rather when reading it in an analytic manner (Dou et al. 2012). Considering that the readers in this survey were reading everything in the most analytical way possible, in order to do everything correctly and not misread any part, it is predicted that their opinions will not be influenced by heuristics, thus staying the same.
Another variable to take into account is the visibility of the source of the review. In the survey of the present study, no authors (fictional or real) were incorporated into the reviews, in order to avoid influencing in any way the interpretation of the reviews. Apart from the job description of each review (blogger or expert), no information on the source
18
was showing. Therefore, this factor can be contributing to the lack of shift in opinions (Dou et al. 2012).
On the one hand, it has been proved that consumers are more likely to trust negative reviews rather than positive ones, due to the fact that they might think the writers of the negative reviews have external motivations to do so (the author truthfully thinks that the product is not good), which represents a more honest and real opinion. On the other hand, positive reviews may be perceived as related to internal motivations (earning money to say positive things about the brand). Thus on average, negative reviews will be considered to be more helpful (Sen and Lerman, 2007). Because the reviews present in the survey were all positive on the products, it is suspected that the respondents may not find them very helpful when it comes to change their opinions.
What also contributes to the product judgments (willingness to pay, buying intentions, etc.) are the variables of trustworthiness, expertise and external attribution (Dou et al. 2012). As will further be discussed, the respondents of this survey did not consider the reviews to be neither extremely realistic (2.49/5 points) nor to demonstrate a high level of knowledge (5.77/10 points). Trustworthiness and expertise are shown to have mediocre results, which can explain the almost non-existent shift in the opinions of consumers and the suspicion on the lack of opinion shifting.
Analyses Performed
In order to analyze the opinion of consumers, a survey was distributed online, through e-mails and social media. It was the most cost-saving option to target the highest number of respondents, but also to obtain results as quickly as possible.
Before the beginning of the survey, no information on the purpose of the study was explained, because it was the author’s intention that the respondent was not aware that what was trying to be assessed was his political ideology and his opinion on luxury products (particularly on the willingness to pay of some items shown throughout the process).
The structure of the survey was divided into several parts (Annex 1. Survey): the first question assessed demographic data (age, gender, savings, income, education level). Next, two sets of questions regarding political ideology were followed. A first group constituted of separate sentences based on the model of Nail et al. (1999), with the
19
purpose of assessing the respondent’s political ideology in an indirect manner. A series of separate sentences were shown and the respondent had to choose the level of agreement or disagreement. The second group only included a single scale of political ideologies based on the model of Jost et al. (2003, 2007), where the respondent had to place his own opinion, from a range of extremely liberal to extremely conservative. After this block, a group of questions was presented with the intention of investigating the theme of luxury products and patterns of decision making. These questions had the purpose of helping characterizing the sample, and understanding how many respondents had ever purchased a luxury item, why, or whether they had never bought one, and why.
Another block was introduced, and the respondent had to choose one of 4 products- a bag (Chloé), a car (Aston Martin), a watch (Patek Philippe) and a necklace (Cartier). The respondent was asked to choose one of the images, but with the particularity that none of the images showed the brands, in order for the participant to struggle guessing the brand and, subsequently, assume its price. Unless the viewer had deep knowledge on the products or was a connoisseur, it was hard to predict its real price. In fact, the great majority of respondents undervalued all products. For instance, the real price of the Chloé
Faye bag, as of 2017, was 1.450€, and the average of willingness to pay for the
respondents was 209.18€. Next, the participants had to answer some questions regarding their qualitative opinions on the product (whether they liked it, would buy it, etc.). On a second instance, a review was now showing (the text was the same for each product but the author who signed it was randomized between a blogger and an expert, such that the respondent had no way to know that there existed another author). The same set of questions regarding their opinions on the product was showed again, only this time the respondents had more information on the product and could better predict its price.
Variables Added
Besides the variables included on the survey, which were extracted from the SPSS, several more were added to the Data. Most of the analyses ran had as key variables these transformed new variables, composed out of primary data.
The first one was a Mean Centered variable, using only the Political Ideology variable from the survey (the question where the respondent was asked to position his political ideology on a scale- Q39). The first set of questions where the respondent was asked to
20
position his opinion on several sentences was not used for the purposes of the subsequent analyses. In fact, the values taken from the study of this first set of questions performed were not coherent, the results could not be logically explained and would be the cause of wrongful conclusions.
The reason the variable of Political Ideology was mean centered was merely to simplify the results and have a standardized variable (Mean_Centered_PI), which could easily be analyzed and compared.
The second variable added was the Status Coefficient. This was a coefficient that signaled if the respondent had been exposed to a blogger or low-status review (-1) or instead exposed to an expert or high-status review (1). This variable ended up not being significant for the study, since there were no relevant differences between the willingness to pay of each case. Table 1 represents the linear regression between status and the variation of willingness to pay. The p-value=0.969 shows that there is no relationship whatsoever between willingness to pay and status.
Table 1.
Linear regression between status coefficient and variation of willingness to pay Model Summaryb Model R R Square Adjusted R Square Std. Error of the Estimate
Change Statistics
Durbin-Watson R Square Change F Change df1 df2 Sig. F Change 1 ,002a 0,000 -0,003 62662,468 0,000 0,001 1 345 0,969 2,001 a. Predictors: (Constant), Coeficientes_Status
b. Dependent Variable: T2-T1
There was also a variable of interaction created that was the product of the Mean_Centered_PI by the Status Coefficient (only mentioned as “Interaction”).
Another variable created was the difference between the willingness to pay of the respondents on T2 and T1 (Avaliações T2-T1), used extensively in the study as a way to analyze the variation of values within the two time spans, separated by the review. The means of the questions regarding the respondent’s qualitative opinion of the products were also included for T1 and T2 and for both groups of questions (Mean_O1T1; Mean_O1T2; Mean_O2T1; Mean O2T2). Out of these variables, another two were created taking into account the variation between T1 and T2. These variables were called
21
‘variaçãoO1’ and ‘variaçãoO2’). These represent, out of each set of questions, the shift of opinions that occurred, before and after the review was displayed.
Sample Description
DemographicsThe survey was answered by 470 people. However, only 433 answered it fully and some of the answers, by the end of the study, were only answered by 374 people. The percentages used to describe the sample will be the valid percentage, as it will provide a more accurate picture of the sample.
Male participants represent 27.7% of the sample, whilst female respondents represent 72.3% of the sample. Table 2 represents the demographics for the variable of Gender.
Table 2.
Gender Demographics
Género
Frequency Percent Valid
Percent Cumulative Percent Valid Masculino 120 25,5 27,7 27,7 Feminino 313 66,6 72,3 100,0 Total 433 92,1 100,0 Missing System 37 7,9 Total 470 100,0
In terms of age, 52.7% of the respondents were aged between 18 and 24; 19.2% were aged between 45 and 54; 13.4% were aged between 55 and 64; 7.4% were aged between 25 and 34; 5.1% were aged between 35 and 44; 1.8% were aged over 65 and 0.5% were aged between 12 and 17. Table 3 shows the age distribution of the survey sample.
22
Table 3. Age Demographics
Frequency Percent Valid Percent Cumulative Percent 12-17 2 0,4 0,5 0,5 18-24 228 48,5 52,7 53,1 25-34 32 6,8 7,4 60,5 35-44 22 4,7 5,1 65,6 45-54 83 17,7 19,2 84,8 55-64 58 12,3 13,4 98,2 65+ 8 1,7 1,8 100,0 Total 433 92,1 100,0
Graduate respondents were represented by 59.6% of the sample; 26.1% owned a Master’s degree; 12.2% had finished High School; 1.8% owned a Doctorate Degree and 0.2% had not finished Basic Education. Table 4 provides an overview on the education of the respondents, in terms of the last concluded diploma.
Table 4. Education Level
Nível de Escolaridade (último nível concluído) Frequency Percent Valid
Percent
Cumulative Percent Valid Ensino Básico 1 0,2 0,2 0,2
Ensino Secundário 53 11,3 12,2 12,5 Licenciatura 258 54,9 59,6 72,1 Mestrado 113 24,0 26,1 98,2 Doutoramento 8 1,7 1,8 100,0 Total 433 92,1 100,0 Missing System 37 7,9 Total 470 100,0
23
When it comes to the net monthly wage, 37.6% of the respondents earned between 0€ and 500€; 17.6% earned between 1.001€ and 2.000€; 15.2% earned between 1.501€ and 2.000€; 9.9% earned between 501€ and 800€; 8.8% earned between 801€ and 1.000€; 6.2% earned between 2.001€ and 3.000€; 2.8€ earned between 3.001€ and 5.000€; 0.9% earned between 5.001€ and 8.000€ and 0.9% earned over 8.001€.
Table 5. Net Monthly Wage
Por favor selecione a opção que mais se aproxima do seu rendimento mensal líquido(€)
Frequency Percent Valid
Percent Cumulative Percent Valid 0-500 163 34,7 37,6 37,6 501-800 43 9,1 9,9 47,6 801-1.000 38 8,1 8,8 56,4 1.001-1.500 76 16,2 17,6 73,9 1.501-2.000 66 14,0 15,2 89,1 2.001-3.000 27 5,7 6,2 95,4 3001-5000 12 2,6 2,8 98,2 5001-8.000 4 0,9 0,9 99,1 >8.001 4 0,9 0,9 100,0 Total 433 92,1 100,0 Missing System 37 7,9 Total 470 100,0
The amount of money saved (in the bank or financial instruments) was also assessed- 44.1% of the respondents had between 0€ and 2.000€ saved; 27.7% had between 2.001€ and 10.000€; 18% had between 10.001€ and 50.000€; 3.9% had between 50.001€ and 100.000€; 3.2% had over 200.001€ and 3.0% had between 100.001€ and 200.000€.
24
Table 6. Savings
Por favor selecione a opção que mais se aproxima de todas as suas poupanças
Frequency Percent Valid
Percent Cumulative Percent Valid 0-2.000 191 40,6 44,1 44,1 2.001-10.000 120 25,5 27,7 71,8 10.000-50.000 78 16,6 18,0 89,8 50.001-100.000 17 3,6 3,9 93,8 100.001-200.000 13 2,8 3,0 96,8 >200.001 14 3,0 3,2 100,0 Total 433 92,1 100,0 Missing System 37 7,9 Total 470 100,0 Political Ideology
On a scale of 1 (Extremely Liberal) to 9 (Extremely Conservative), the results were the following- 32.9% of the respondents considered themselves to be at the position 5 (exactly the middle); 25.7% at the position 4; 16.3% at the position 3; 10.1% at the position 6; 7% at the position 2; 4.3% at the position 7; 1.9% at the position 1 (extremely liberal); 1.4% at the position 8 and 0.5% at the position 9 (extremely conservative). This suggests that our sample leans slightly more to the liberal side of the political spectrum. Excluding the 32.9% of respondents that considered themselves to be in a neutral position, the majority of respondents identify more with the liberal side (50.8%) than with the conservative side.
Table 7 has all the answers regarding the distribution of political ideology of the respondents of the survey.
25
Table 7.
Political Orientation (Extremely Liberal – Extremely Conservative)
Orientação Política Frequency Percent Valid
Percent Cumulative Percent Valid Extremamente Liberal 8 1,7 1,9 1,9 2 29 6,2 7,0 8,9 3 68 14,5 16,3 25,2 4 107 22,8 25,7 50,8 Neutro 137 29,1 32,9 83,7 6 42 8,9 10,1 93,8 7 18 3,8 4,3 98,1 8 6 1,3 1,4 99,5 Extremamente Conservador 2 0,4 0,5 100,0 Total 417 88,7 100,0 Missing System 53 11,3 Total 470 100,0
Opinion on Luxury Products
For the effect of this survey, a luxury product is considered to be any product from the luxury pyramid (Kapferer, 2011), from cosmetics, perfumes and sunglasses, to high-end luxury products such as yachts, supercars and haute couture, and include designer handbags, shoes and experiences at high-end restaurants.
The consequences of misinterpreting the definition of luxury were considered, given that there is still no consensus on it. However, it was decided that in order to have more responses, the definition of the concept had to be broader and also include items that are not completely defined as luxury, such as the products inserted at the bottom of the pyramid. This way, and since the resources to reach the respondents were rather limited, it was possible for the majority of the respondents to answer that they had, at least once, ever bought a luxury product.
On this sample, 91.6% of the respondents had already acquired at least one luxury product. Besides, the mean Political Ideology of those who had ever bought a luxury product was higher than that of those who had never bought one (4.40 vs. 4.14, respectively), thus validating that the consumption of luxury products can be associated
26
with more conservative-leaning consumers (Dubois and Duquesne, 1993). Table 8 represents the pattern of luxury consumption among the respondents.
Table 8.
Consumption of Luxury Products
Já alguma vez adquiriu um produto de luxo?
Frequency Percent Valid
Percent Cumulative Percent Valid Sim 381 81,1 91,6 91,6 Não 35 7,4 8,4 100,0 Total 416 88,5 100,0 Missing System 54 11,5 Total 470 100,0
Out of these, 67.5% had bought both for themselves and for someone else; 29.9% had only bought for themselves and 2.6% had only bought for someone else. Table 9 shows to whom consumers buy luxury products.
Table 9.
To whom are the luxury products bought
O(s) produto(s) que adquiriu foram para quem?
Frequency Percent Valid
Percent Cumulative Percent Valid Para si 114 24,3 29,9 29,9 Para outros 10 2,1 2,6 32,5 Ambos 257 54,7 67,5 100,0 Total 381 81,1 100,0 Missing System 89 18,9 Total 470 100,0
The 8.4% of respondents that had never bought a luxury product- 45.7% did not identified themselves with luxury products; 31.4% because they could not afford it; 5.7% because they preferred counterfeits and 17.1% for other reasons (mostly arguing that there was no need to spend that much money, or because they would rather spend the money on other things). Table 10 shows the distribution of reasons some of the respondents had never bought a luxury product before.
27
Table 10.
The reason to have never bought a luxury product
Porquê? (Porque nunca adquiriu?)
Frequency Percent Valid
Percent
Cumulative Percent Valid Because I don’t
identify myself with luxury products 16 3,4 45,7 45,7 Because I can’t afford it 11 2,3 31,4 77,1 Because I prefer counterfeits 2 0,4 5,7 82,9 Another reason 6 1,3 17,1 100,0 Total 35 7,4 100,0 Missing System 435 92,6 Total 470 100,0
Analysis I
H1: Conservative-leaning consumers react more positively to reviews than
liberal-leaning consumers
Method
As mentioned earlier, the variable of political ideology had to be based on the second question on political ideology of the questionnaire, where it is asked the participants to locate themselves on a political ideology scale. It was then altered into a Mean Centered Variable, as previously explained.
In order to analyze this hypothesis, a linear regression was performed. A new variable was created, defined by the difference between the willingness to pay in T1 and T2. This was the dependent variable, and the independent variable was the political ideology (mean centered).
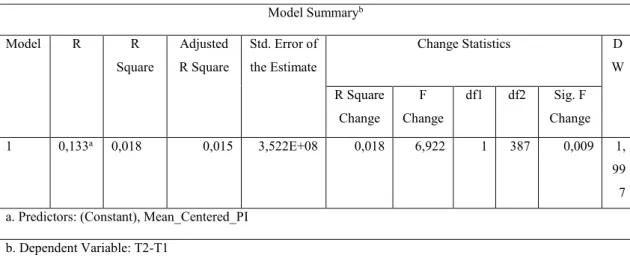
28 Results
After running the linear regression on SPSS, having the dependent variable as the variation of willingness to pay and the independent variable as the political ideology (mean centered), the p-value=0.009 was obtained, thus representing a statistically significant result. The standardized Beta was 0.133. The R squared corresponded to 0.018, which means that only 1.8% of the variance of the dependent variable (willingness to pay) was explained by the independent variable (political ideology).
Table 11 describes the aforementioned linear regression between the variation of the willingness to pay and the political ideology.
Discussion
These results prove that there is a statistically significant relationship between political ideology and the willingness to pay of a product, specifically after the viewers have been exposed to a review, with a confidence level of 5%. Political ideology is the variable that motivated higher willingness to pay on T2.
Another regression was performed in order to understand whether conservatives showed higher willingness to pay only on T1. In fact, that analysis showed that conservatives and liberals proposed similar values for the product, meaning that given the same product and the same amount of information, conservatives and liberals tend to behave the same way.
Table 11.
Linear Regression (political ideology and variation of willingness to pay)
Model Summaryb Model R R Square Adjusted R Square Std. Error of the Estimate Change Statistics D W R Square Change F Change df1 df2 Sig. F Change 1 0,133a 0,018 0,015 3,522E+08 0,018 6,922 1 387 0,009 1, 99 7 a. Predictors: (Constant), Mean_Centered_PI
29
However, after being exposed to a review, conservatives evaluated higher, on average, than liberals. Given that the only variable that changed was the review, it can be established a direct consequence of the information retrieved in the review and adapted onto the new evaluation.
One of the reasons that can explain this behavior can be the fact that, on a first instance, the respondents were not aware (or may not have been aware) that the products were luxury ones, thus providing an underestimated willingness to pay. However, after learning about the characteristics of the products and the luxury component, are more willing to pay a premium for the acquired status (Han et al. 2010).
It is important to stress that the majority of the respondents did not change their willingness to pay after reading the reviews. For the watch, only 25 out of 77 participants changed their mind and for the car, only 25 out of 70 participants. However, among those who changed, their political ideology was more conservative-leaning, going in line with the proposed hypothesis. The average political ideology of those who changed their willingness to pay on the car was 4.75, versus 4.35 of those who remained with the same value. When it comes to the watch, the average political ideology of those who changed their willingness to pay was 4.48, versus 4.37, which represents the average political ideology of those who kept the same answer.
Nonetheless, this scenario was not verified for the bag. In fact, the participants that changed their willingness to play were actually more liberals (4.23) than those who remained with the same value (4.40). This discrepancy can be explained by, at least, two reasons. One, that this hypothesis is not applied equal to different products. The fact that the bag was the most accessible product out of the four can have an influence on this analysis. It resonates differently with consumers in comparison with a car or a watch. The second reason this hypothesis was not verified can be due to statistical problems (the sample is not evenly distributed nor is representative). For the necklace, because it was chosen by 17 participants only, it was very difficult to draw conclusions out of such a small sample.
Analysis II
30 Method
For this analysis, a Paired Sample T-Test was performed. The main purpose was to compare the means of answers of two groups of questions with the same participants, separated by different temporal sections, in which respondents were shown a review of the selected product. As stated before, a set of questions related with the product selected by the respondent was shown, assessing their opinions and preferences about the product. After the review, the same set of questions was asked again. Each set of questions was constituted of 2 groups of questions (each with their own scale).
The first set (A1) was constituted by 5 questions from 1 (Totally agree) to 5 (Totally disagree). Then, still in the same set, another group of questions (A2) was shown- 3 questions from -4 to 4, being -4 the lowest and 4 the highest value attributed to the product.
As such, positive shifts to the opinion of consumers are reflected on a decrease of values on the first group of questions (1->5), due to positive sentences being associated with lower values, and in an increase of values on the second group of questions (-4–>4), because the more positive associations were linked to higher values in the scale.
To avoid inconsistent results, a mean of all the answers in each group of questions was computed and then used for the following analysis.
As a side analysis, the results of the questions regarding the trustworthiness and the level of knowledge of the author of the review were analyzed. This was performed in order to confirm or reject part of the justification of the hypothesis, which claimed that the level of trustworthiness and expertise contribute positively to the product judgment (Dou, 2012).
Results
The difference between the means of the first group of questions (in T1 and T2) was not significant (p-value=0.305). Even though the means decreased (became more positive: M1=2.41; M2=2.38), it was not enough to be considered significant. In terms of the second group of questions, the results were also not significant, having a p-value=0.622. Again, the means of the responses became more positive (M1=2.25; M2=2.27), but not in a significant manner. Table 12.1 provides the information gathered for the first group
31
of questions and Table 12.2 shows the results for the Paired-Samples T-Test performed for the second group of questions.
Table 12.1
Paired Samples T-Test for A1
Paired Samples Test
Paired Differences t df Sig.
(2-tailed) Mean Std. Deviation Std. Error Mean 95% Confidence Interval of the Difference Lower Upper Pair 1 Mean_A1T1 - Mean_A1T2 0,02593 0,49040 0,02522 -0,02367 0,07552 1,028 377 0,305 Table 12.2
Paired Samples T-Test for A2
Paired Samples Test
Paired Differences t df Sig. (2-tailed) Mean Std. Deviation Std. Error Mean 95% Confidence Interval of the Difference Lower Upper Pair 1 Mean_A2T1 - Mean_A2T2 -0,02028 0,79817 0,04105 -0,10100 0,06044 -0,494 377 0,622
The Cronbach’s alpha for both groups of questions was, respectively, 0.880 and 0.918. These values show high reliability between the data.
In regards to the analysis of the level of expertise and trustworthiness the means were, respectively, 2.49 (from 1 to 5) and 5.77 (from 1 to 10). Tables 13 and 14 represent both values for the Cronbach’s alpha of the Paired Samples T-Test.
32
Table 13.
Cronbach’s Alpha for A1
Reliability Statistics Cronbach's Alpha Cronbach's Alpha Based on Standardized Items N of Items 0,880 0,881 2 Discussion
As predicted by the present literature review, the opinions of consumers (both conservatives and liberals) did not change overall (with a very subtle improvement). Not only was the Paired Sample T-Test insignificant, but also the rates of expertise and trustworthiness were considered to be rather insignificant as well.
Several variables could have contributed to this end result, and it is difficult to pinpoint exactly what. However, some conclusions can be taken from this experiment.
First of all, a review that does not include the name of its author, and the only information on it is his profession, does not help the respondent finding a cue in terms of the identity of the author, which makes the convincing part much more difficult.
Second of all, the fact that the review only expressed positive characteristics of the product can be seen by the respondent as strange and may convey the impression of a fake review, or an internally motivated review (Dou et al. 2012).
Table 14.
Cronbach’s Alpha for A2
Reliability Statistics Cronbach's Alpha Cronbach's Alpha Based on Standardized Items N of Items 0,918 0,918 2
33
Thirdly, it was proven that the texts did not demonstrate a good level of expertise nor a good level of trustworthiness. One of the reasons for this to happen can be the differences in vocabulary used either by a blogger or an expert. Even though the respondents could only see one text (not knowing that there could be another option), the vocabulary used could set off a strange environment. According to the Oxford Dictionary (2017), an expert is “a person who is very knowledgeable about or skilful in a particular area”, while a blogger is “a person who regularly writes material for a blog”. The vocabulary used by each differs, in the sense that an expert chooses a more rational and logic way of explaining, presenting himself as an authority, stressing credibility, relatability and networking (Biery 2016), while a blogger tries to opt for a more hedonistic approach, keeping the reader interested and entertained, and keeping the tone of voice in line with the brand identity of the blog (Uzunoğlu 2014).
Other Relevant Results
Income and Age
Despite not being a relevant value for this specific research, it is one worth mentioning, since it goes in the same lines as previous literature on the subject.
Even though there are papers arguing that income peaks and then declines, making an inverted U shape over time (Thornton et al. 1997) for the purposes of this research what was found was that the older the person was, the higher the income. This was due to one of the limitations of the survey, which was the fact that most participants were either young adults (18-24) or adults (45-54), who are believed to have steadier jobs and higher income. This research proposes that at 54 years old, the peak of income happens and then it starts to decline. Thus, this result is supported by previous research. On Table 15, it is possible to verify that the p-value shows a statistically significant relationship between income and age.
34 Table 15.
Linear Regression (Income and Age)
Model Summary Model R R Square Adjusted R Square Std. Error of the Estimate Change Statistics R Square Change F Change df1 df2 Sig. F Change 1 ,691a 0,478 0,477 1,441 0,478 394,475 1 431 0,000
a. Predictors: (Constant), Idades
Income and Savings
With a p-value=0.000, this result is reflected on how older people tend to have more savings than younger people. As explained in the analysis above, the sample used for this study was composed mainly (52.7%) of young adults (18-24 years old) and next from adults with ages comprised between 45-54 years old. Table 16 demonstrates the result of a positive relationship between income and savings.
Table 16.
Linear Regression (Income and Savings)
Model Summaryb Model R R Square Adjusted R Square Std. Error of the Estimate
Change Statistics Durbin-Watson R Square Change F Change df1 df2 Sig. F Change 1 ,337a 0,113 0,111 1,180 0,113 55,094 1 431 0,000 1,861
a. Predictors: (Constant), Idades b. Dependent Variable: Poupanças
Previous research (Demery and Duck, 2005) suggests that at around 50 years old, the level of savings is at its maximum, and from then on it starts decreasing, again replicating an inverted U shape. Only 15.2% of the participants are over 56 years old, which can bias the analysis and provide a conclusion that does not completely reflect the reality. Considering that 84.4% of the sample population is between 18 and 54 years old, the trend of higher savings seems to be present.
35
Higher and Lower Status Reviews
Even though this analysis was not considered to be significant (p-value=0.897), it was an interesting result to include in this section.
Initially, it was hypothesized that more conservative-leaning consumers would react better to high-status reviews (written by the expert) and more liberal-leaning consumers would react better to low-status reviews (written by the blogger), based on the work developed by Ordabayeva and Fernandes (2018). For each reader, one text would randomly be chosen as the review of the product.
In fact, that was not verified. Status does not appear to have a relevant impact on the readers’ willingness to pay. Some of the conservative-leaning respondents appeared to be more positively influenced by reviews, regardless of its status, than liberal-leaning respondents.
On Table 17 the main results of this linear regression are represented. Table 17.
Linear Regression (Status, Political Ideology, Interaction and Willingness to Pay)
Model Summaryb
Model R R Square Adjusted R Square Std. Error of the Estimate Change Statistics R Square Change F Change df1 df2 Sig. F Change 1 ,042a 0,002 -0,007 62790,461 0,002 0,199 3 343 0,897
a. Predictors: (Constant), Interação, Status_Total, Mean_Centered_PI b. Dependent Variable: Avaliações
Conclusion
After concluding this study, it was possible to extract a few conclusions on the relationship between political ideology and perception of luxury products. On the one hand, it suggests that both liberal-leaning and conservative-leaning consumers are willing to pay, on average, the same when are not given any information on the product. On the
36
other hand, after reading about the product and gain insight on it, some of the conservative-leaning consumers show a higher willingness to pay.
More conservative consumers, in this fashion, are more likely to value luxury products when they understand them, regardless of who is the source of that information.
The main conclusion taken from the study was that more conservative consumers are more likely to need information to increase their willingness to pay, either that be from a blogger or an expert, while more liberal consumers trust their intuition and stick to it during the decision making process. This can be related to the fact that conservatives are more likely to follow the social norms and conform to the stipulated rules (Fernandes and Mandel 2014, Altemeyer, 1998) and even can be linked to the higher respect for authority (Fraley 2012, Graham et al. 2009). They may want to pay what is ‘fair’ for the price for the product, even if they don’t really find it aesthetically beautiful (qualitative values), but recognize the inherent value of the product.
Under a marketing standpoint, a useful application of these findings is, after understanding which types of consumers buy on the luxury brand, adapting the communication strategy. For instance, if most of the consumers are conservative leaning, then they will most likely value Authority and Ingroup loyalty (Graham et al. 2009). Thus, if the company sends an e-mail with a review by either an expert or a blogger, or even promotes events spreading the opinion of the opinion leader, that review can have a positive impact on the brand perception of consumers and, as such, increase the level of sales.
Limitations
The sample used for all the analyses did not fully represent the Portuguese population. First of all, because there were only 430 responses. Then, more than half of respondents were between 18-24 years old. From this group, a big percentage of respondents were students from Católica-Lisbon SBE. The great majority of the respondents were from either Lisboa or Porto, again biasing the results, because the psychographics of these two cities differ greatly in comparison with the other cities in Portugal (for instance, a distinctive feature that separates these two cities can be that Lisboa and Porto represent the cities where most university students graduate- Annex 2. Pordata). The sample was, overall, badly distributed.
37
As thoroughly mentioned throughout this dissertation, the definition of luxury is ambiguous and so can be the results concluded from it. On the one hand, in order to include more participants, the definition had to be broadened. The images used in the survey can be discussed whether or not they belonged there (particularly the Chloé bag). However, if instead was a photo of a private jet or an haute-couture dress, the respondents could not even think about a fair willingness to pay because they would lack benchmarks. On the other hand, the definition had to be assumed, in order for the participant to understand clearly what was being discussed. Balancing these two forces can be a source of biased results as well.
In terms of the analysis of the first hypothesis, the variation of willingness to pay represents the variation among all four products. This constitutes a limitation because an increase of 50% willingness to pay in the car is not the same as an increase of 50% willingness to pay on the bag, for instance. However, because the sample was poorly distributed, the results from each individual analysis were very inconsistent, due to few responses on each.
Future Research
After concluding this study, a few conclusions were drawn that can be interesting to study in the future. First of all, it can be interesting to understand how different luxury products are perceived by different consumers, politically speaking. For example, here in this dissertation, the watch and the car had very similar results (reviews boosted the willingness to pay on some conservative-leaning consumers), but this effect was not verified with the bag. This discrepancy can be due to statistical problems, but it can also open a door for a more thorough investigation on the different luxury products and how they are perceived. Maybe a form of product differentiation can be studied performing the same study but with more similar product bundles.
Another variable that can contribute to this discrepancy can be the amount of information gathered before the purchase. If consumers spent more time gathering information on the products to buy, they may be more sensitive to comments of opinion leaders on the field. Indeed, whilst in this survey a bag and a car were both deemed luxury products, it is fair to assert that they represent different types of luxury products, namely in what concerns their accessibility.
38
Appendices
Appendix 1. Survey
Muito obrigada pela sua participação neste inquérito. Os resultados deste estudo serão fundamentais para a tese de mestrado que estou a a realizar na Católica Lisbon SBE.
Agradeço a vossa sinceridade nas respostas, uma vez que não há respostas certas nem erradas. As mesmas serão estritamente confidenciais e utilizadas apenas como objeto de estudo.
Muito obrigada pelo vosso contributo. Maria do Mar Belchior
Q1 Género
o
Masculino (1)o
Feminino (2)o
Prefiro não responder (3) Q2 Por favor indique a sua idade________________________________________________________________
Q3 Por favor selecione a opção que mais se aproxima do seu rendimento mensal líquido(€)
o
0-500 (1)o
501-800 (2)o
801-1.000 (3)o
1.001-1.500 (4)o
1.501-2.000 (5)o
2.001-3.000 (6)o
3001-5000 (7)o
5001-8.000 (8)o
>8.001 (9)39 Q4 Por favor selecione a opção que mais se aproxima de todas as suas poupanças (inclui
investimentos, acções, certificados de aforro, etc.)
o
0-2.000 (1)o
2.001-10.000 (2)o
10.000-50.000 (3)o
50.001-100.000 (4)o
100.001-200.000 (5)o
>200.001 (6)Q5 Nível de Escolaridade (último nível concluído)
o
Ensino Básico (1)o
Ensino Secundário (2)o
Licenciatura (3)o
Mestrado (4)40 Q36 Por favor classifique cada tópico de acordo com as suas preferências pessoais
Concordo Totalmente (1) Concordo Parcialmente (2) Não concordo nem discordo (3) Discordo Parcialmente (4) Discordo Totalmente (5) Não deve existir a pena de morte (1)
o
o
o
o
o
Sou a favor da liberalização do aborto (2)o
o
o
o
o
O controlo das armas deve ser apertado (3)o
o
o
o
o
Apoio um sistema de saúde pública acessível a todos (4)o
o
o
o
o
Casamento entre casais homossexuais (5)o
o
o
o
o
Imigração Ilegal (6)o
o
o
o
o
Q39 Por favor, localize a sua orientação política na escala abaixo
1 (1) 2 (2) 3 (3) 4 (4) 5 (5) 6 (6) 7 (7) 8 (8) 9 (9) Orientação
Política
(1)
o
o
o
o
o
o
o
o
o
Q7 Já alguma vez adquiriu um produto de luxo?
Nota: Para este efeito, um produto de luxo categoriza-se desde luxo acessível (perfumes, cosmética, óculos de sol) a luxo aspiracional (acessórios, malas, sapatos de designer, experiências em restaurantes de luxo) até luxo absoluto (jóias, carros).
o
Sim (1)41 Display This Question:
If Já alguma vez adquiriu um produto de luxo? Nota: Para este efeito, um produto de luxo categoriza-... = Sim
Q8 O(s) produto(s) que adquiriu foram para quem?
o
Para si (1)o
Para outros (2)o
Ambos (3) Display This Question:If Já alguma vez adquiriu um produto de luxo? Nota: Para este efeito, um produto de luxo categoriza-... = Não
Q9 Porquê?
o
Porque não me identifico com produtos de luxo (1)o
Porque não tenho possibilidades (2)o
Prefiro optar por produtos contrafeitos (3)o
Outra razão (4) ________________________________________________ Display This Question:If O(s) produto(s) que adquiriu foram para quem? = Para outros Q10 Neste caso, qual a sua opinião sobre produtos de luxo?
o
Consigo ver valor naquilo que ofereço (1)o
Não valorizo de todo aquilo que ofereço (2)o
Depende dos produtos (3)42 Q11 Por favor, olhe atentamente para as imagens abaixo. Selecione o produto da imagem com que mais se identifica.
o
Image:Chloé (12)o
Image:Patek Philippe (13)o
Image:Cartier necklace (14)o
Image:Aston Martin (15) Display This Question:If Por favor, olhe atentamente para as imagens abaixo. Selecione o produto da imagem com que mais se... = Image:Chloé
Q12 Por favor, indique quanto está disposto(a) a pagar por esta mala
________________________________________________________________
Display This Question:
If Por favor, olhe atentamente para as imagens abaixo. Selecione o produto da imagem com que mais se... = Image:Patek philippe
Q13 Por favor, indique quanto está disposto(a) a pagar por este relógio
________________________________________________________________
Display This Question:
If Por favor, olhe atentamente para as imagens abaixo. Selecione o produto da imagem com que mais se... = Image:Cartier necklace
Q14 Por favor, indique quanto está disposto(a) a pagar por este colar
43 Display This Question:
If Por favor, olhe atentamente para as imagens abaixo. Selecione o produto da imagem com que mais se... = Image:Aston martin
Q15 Por favor, indique quanto está disposto(a) a pagar por este carro
________________________________________________________________
Q37 Em que medida concorda com as seguintes afirmações? Concordo totalmente (1) Concordo parcialmente (2) Não concordo nem discordo (3) Discordo parcialmente (4) Discordo totalmente (5) Este produto é atrativo (1)