Determinants of capital structure: Portuguese wine sector
Nelson Gonçalves Carvalho
Internship report Master in Finance
Supervised by
Miguel Augusto Gomes Sousa
Determinants of capital structure: Portuguese wine sector
Nelson Gonçalves Carvalho
Internship report Master in Finance
Supervised by
Miguel Augusto Gomes Sousa
Acknowledgments
In this section I leave my enormous gratitude to all of those who have supported me in the making of not only this work, but also to all of those who still, to this day, have a meaningful impact in my life. I would like to present my gratitude to both my university supervisor Professor Dr. Miguel Sousa as well as my company supervisor Dr. Manuel Pinto, for their patience, vast knowledge as well for the time spent in helping me achieve the goals set in this work. My gratitude also goes to Mr. Pedro Manuel Silva Reis and all those of Real Companhia Velha, for giving me this opportunity, for making me feel welcome and allowing me to learn more about the wine sector from a financial standpoint. A particular thanks goes to Instituto dos Vinhos do Douro e Porto (IVDP) for providing information which made study a possibility.
Furthermore, I am extremely grateful to my family, particularly, my father António Carvalho and my mother Odete Gonçalves. They have given me all that son could ask for, and as such words are not enough to describe how grateful I am. As such, I will make sure to always to make you proud in whatever I set myself to do. Thank you. Finally, a special thanks to Alexandre, Bruno, Cláudio, Cláudia e Jorge for the best friendship any man could ask for, filled with joy and very knowledgeable advice.
Without any of you, none of this would have been possible, without your continuous and much-cherished support I probably would not have made it here.
Abstract
One of the most important components in a firm’s competitive advantage are the financing costs, often determined by the capital structure’s composition. Even though variables such as median industry leverage, market-to-book assets ratio, tangibility, profit, logarithm of assets and expected inflation, have been pointed out to be the most relevant in determining capital structure; in the case of Portuguese firms, and in the wine sector alike, the behavior of capital structure decision making is still very unknown. With the recent economic crisis, we may have a better understanding of the financial components that truly drive a firm’s capital structure balancing, as well as the impact of economic shocks on those variables. We aim to help reduce the literature gap on this subject, whilst providing firms in the sector a framework for devising optimal capital structure by minimizing financial costs. In order to shed some light into the subject, we performed an empirical analysis through the use of fixed effects regression according to various forms of leverage and variables for the period of 2010 to 2016 as well the use of both the financial deficit and leverage deficit approach. In our results, we find that the pecking-order theory best explains the behavior of the industry, because most of our sample consists of small and medium-sized companies. The variables that were significant in the capital structure of companies were size, profitability, fixed assets, inventories, and risk. Also, the cash variable proved to be significant exclusively in the Port wine segment, while the years 2015 and 2016 show a significant reduction in debt at various levels compared to the rest of the period. Real
Companhia Velha seems to present debt ratios similar to what we obtained in our analysis for the year of 2016 in the Port wine segment, and as such we consider the firm to be an overall healthy financial state.
Keywords: Capital structure, Wines, Portugal, Economic crisis,
SMEs
JEL-Codes: C12, C23, G32, N54
Resumo
Um dos componentes mais importantes no desenvolvimento de vantagem competitiva por parte das empresas são os custos de financiamento, geralmente determinados pela estrutura de capital. Apesar de variáveis como: alavancagem média da indústria, rácio entre o valor de mercado e ativos, tangibilidade, lucro, logaritmo dos ativos e inflação esperada, terem sido apontadas como as mais relevantes na determinação da estrutura de capital; no caso das empresas portuguesas, e no setor vitivinícola, o comportamento da tomada de decisão na estrutura de capital ainda é muito desconhecido. Com a recente crise económica, podemos ter uma melhor compreensão dos componentes financeiros que realmente proporcionam o equilíbrio da estrutura de capital da empresa, bem como o impacto dos choques económicos sobre essas variáveis. O nosso objetivo é ajudar a reduzir a lacuna de literatura sobre este assunto, assim como fornecer às empresas do setor ferramentas para a criação de uma estrutura de capital ótima, minimizando os custos financeiros. De modo a proporcionar alguma luz sobre o assunto, realizamos uma análise empírica através do uso de regressão de
efeitos fixos de acordo com várias formas de alavancagem e variáveis para o período de 2010 a 2016, bem como o uso da abordagem do défice financeiro e da abordagem de défice de alavancagem. Nos nossos resultados, encontramos que a teoria pecking-order é a que melhor explica o comportamento da indústria, devido à maior parte de nossa amostra ser composta por pequenas e médias empresas. As variáveis que se apresentaram como significativas na estrutura de capital das empresas foram o tamanho, lucros, ativos fixos, inventários e risco. Também, a variável liquidez provou-se significativa exclusivamente no segmento do Vinho do Porto, enquanto os anos de 2015 e 2016 demonstram significância para redução da dívida aos diversos tipos comparativamente com o resto do período. A Real Companhia Velha parece apresentar rácios de endividamento semelhantes ao que obtivemos na nossa análise para o ano de 2016 no segmento do vinho do Porto e, como tal, consideramos que a empresa encontra-se com níveis adequados de financiamento.
Palavras-chave: Estrutura de capital, Vinhos, Portugal, Crise
económica, PME’s Códigos JEL: C12, C23, G32, N54
Table of Content
Acknowledgments...1 Abstract...2 Resumo...3 List of Tables...5List of Equations...7
1. Introduction...1
2. Literature Review...3
2.1. Capital structure theories...3
2.1.1. Traditional Approach...3
2.1.2. Modigliani and Miler Theories...3
2.1.3. Static trade-off theory...4
2.1.4. Pecking-order Theory...5
2.1.5. Dynamic trade-off theory...6
2.1.6. Market timing theory...6
2.2. Empirical determinants of capital structure...7
2.2.1. Size...7 2.2.2. Age...8 2.2.3. Growth...8 2.2.4. Profitability...9 2.2.5. Risk...10 2.2.6. Asset structure...10
2.2.7. Non-debt tax shields...11
2.2.8. Uniqueness...12
2.2.9. Industry Effect...13
2.2.10. Share price performance...13
2.2.11. Economic Shocks...14
2.3. Portuguese Wine sector...15
3. The Internship...16 4. Methodology...19 4.1. Sample...19 4.2. Size distribution...20 4.3. Model Specification...21 4.4. Dependent variables...22 4.5. Independent variables...23 4.6. Summary Statistics...26 4.7. Univariate Analysis...29 5. Results...34
5.1. Hausman test...34
5.2. Chow test...34
5.3. Yearly fixed effects regression...37
5.4. Financial Deficit...40
5.5. Leverage Deficit...42
6. Conclusions...48
7. References...50
8. Appendix...62
8.1. Appendix A – Variable definition with respective referenced study...62
8.2. Appendix B – Correlation between variables...63
8.3. Appendix C – Tests...65
8.4. Appendix D – Regressions...66
8.5. Appendix E – Leverage deficit approach 2015...80
List of Tables
Table 1 - Peer's ratios...17Table 4 – Means, Medians and Differences test for each
production segment...31
Table 5 - Means and Medias for firm’s legal forms...34
Table 6 - Portuguese wine sector capital structure regression ...37
Table 7 - Financial deficit regression...41
Table 8 - Positive Financial deficit regression...41
Table 9 - Leverage deficit 2016...43
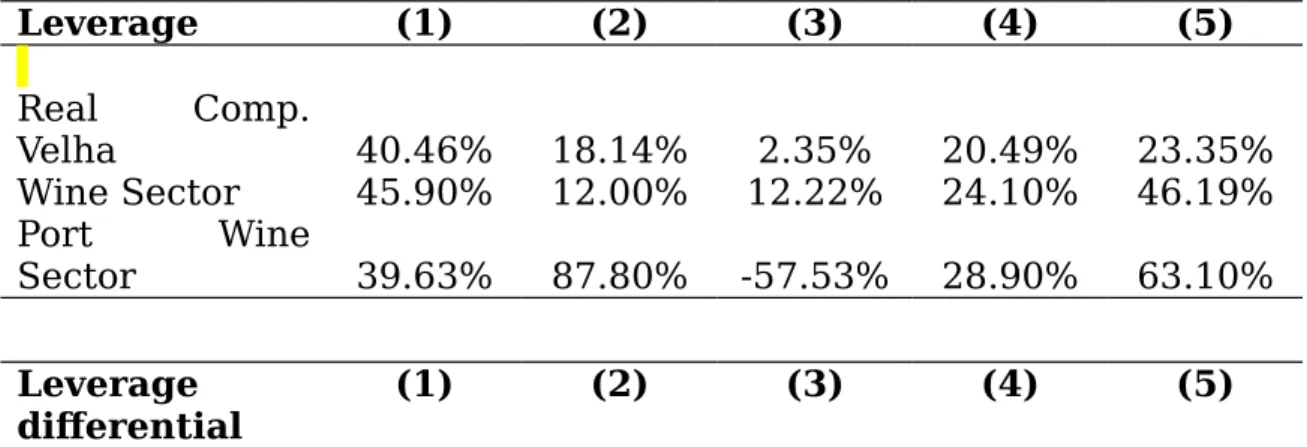
Table 10 - Portuguese wine sector capital structure regression - Port wine...45
Table 11 - Variable references...58
Table 12 – Correlation of dependent variables present in Portuguese wine capital structure regression...59
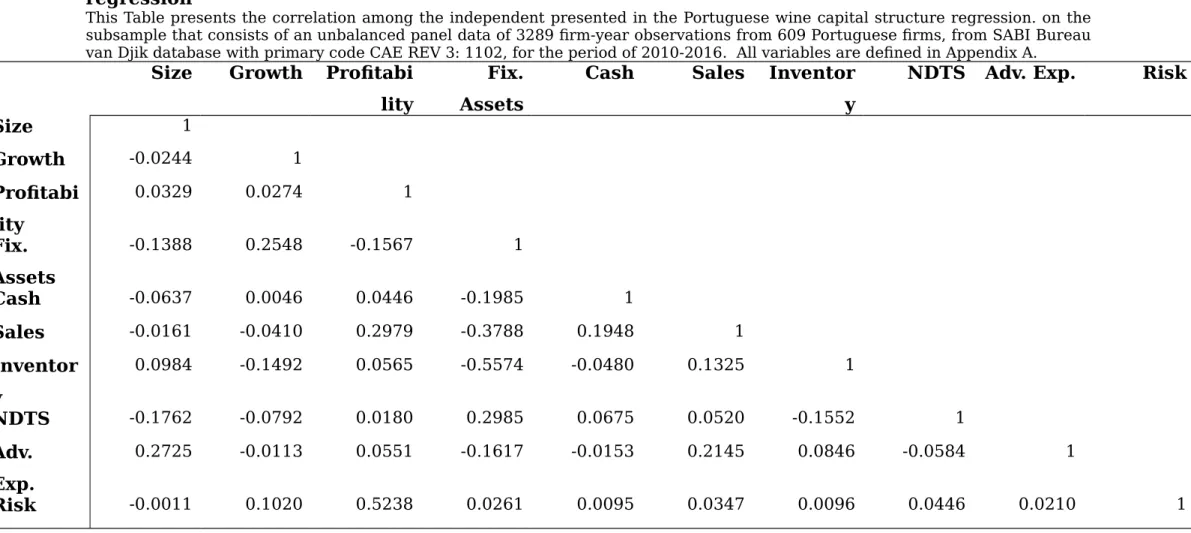
Table 13 – Correlation of independent variables present Portuguese wine capital structure regression...60
Table 14 - Hausman test results...61
Table 15 - Chow test results...62
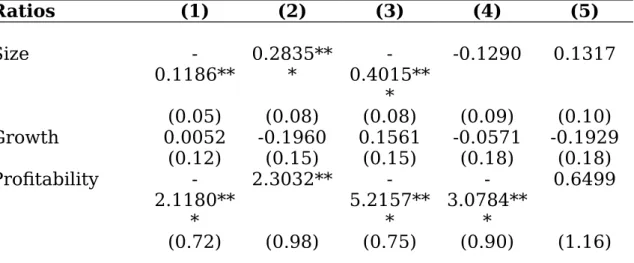
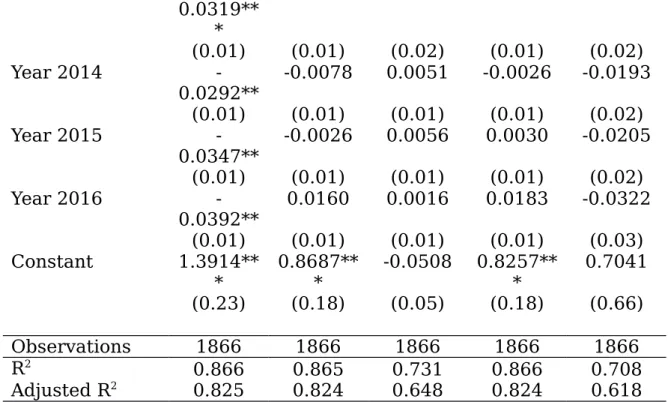
Table 16 - Portuguese wine sector capital structure regression – year fixed effects...63
Table 17 - Portuguese wine sector capital structure – Table wine – year fixed effects...65
Table 18 - Portuguese wine sector capital structure regression - Port wine – year fixed effects...67
Table 19 - Portuguese wine sector capital structure regression – Anonymous Societies – year fixed effects...69
Table 20 - Portuguese wine sector capital structure regression - Quota Societies – year fixed effects...71
Table 21 - Portuguese wine sector capital structure regression – Unipersonal Quota Societies – year fixed effects...73
Table 22 - Financial deficit – year fixed effects...75
Table 23 - Positive Financial deficit - year fixed effects...75
Equation (4.1)...21 Equation (4.2)...22 Equation (4.3)...22 Equation (4.4)...22 Equation (4.5)...23 Equation (5.6)...35 Equation (5.7)...40 Equation (5.8)...40
1. Introduction
The type of financing incurred by firms has always been presented as a fundamental component on the competitive advantage of the firm, especially when competing in international markets. The cost of financing expenditures can determine the stability and longevity of the firm if we consider that potential investments need to at least provide a level of return superior to the costs at which the firms finances itself in order to be accepted by the firm. As such the level of financing costs could end up determining the investment profile of the firm as well as its adaptability to market conditions.
Following the most recent economic crisis, it only seems natural to analyze how firms change their capital structure as a way to increase corporate efficiency and competitive advantage by the means of reducing financial costs. Nonetheless, this component is affected by various aspects of the firm, one of which is the industry in which it operates. As an internship report performed alongside Real Companhia Velha, I have chosen to perform a study on the Portuguese wine sector. This proves itself a very pertinent subject since there is only one paper by Viviani (2008), which develops the subject for the case of French wine companies. Portugal is one of the largest producers of wine in the world, it only seems fitting to understand what the particularities of its firms are when it comes to capital structure. We must also mention, that Portuguese firms are almost exclusively comprised of small and medium size (SMEs), accounting for 99.7% of all non-financial firms, providing 74.1% of employment and 59.3% of value added of the entire country (INE 2015). Additionally, if we consider that the Portuguese stock market is relatively undeveloped, and, as such the Portuguese firms rely almost exclusively on banks to raise external finance (Oliveira and Fortunato, 2006), we perceived a gap in literature review in the
implications of a financial crisis on SMEs’ capital structure in bank-oriented economies.
With this in mind, we aim to understand: if there is some specificity to the capital structure in the wine industry; which capital structure theory is applicable and what are the main effects of the economic crisis on this industry’s capital structure.
We will reach the answers to the research questions resorting to a fixed effects regression in which leverage is dependent on various variables commonly used in the study of capital structure, as well as the financial deficit and leverage deficit approaches to further cement the results obtained.
Alongside this first section, the report is comprised of seven sections. Section 2 is a topic on the literature review on the theories of capital structure as well as its empirical determinants and how it all ties together with the Portuguese wine firm scenario. Section 3 is comprised of an explanation of both the sample and methodology. Section 4 will be comprised of empirical analysis and results, including regression analysis, the financial deficit and leverage deficit approaches, respectively. Finally, section 5 will present the overall conclusions and further research that could be made in order to improve the gathered results.
2. Literature Review
2.1.
Capital structure theories
In this section we will briefly mention the various theories of capital structure so that we may better explain the empirical results presented later on, as well as derive to some conclusions regarding which variables present a higher impact in the Portuguese wine firms’ capital structure. We also briefly mention Port wine restrictions to production and selling, which end up creating a different production and financial dynamic in the firms, to the point that a subsector of the wine industry with its own particularities is created.
2.1.1. Traditional Approach
This approach has the fundamental basis that firms have an inherent optimal capital structure that varies according to firm-specific characteristics, and that allows for the maximization of the firm’s value.
This theory, initially developed by Durand (1952), supports itself on the cost differences between external and internal financial according to different levels of debt. It takes the assumption that external financing is less costly than internal financing (equity) for
until the benefits of doing so would be null, reaching the optimal capital structure. This argument gains traction when we consider that as the levels of external financing are increased, so are the costs of internal financial due to a higher risk perception of the firm, as such the firm would stabilize its weighted average cost of capital in a point at which is considered to be minimized.
As the main implications of this theory, we would view an increase in debt by the firms until its weighted cost would be equal to that of equity, nullifying the marginal gains of incurring debt.
2.1.2. Modigliani and Miler Theories
This theory, presented in the 1958 seminal paper by Modigliani and Miler, is one of the major contributors to the literature relating to capital structure, mostly due to its interesting results, yet far from finished, especially considering the assumptions that it bases itself upon.
The model presented in this paper comes to the conclusion that it is impossible to connect the financing decisions made by the firm with the value that the firm holds. This occurs due to the fact that the cost of capital is independent from the levels of debt that the firm incurs, the author adds that the same happens with the investments since their valuation is indifferent from the type of financing used to generate them.
These conclusions are supported by assumptions taken by the author in the creation of the model, such as no limits to debt incurred by the firm, the absence of taxes, agency costs, default risk, bankruptcy costs as well as information asymmetry. With the latter, the author concludes that a levered firm’s value is equal to the sum of an unlevered firm’s value with the same characteristics and a financial risk premium.
As a complementary framework, Miler (1963), devised the same model with the presence of taxation, as well as the most observed benefit from incurring debt, tax shields. The main conclusions of the
paper were that the behavior of firms would be to maximize tax shield by incurring the maximum debt, even though under certain circumstances personal taxation would nullify these gains.
This theorem of the irrelevance of capital structure has been contested by many authors, since it relies heavily on the perfect market assumptions stipulated, which, obviously are not present in the empirical framework. As such by relaxing the assumptions, and taking into account possible market imperfections such as transaction costs, informational asymmetries and agency costs, the existence of an optimal capital structure is now plausible, if not adapted to the level of imperfections observed at different markets or even points in time (Kraus and Litzenberger 1973, Scott 1976 and Kim 1978).
Pettit and Singer (1985) stated that this approach, which fundamentally relates to the use of tax shields, cannot be applied in small and medium firms which comprise the vast majority of firms. This is due to the fact that small and medium firms are more likely less profitable than larger firms and as such do not incur in as much debt, since their potential benefits from tax shields are, as a consequence, much lower. This is essential when comprehending our results since the vast majority of the Portuguese firm’s tissue is comprised of small and medium firms.
2.1.3. Static trade-off theory
The traditional (static) trade-off theory is then based on the benefits and costs of incurring debt, and as argued by (Myers 2001), firms would choose their optimal capital structure by setting the marginal costs equal to the marginal benefits of debt. As seen, the benefits are assumed by the variable tax shields while the costs can take two forms: the bankruptcy costs and agency costs (Jensen and Meckling 1976).
According to Jensen and Meckling (1976) and Jensen (1986), debt could be employed as a disciplinary form towards managers
behavior, since one of these theories main assumptions is that shareholder and manager interests differ due to their different incentives and different positions within the firm’s sphere. Stultz (1990) further added that while this is accurate, issuing debt, will instead increase the agency conflicts between shareholders and creditors, due to an inherent change in capital structure.
2.1.4. Pecking-order Theory
An opposing theory to the previously mentioned, the pecking order theory assumes that companies analyze the various financial sources that they have access to, and choose accordingly to their preferences. These preferences are often dependent on the degree of informational asymmetry, risk, self-financing capacity as well as well constraints imposed by the firm itself regarding each source of financing (Donaldson 1961, Myers and Majluf, 1984).
Firms would usually prefer internal forms of financing to external ones, which would lead managers to establish an order in which they would firstly value using accumulated cash and cash derived from the firm’s marketable securities, followed by debt, hybrid securities and finally stockholder’s equity. The dividend policy would then be closely linked to both growth opportunities and expected cash flows of each firm as well as past profitability. Of course, the behavior of dividend policy is often considered as sticky which can demerit some implications of the theory, however, we can perceive that the behavior of dividends would only alter if the managers perceive more upcoming valuable and long-lasting investment opportunities than in the past (Myers, 1984).
According to Ross (1977) information asymmetry plays a prominent role, not only in determining the capital structure but also as a form of market signaling of future expected growth opportunities. Since, for example, markets would consider the increase of debt connected with the expectancy of higher future cash-flows by the firm, and so a positive impact on the perception of the firm’s quality.
Although this theory would imply that there is not an optimal capital structure and that it is but a vessel for the current needs of the firm (Holmes e Kent 1991), the appearance of other studies suggests that there are other factors besides information asymmetry that influence the capital structure such as tax, agency (Frank and Goyal 2008) or even behavioral considerations (Heaton 2002).
2.1.5. Dynamic trade-off theory
Mentioned by Fischer et al. (1989) and Leland (1994, 1998), this theory is a form of compromise between the static trade-off theory and the pecking-order theory.
The dynamic trade-off theory assumes that firms and managers alike determine a long-term optimal capital structure based on the static trade-off theory and firm-specific determinants. Whilst, in the short-run, firms would deviate from its optimal capital structure by taking into account corporate taxes, transaction costs, informational asymmetries, and adjustment costs, as well as the preference for liquidity in financing as they would in the pecking-order theory. When the deviation proves itself costly or meaningful, managers take action adjusting it towards long-term values.
The observed behavior would lead to a convergence towards an optimal capital structure over long periods of time, leading to the existence of the pecking-order theory in the short run and trade-off theory in the long run.
Fischer et al. (1989) identified that smaller, riskier and lower-tax and lower bankruptcy cost firms would demonstrate the widest variations in their debt ratios over time, implying that these firms may have a higher difficulty in determining their long-term optimal debt ratios. This is probably due to the fact that these are more sensitive to macroeconomic conditions as a whole as well as being less capable of issuing debt with high maturities, and so, are more prone to fluctuations in leverage.
2.1.6. Market timing theory
Unlike the dynamic theory, this theory takes into account solely market values into its stipulation, considering that managers would only finance themselves through equity when they observe high market-to-book ratios, meaning, they only issue stocks when they are above their true value. As such they would issue shares that, according to their historical values, are considered to be overpriced, maximizing the financial cash-flow to the firm. This would imply that after a period of high market-to-book ratios, a small debt ratio is forthcoming. As expected managers would instead increase its leverage if the market conditions of debt would outperform those of equity, yet if none are within the minimum standards of the firm, managers could opt by delaying financial issuances. Likewise, if market conditions are very favorable, they might resort to issuances even if the firm does not immediately require funds or has no use for liquidity.
This theory while being well known since 1984 (Myers), its popularity has increased to various studies who have given some validity to theory, particularly in manager surveys such as Graham and Harvey (2001). This is proven also by some empirical studies regarding share returns such as Loughan and Ritter (1995), Jegadeesh (2000) and (Baker and Wurgler, 2002), in which equity issuance is followed by lower abnormal returns.
In our work, we will be using exclusively accounting data which will prevent taking any assessment on theories related to market values such as the latter.
2.2.
Empirical determinants of capital structure
Since the publication of the various theories on capital structure there has been an increasing amount of empirical research performed in order to comprehend which theories, and more importantly, which aspects of each theory is applied in the real
corporate and financial environments. These studies, through either qualitative or quantitative methodology, did not create a consensus amongst the scientific community, yet they have determined what the most significant variables when analyzing capital structure are. These variables are size, age, growth, profitability, risk, asset structure and non-debt tax shields. Some less commonly used variables such as legal structures, industry effects, and expected inflation have also presented interesting results, yet the numbers of studies that focus on these variables are still scarce and as such we will only briefly mention their results.
2.2.1. Size
This aspect of firms can be determinant when making financial decisions, particularly if we consider that smaller firms have very different needs and concerns when comparing to large firms, which will create different capital structures in between these groups. Large firms in their turn, present various advantages when contracting debt, this is mainly due to a generally lower degree of informational asymmetry with current and potential stakeholders of the firms (Chung, 1993, Grinblatt and Titman 1998). As such large firms tend to present higher debt ratios when comparing to smaller firms (Fama and French, 2007), since the latter suffer from adverse selection by financial institutions (Berger and Udell, 1998) and often resort to short-term debt (Titman and Wessels 1988, Chittenden et al. 1996) and commercial debt (Petersen and Rajan 1997) as alternative forms of financing.
There is also some evidence provided by Ang et al. (1982) and Warner (1997) and in which the bankruptcy costs would decrease as the value of the firms would increase, this in turn should result in higher leverage ratios specially if we consider that larger firms are often more diversified (Titman and Wessels 1988, Pettit and Singer 1985, Ang 1992) and have access to more favorable interest rates (Ferri and Jones 1979) and as such a lower probability of bankruptcy
(Cole 2013). Chung (1993) also argued that agency costs on larger firms are lower for the components of asset substitution and underinvestment issues.
The evidence suggests that smaller firms are more likely to be liquidated upon entering financial distress (Ozkan 1996), this drives smaller firms to reduce exposure to bankruptcy costs by resorting to more equity, and so provide lower leverage ratios. (Rajan and Zingales 1995).
2.2.2. Age
While the importance of age when analyzing capital structure is a given, the theoretical research on the impact of age on capital structure is still ambiguous. Older firms usually have debt contracts with higher duration which leads to a closer relation in between the banking system and the firms themselves allowing for low informational asymmetry (Petersen and Rajan 1994), as well as the fact that older firms are assumed to be more credible, profitable and diversified than its younger counterparts (Cole 2013) and as such should present higher debt ratios. Yet, if we consider the pecking-order theory, older firms should present higher accumulated earnings than younger firms which would allow for a more internally oriented financing policy (Petersen and Rajan 1994). As to empirical research, the results seem to be in accord with the pecking order theory (Petersen and Rajan 1994, Michaelas et al. 1999).
2.2.3. Growth
According to the trade-off theory growth opportunities should be inversely related with the use of debt, an in the case of bankruptcy the value given to the growth opportunities would be insignificant, this occurs due to the fact of growth opportunities being closely related to the value of the intangible assets (Myers 1984, Williamson 1988, Harris and Raviv 1990), and in the case of bankruptcy their value would decrease. It is also argued that when undertaking risky debt, firms may pass up some investment opportunities, which is
expected considering that the firms new risk profile requires different investment opportunities.
Titman and Wessels (1988) also draw a parallelism between agency costs and growing industry, stating that firms who are present in these industries would present higher agency costs, this is due to their availability in undertaking newer future investments, some of which are not initially expected. This behavior is relevant if we consider that equity-controlled firms often invest sub-optimally in order to expropriate wealth from the firm’s bondholders. Nonetheless, Myers (1984), Easterwood and Kadapakkan (1994) argued that firms who suffer from these agency costs intently should substitute long-term debt for short-term debt. This way firm’s bondholders would not be as exposed to wealth expropriation which would lead to optimal investment policy for the firm and overall lower agency costs. Jensen and Meckling (1976), Smith and Warner (1979) and Green (1984), argue that the same effect could be achieved by the issuance of convertible bonds. This would imply that there might be a positive relationship between growth and leverage ratios.
Mature firms present lower growth opportunities, as such in order to increase the potential value of the firm debt should be employed as a disciplinary mechanism (Jensen 1986, Stulz 1990).
From the pecking-order theory, we can derive that growing firms would not only require more investment, they would prefer financing sources that are less subject to informational asymmetry costs, such as internal financing and short-term debt. Firms with higher growth would present higher leverage.
2.2.4. Profitability
This variable, akin to age, presents ambiguous results when considering the tradeoff theory and the pecking-order theory. Regarding the first, profitable firms present a lower chance of bankruptcy and as such lowers bankruptcy costs, which gives them
more leeway to employ debt in the capital structure and reap the benefits of interest tax shields more often (Fama and French 2002, Jensen 1986). In the pecking-order theory, as stated by Myers (1984) and Myers and Majulf (1984), profitability would imply higher retained earnings, and as firms perceive these as the most preferable source of financing, it would present an inverse relation to the leverage ratios.
More recent studies such as Frank and Goyal (2003), stated that the capital structure core empirical determinants are shifting their explaining power due to change in investors dispositions, stating that in the period between 1980’s and 1990’s, equity markets became more susceptible to funding low profitability firms with high growth prospects. This would imply a higher explanatory power of variables such as growth and inherently asset structure since high growth opportunity firms present higher values in intangible assets.
2.2.5. Risk
From the trade-off theory, we can easily comprehend that firm with higher variability of cash-flows would present higher bankruptcy cost, and as such would present lower levels of debt (Bradley et al. 1984, Kester 1986, Titman and Wessels 1988, Serrasqueiro and Caetano 2015) in an effort to decrease the volatility of their income. The same negative relation between risk and leverage is seen in the pecking-order theory since firms with volatile incomes would value retaining earnings in positive years since they would have the expectancy of negative ones in the near future, as such avoiding debt issues (Myers 1984, Low and Chen 2004).
The importance of earnings volatility in relation to the firm’s leverage can be summarized in this quote from Michaelas et. al. 1999:
“The variability of the firm’s future income is the chief factor in ex ante estimates of its ability to meet fixed charges.”
In terms of empirical evidence, in the case of SMEs it has suggested a positive rather than negative relation in between operational risk and leverage (Jordan et al. 1998, Michaelas et al., 1999). The concept that risk is negatively related to leverage is solely dependent on the costs of financial distress (Bradley et al. 1984), and as Ang et al. (1980) assessed, the direct bankruptcy costs of 88 firms that filled bankruptcy between 1964 and 1978 averaged only 5% of the liquidation value. This indicates that bankruptcy costs in smaller are relatively smaller than in the larger firms.
2.2.6. Asset structure
This variable analyses the tangibility of assets and its impact on the issuance of debt by firms. Firms with more tangible assets are perceived to have a higher liquidation value in the case of bankruptcy, this is known by managers and as such by putting these assets as collateral, firms have a higher bargaining power when issuing debt (Myers 1977, Scott 1977, Harris and Raviv 1991, Storey 1994, Berger and Udell 1998), reducing adverse selection and moral hazard costs (Long and Malitz 1992).
While Hutchinson and Hunter (1995) come to the conclusion that tangible assets can have a negative impact on debt since the increase of operating leverage in firms with a higher tangibility of assets is associated with an increase in risk.
In terms of intangible assets, it is expected that firms with less tangible assets have lower leverage but it’s worth mentioning that in case of firms that hold a good reputation, this portion of the intangible assets is considered to be close to tangible from the point of view of creditors (Balakrishnan and Fox 1993).
Grossman and Hart (1982) argue that in the case of presence of agency costs, firms with less collateral could employ more debt into their capital structure due to its disciplinary role towards manager behavior, particularly the excessive consumption of prerequisites. This is due to the fact that bondholders present higher incentives to
closely monitor the behavior of the firm. Firms who have fewer collateral assets are expected to have a higher consumption of prerequisites, especially if we consider that it is probably more difficult to monitor the capital outlay of the firms. With this agency theory related argument, we could expect a negative relation between collateral assets and leverage, especially in firms with high agency costs.
Regarding liquidity ratios, the two main theories disagree on their impact on leverage. The trade-off theory states that firms with a higher liquidity, are more capable of meeting its short-term obligations and as such would have a higher debt capacity, leading to a positive relation with liquidity.
The pecking-order takes the opposite position since firms with higher liquidity would use it as a substitute for the issuance of debt, and as such, should present lower leverage levels (Ozkan 2001, Pastor and Gama 2013).
Furthermore, Prowse (1991) argues that the liquidity of the company’s assets could indicate the extent to which the firm’s assets could be manipulated by shareholders at the cost of the firm’s bondholders.
2.2.7. Non-debt tax shields
Non-debt tax shields might be created by some investments even though these are not related to the way these projects were financed. We can argue that firms perceive this as also essential in determining the viability of the projects and might function similarly as debt tax shields would. This implies that non-debt tax shields are substitutes to tax shields, and so it is expected a negative relation between these with the firms' leverage ratios. A model following that concept is present in DeAngelo and Masulis (1980) in which these could be further developed to also act as substitutes to default costs. Notwithstanding, some empirical studies found no significant relationship between the firm’s debt levels and overall non-debt tax
shields and other tax benefits (Chkir and Cosset 2001, Singh et al. 2003, Serrasqueiro and Nunes 2011).
2.2.8. Uniqueness
The notorious empirical work of Titman and Wessels (1988) tested the idea of a firm’s uniqueness as a meaningful component in determining the capital structure, by referring to the previous work of Titman (1984). The argument was based on the link between the liquidation decision and the bankruptcy status that the firm holds. This was particularly relevant since the degree to which the firms could impose the bankruptcy costs to clients, workers, and suppliers of the firm should be impactful on the financing decision. If the firm and its counterparts were heavily dependent on the production of relatively unique or specialized products, then their costs of bankruptcy should be higher. This comes to the fact, which if the specialized firms chose to liquidate, then workers, customers and suppliers alike, may find it harder to substitute the role of those firms in their operations. As such the theoretical framework, which then was empirically proven by Titman and Wessels (1988), stated that the uniqueness of firms should be negatively related with leverage ratios.
A further study on the subject by Maksimovic and Titman (1991) reaches the conclusions that firms might ponder not producing higher quality products at the cost of leverage since the latter might negatively influence the incentives to do so. Highly leveraged firms are expected to have lower quality products as a result. Other studies such as Williamson (1988) and, in the case of Portuguese firms, Matias (2015), validate this theory since in the case of liquidation it would be harder for the specialized firm’s inventories and equipment to find a secondary market (Kim et al. 2006). In our study, we will use advertisement expenses as the main measure of uniqueness taken from Titman and Wessels (1988) since we consider that branding in the Portuguese wine sector is very important, whilst
research and development expenses are not as significant in the industry. The quit rates prove themselves useful if analyzing various industrial sectors, but not in the case of one specific industry.
2.2.9. Industry Effect
The idea that industry and its particularities affect the capital structure of firms, leads to the conclusion that debt ratios between industries are tied with the types of assets or even operations performed in each industry (Myers 1984). This effect has been captured empirically, since firms that belong in the same industry present similar debt ratios and tend to keep these debt ratios over time (Harris and Raviv 1991). There is also a point to be made for how specialized the production of firms is since in the case of the firms that manufacture machines and equipment, these are expected to present higher bankruptcy costs and as such incur into lower leverage levels, as argued by Titman (1984).
There is, however, some divergence on how impactful and meaning is this effect is since it is stated that firm-specific characteristics such as risk and respective implications are much more determinant in capital restructuring (Balakrishnan and Fox 1993).
In our analysis we will not be taking into account industry effects since we are analyzing the Portuguese wince producing sector as a whole, focusing on the firm-specific characteristics.
2.2.10. Share price performance
Share price performance can be impactful in capital structure if we consider the market timing theory presented in Baker and Wurgler (2002) since firms are expected to issue shares when these are considered to be overpriced. Once again, this ties into the fact that managers take the advantage of informational asymmetry with the outside investors to obtain funding at a lower cost than debt, leading to an inverse relation between leverage and share price performance.
Another variable that is related to market values and has significant results in the recent literature, is market-to-book assets ratio, since firms with high values in this ratio, are less leveraged on average. This behavior is according with the market timing theory; however, we must be aware that market timing theory does not explain any of the other factors mentioned, which in most studies account for a higher explaining power of capital structuring (Frank and Goyal 2009).
In our study, we will not analyze the impact of this variable and as such, the validity of the market timing theory, since we are exclusively using book values and accounting data.
2.2.11. Economic Shocks
The leverage ratios of firms suffer great impacts between different economic cycles. Firms lower the leverages ratios in the case of recession or even periods after recessions, not only due to the fact that credit becomes less available and consequently more expensive but as well as firms proactively tend to rely on internal forms of financing. In the case of the United Kingdom, smaller firms’ deposit accounts have registered to increase in periods either by restricting their investment policies, or simply, increasing their efficiency in order to accumulate more earnings. This might not be the case for larger firms since often these are perceived as less risky and as such, there is potential for an increase in leverage ratios. This is often due to the majority investors having a preference for lower gains and safer investments in times of economic recession.
If firms do engage into leverage into times of economic recession, their short-term leverage ratios seem to increase, opposing to the increase in debt maturity in the case of better market conditions. This is particularly relevant in small and medium-sized firms and might be deeply tied to the information asymmetry that investors value more in times of economic distress.
We must also note that firms, in case of economic straining, resort to commercial debt as a form of a substitute which might not be apparent in the conventional leverage ratios, and misleads us on our findings.
Frank and Goyal 2009 argue that the expected inflation has a significant impact in how firms plain the capital structuring, it has been found a positive relation in between leverage and expected inflation since the latter might be perceived as a reduction on the real cost of issuing debt.
2.3.
Portuguese Wine sector
The work of Viviani (2008) is a starting point for the analysis of firms in the wine industry, in their case the French wine sector comprised of a majority of small and medium-sized firms. As such their empirical results seem to be more in accord with the pecking-order theory, in which there is a significant negative relation between profitability, cash, asset turn over, age and non-debt tax shields with short-term debt, a positive impact of past growth and tangibility in both short-term and long-term debt. Additionally, there are no significant impacts of size or risk on the leverage ratios, as well as an indication of the “legal structure effect” (cooperatives present higher long-term debt than other legal forms), a sector effect and a small reputation effect with a positive impact on leverage.
Another important component is the particularities of Portugal pertaining to the regulation of Douro region winemakers, in which there are restrictions to the number of sales that these winemakers may perform in time as a form of maintaining quality.
The regulations state that in the case of Port wine (from the Douro demarcated region):
1) own warehouses in the Douro demarcated region, 2) have a permanent minimum stock of 150 000 liters; 3) sell only the authorized amount (quotas);
4) sell only a third of its current inventories in Port wine;
5) fulfill all the other rules (production, logistics, maturation, winemaking, among others) established by the Instituto de Vinho do Douro e Porto (IVDP)
It is also possible to buy an extra volume of sales with a restriction of sales applied pertaining to the age of the wine purchased. Firms are allowed to sell 20% of the wines bought if they are less than three years old, 40% of the wines bought if they are more than three years
old but less than four years old, 60% if more than four and less than five; 80% if more than five and less than six and 100% if the wine is older than six years old.
These requirements, to the best of the author’s knowledge, are not seen in any other winemaking segment, and as such the appliance of dummies accordingly will help us understand the impacts on leverage.
3. The Internship
The activities of this internship can be divided into various objectivities the firm had in mind for their operations. The first one is a valuation of the firm’s equity from a market view standpoint. This translated into a cash flow valuation, much like we had learned in previous courses. Real Companhia Velha anticipated to buy approximately 33.5% of its shares from one of their shareholders, as such they wanted someone with academic knowledge of some valuation processes, mainly the free cash-flow to firm approach in order to reach a feasible price/cost range for this operation. The final results of this work were kept in secrecy by the firm since it presented figures related with future investments and other sensitive financial data, which the facilitation to third parties might prove harmful for the firm’s operations. The second objective was to try to understand if their leverage and debt values would match those of their peers, and if not, what action should take towards further optimizing their debt values.
This last objective is the main reason of this internship report, as it is intrinsically related with the weighted average cost of capital that determines the value of the firm’s shares. Since, as mentioned prior, Portugal is a bank-oriented economy, and the majority of Real
Companhia Velha’s shares are in possession of one family (the founder’s family), to the exception of the 33.5% mentioned. The firm wanted to increase its gains through the leveraging or deleveraging, so it may the present the optimal liquidity in order to pay its obligations, but also have enough to keep growing and investing in new projects.
This is further supported by the fact that the firm in 2012 due to the crisis, they were forced to sell some of their assets and brands, as well as, shift their production strategy in the case. Now betting on a more developed and improved product, which presented higher quality but also relied heavily on the development of a strong branding component, they aimed to grow and come back from their previous losses.
The capital was necessary in order to create this large shift, so they contracted and renegotiated debt for larger maturities in order to be able to change their course around.
Strategically speaking, they focused more of their production in refining the product and improving their clients experience with it, and as seen in Table 1 – Peer’s ratios, this strategy resulted in a very large growth in a very short period of time, which allowed them to catch up to some of the larger players in the market.
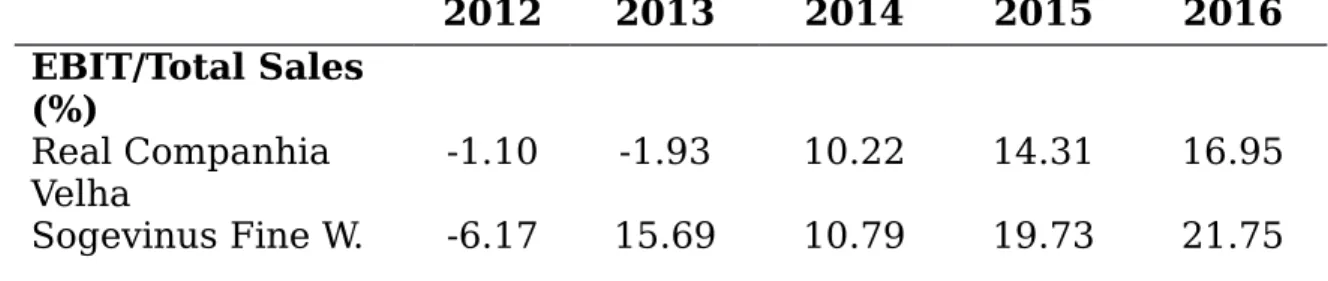
Table 1 - Peer's ratios
The table presents the earnings before interest taxes (EBIT) over total sales ratio, the total sales over total assets ratio, the EBIT over interest ratio, long-term debt over equity ratio and the net income over total assets ratio. All of the values used are exclusively accounting or book values from the various firm’s financial reports for the respective years. These results were taken from the subsample which consists of an unbalanced panel data for 609 firms from SABI Bureau van Djik database with primary code CAE REV 3: 1102, for the period of 2010-2016.
2012 2013 2014 2015 2016 EBIT/Total Sales (%) Real Companhia Velha -1.10 -1.93 10.22 14.31 16.95 Sogevinus Fine W. -6.17 15.69 10.79 19.73 21.75
S.A. Q.V.B. - Vinhos S.A. 13.74 15.06 17.67 16.93 13.25 Symington F. E.V. S.A. 8.04 12.95 7.23 7.60 11.17 Sogrape Vinhos S.A. 9.33 12.85 12.32 13.28 12.79 T. Sales/T. Assets (%) Real Companhia Velha 17.46 17.42 18.22 17.81 18.14 Sogevinus Fine W. S.A. 30.12 33.93 34.34 35.94 35.58 Q.V.B. - Vinhos S.A. 38.93 41.66 45.31 44.13 42.23 Symington F. E.V. S.A. 38.41 39.62 38.94 37.81 42.47 Sogrape Vinhos S.A. 50.83 52.52 51.36 51.74 54.62 EBIT/Interest (%) Real Companhia Velha -13.62 -21.86 127.35 209.05 365.44 Sogevinus Fine W. S.A. -54.06 161.35 126.91 476.04 646.46 Q.V.B. - Vinhos S.A. 675.9 9 546.50 821.74 1263.80 1239.35 Symington F. E.V. S.A. 171.43 347.01 197.41 228.66 323.77 Sogrape Vinhos S.A. 30.68 26.27 14.14 8.88 4.56 Debt/Equity (%) Real Companhia Velha 26.70 15.85 30.23 33.50 34.41 Sogevinus Fine W. S.A. 47.66 128.22 108.94 107.39 84.24 Q.V.B. - Vinhos S.A. 28.10 44.93 27.47 17.56 21.48 Symington F. E.V. S.A. 49.91 56.38 43.42 35.18 46.26 Sogrape Vinhos S.A. 9.33 12.85 12.32 13.2 12.79
Net Inc./ T. Sales (%) Real Companhia Velha -8.99 -9.67 2.91 6.38 10.99 Sogevinus Fine W. S.A. 6.14 19.96 10.96 7.12 13.76 Q.V.B. - Vinhos S.A. 8.24 10.75 12.70 11.72 9.34 Symington F. E.V. 2.66 8.67 4.68 3.43 6.06
S.A.
Sogrape Vinhos
S.A. 2.12 4.39 4.03 5.15 4.73
In these ratios, we can already paint a picture of the performance of the firm compared to the most known firms on the market. We can see the fairly high EBIT margins in comparison, yet we see lower numbers of sales compared to total assets. This implies that Real Companhia Velha is a still a fairly small firm and it is not converting of all its assets potential into sales, like the others. We must also note that Real Companhia Velha does not own all of its production of grapes, and so the production inputs might be coming at a higher price than some of its peers, which in first insight does not seem to be influencing the EBIT margins for the period in analysis.
Another interesting component is the fairly low EBIT over interest ratio since this implies that the firm is having higher financing costs than the average, potentially due to its small scale and recent financial complication. This could be negotiated with the firm’s capital suppliers in order to increase the company’s net income returns, which are also low when comparing to its peers. A consequence of this high financing cost is seen on the low debt over equity ratio, which is also lower than the majority of its peers. Although there is much to be done to reach the ratios of these well-renowned firms, Real Companhia Velha’s debt contracted for the financial recovery process has been mostly paid off, and the rest of it is reaching the end of its maturity.
With plans for future investments, the firm wanted to know how much could they safely employ in debt without harming its current and future financial health. This study seemed appropriated in order to present an empirical analysis of not only which debt values should they aim for, but also which components truly impact debt in recent years, so that they may keep their financial goals in a stable path, as well, negotiate their debt in order to reach reasonable and sustained
debt costs that would not overburden the firm’s revenues and investments as it did in the past.
Since the wine industry firms can have very different financial profiles depending on what type of product they sell, due to the regulations imposed on the Port wine segment. We found that developing this analysis for both segments would present the firm, and the academic community, with more insight into the different financial patterns seen in the industry. This can be very important since the firms may choose to either invest their funds on the Port wine segment, or Table wine segment, in which the latter often presents higher profit margins for the producers and lower prices for the consumers. We can infer that there is a possibility that the regulations imposed in the Port wine production are creating higher costs for the producers comparatively to Table wine segment in which there is more freedom in devising the product.
On the next sections of the report we will try to answer all of the previous questions empirically but also try to understand which capital structure theory is truly present in the Portuguese wine segment and it would determinant the sign of the determinants analyzed, as well as it would aid in the devising of the firm’s financial and operational policy.
4. Methodology
4.1.
Sample
The sample selection was taken form SABI, a database managed by Bureau van Dijk, which holds accounting and operational data of both Portuguese and Spanish firms. From the over three hundred and fifty thousand Portuguese firms’ information, we have collected data pertaining to the industry of years of 2010 to 2016 considering the respective primary code CAE REV 3: 1102 – Indústria do Vinho (Wine Industry). This would lead us to the information on 737 wine firms in Portugal. Firms that did not hold all the required information were removed from the dataset as to obtain more consistent and accurate results, resulting in a total 609 firms. We will also resort to Instituto dos Vinhos do Douro e Porto (IVDP) as to obtain a list of which firms were producing Port wine in this period to understand if
there are structural differences in between exclusive table wine producing firm and Port wine producing firms. This dataset was comprised of both standard balance sheet and income statement results for the period as well as the accounts for marketing and advertisement expenses and cash flow for the beginning and end of the year.
We did not account for inflation in our analysis, since all variables but the Size variable, which is logarithmic, are ratios that present the denominator as the value for the total assets value in that year. Since inflation impacts the firms’ value in a fairly uniform way, it should not present issues in the results. To further cement this notion, all literature review point for inflation having a very similar impact in that specific sector, this implies that if we are analyzing only one economic sector, then inflation should present a non-significant impact in potential inter-firm differences in the analysis. Moreover, a form of avoiding biases, we followed the so-called Winsor approach regarding the 1% tails of the distribution of all variables which comprise the final ratios.
This translates into an adaptation of observations beyond the 99% confidence interval to the 99 percentile of the distribution in the various components of the variables. This would lead to a lesser impact of the outliers present outside of this range allowing for more accurate and robust results.
4.2.
Model Specification
Since the observations gathered are in panel data we must use fixed effects/random effects in order to obtain meaningful and significant coefficients that take into account the various relationships in between the variables. The coefficient’s interpretation is similar to that of a regular OLS model. However, we must not forget that all of the quantitative variables are presented as ratios according to total
to the exception of Size, taken as the natural logarithm of total assets. In equation 4.1 below we see a representation of the year fixed effects model we intend to use with various forms of debt ( (Y )Debtit ) which can take shape of these five ratios: Total Liabilities/Total Assets; Long-term Debt/Total Assets; Short-term Debt/Total Assets; Long-term Debt + Short-term Debt/Total Assets and Long-term Debt/(Long-term Debt + Equity) (%).
¿ ¿it +β2Growthit+β3Profitabilityit+β4¿Assetsit+β5Cashit+β6Salesit+β7Inventoryit+β8NDTSit+β9Advertisement Expensesit+β10Riskit+uit (Y )Debtit=β0+β1¿
(4. 1)
Coupled with these variables we intend to apply the yearly fixed effects, meaning a dummy variable that assumes the value of 1 according to each of the years of the sample (to the exception of a base year, in order to avoid multicollinearity) into the fixed effects regression seen above. The application of fixed effects regression is crucial for panel data such as the one we have collected, however since we want to capture the year effects we must forego the age variables as its low variation would present us non-meaningful coefficients, whose main impact in the data would be correlated with the year dummy variables mentioned.
4.3.
Dependent variables
Much like the studies already mentioned, determining the correct measure for leverage is essential for providing accurate results and scientifically correct conclusions, so that we may compare them with the already existent literature. With this in mind, we have decided to base our analysis in the Rajan and Zingales (1995) study, in which there stipulated five different measures of capital structure.
The most general form is that used by some recent studies such as Baker and Wurgler (2002), Fama and French (2002) and Kayhan and Titman (2007) is:
Total liabilities(Total assets−Book equity ) Total assets
(4. 2)
The main concern of this measure is that it will overstate leverage for most sectors, yet for some, non-debt items can be very determinant in capital structure, and prove to be essential when adapting the capital structure to corporate strategy.
To counteract the potential downfalls of the previous measure we use the more traditional form of debt ratio:
Long term Debt +Short term debt Total assets
(4. 3)
For even more accurate results we can divide the previous ratio into two:
Long term Debt Totalassets
Short term Debt Totalassets
(4. 4)
And finally, the most direct measure, and according to Rajan and Zingales (1995), the one that closely represents the impacts of historical financial decisions:
Longterm Debt Long term Debt +Equity
(4. 5)
Since our data is comprised of exclusively book value of debt instead of market value, we might incur into some divergences from some theories. In order to solve this, we resort to Bowman (1980), which demonstrated that there is a very large correlation between cross-sectional book values and market values of debt, and as such we can expect that the errors that we might incur will not be significantly large enough. Another reason to use book value of debt is the fact that it is believed that managers do not take market leverage into the decisions regarding capital structure because market values are
considered to be too volatile to base their corporate finance policies on. Graham and Harvey (2001) concluded that a large portion of managers did not rebalance their capital structure in response to market movements for this reason.
Additionally, we must state that by using the book definition of leverage the variables market to book ratio, expected inflation, as well as firm-size, should be excluded according to Frank and Goyal (2009) since they are not robust across various definitions of leverage unlike the industry median leverage, asset structure (tangibility) and profitability.
4.4.
Independent variables
The functional form of the independent variables assumes a standard mainframe ideal for this type of work. Most of all of these variables are ratios with the same base denominator of total assets, as such to present a good statistical relation with the before mentioned dependent variables. The only exception to this case would be the fifth dependent variable in which the denominator would be very different from the total assets, and as such, we expect less explanatory power from this regression in regards to this component, since the denominators in between independent and dependent variables would not match in the fifth regression analysis.
Nonetheless, we will maintain the composition of the variables as it is since it follows the work of Viviani (2008). As such the size will be measured as the value of the logarithm of total assets for each observation, whilst the age will be measured as the difference between the current year of the observation and the year of the constitution of the firm is at stake.
As stated by Hall et al. (2000, 2004), Degryse et al. (2012) e Mateev et al. (2013), the following relations can be stipulated:
H1: Firm’s size is negatively/positively related with short-term debt/ long-term debt, ceteris paribus.
H2: A firm’s age is negatively related to debt, ceteris paribus.
In the case of Growth, we have used the yearly variation of Non-Current Assets which coupled with both the previous Size variable as well as the Profitability variable, assumed as the earnings before interest and taxes (EBIT), we intend to understand both progressions of the firms in the various years and their respective impacts on the forms of leverage. As an alternate form of profitability, many authors have used earnings before interest, taxes, depreciation, and amortizations, yet since we intend to analyze the impact of non-debt tax shields (calculated as depreciation over total assets), we have decided to only use EBIT, as to differentiate these variables as much as possible.
Drawing from Hall et al. (2000, 2004) Bastos and Nakamura (2009), Vieira and Novo (2010), Serrasqueiro and Nunes (2011), Antão and Bomfim (2012), Degryse et al. (2012), and Mateev et al. (2013), the following hypothesis is formulated:
H3: Growth opportunities are positively/negatively related with short-term debt/ long-term debt, ceteris paribus.
H4: Profitability is negatively related to long-term debt, ceteris paribus.
Risk is a variable that may be calculated in various ways, yet we have decided to once again follow closely the work of Viviani (2008), by assuming it to be the difference in between the year of analysis’ EBIT and the sample’s average of EBIT. This time-varying variable would also allow us to perceive in which years the firm would be under or over performing in the time period of the sample. Implicitly, we would obtain the firm’s EBIT volatility and a measure of its ability to generate constant value, which is often taken into account by the various parties involved when issuing debt.
Similarly to the findings of Michaelas et al. (1999), López-Gracia and Sogorb-Mira (2008) the hypothesis is:
Regarding the asset structure, we have decided to use four different measures: the value of fixed assets, sales, cash, and inventories. All but the latter are used in various previous works across multiple industries. The inventory value was taken from Viviani (2008) and to our knowledge, it is often used in industries that require high stock values which are often correlated with both leverage and sales capacity as a whole, as in this case.
The storage of wine is extremely important in the production in all forms of wine, with particular relevance to high-quality wine (such as the case of the Port). So much so, that it is a common practice when contracting debt, that Port wine firms often provide information to the debt issuers (mostly banks) of their wine reserves. This information is provided by independent experts on wine and often covers the type of wine, its quantity, its age as the various species of grapes that comprise the wine. This information allows the lenders to understand the expected sales of the firm as well as the timing of the returns of investments, and if the levels of inventories are suited for the maintenance of the Port wine segment or other wine segments that the firm may hold, once again this is a consequence of the, previously mentioned, one third rule. As such this information almost always leads to higher discounts on the cost of debt when comparing to other sectors which do not have this requirement (especially in the case of high-quality wine). This is due to the fact that if the firm fails to pay debt, the wine reserves can be taken by the debt issuers as form of payment, since the bank may now sell them in the market in order to obtain the liquidity needed, as such the reserves can be seen as form of warranty of debt. Nonetheless, this occurrence seems only possible in the case of Port wine reserves, mostly due to the fact that our production quotas to Port wine established by IVDP, which make Port wine a scarce and valuable commodity.
From Hall et al. (2000, 2004), Sogorb-Mira (2005) and Mateev et al. (2013), we can derive the notion that tangibility of assets could affect different types of debt and stipulate the following hypothesis:
H6: Tangible assets are negatively/positively related with short-term debt/ long-term debt, ceteris paribus.
As in non-debt tax shields we expect very small significance in the majority of the sample, however, this variable should present a higher impact in larger firms of the sample, and as such, a higher impact in the Port wine segment of which Real Companhia Velha is a part of. As in Michaelas et al. (1999), Sogorb-Mira (2005), López-Gracia and Sogorb-Mira (2008), the hypothesis for:
H7: Non-debt tax shields are negatively related with debt, ceteris paribus.
In terms of recent years, there has been an increase of the volume of Port wine produced yet a decrease in the average marginal production which implies a decrease in average price, as such, debt issuers have been requiring this information much more often in order to ensure that their returns are safe as well as the financial health of the firm.
Regarding Portugal particularities, we must mention that the Port wine sector operates in a very different way of that of the table wine sector, and as such, it is expected that the values will be different for all the variables mentioned. Since it is a high-quality product we can also expect the branding of the product to be one of the most important competitive components in the market, this way we believe that we must analyze their uniqueness by one of the measures stated in Titman and Wessels (1988), the advertisement expenses. From in Titman and Wessels (1988), we have stipulated the following hypothesis:
H8: Firm’s Uniqueness is negatively related with debt, ceteris paribus.