1
Equalisation of territorial units’ incomes as a reflection of approach to
regional development policy – case study of Nordic, Central European and
Southern countries
– working / draft paper –
Authors:
Maciej Turala (mturala@uni.lodz.pl) Lasse Oulasvirta (lasse.oulasvirta@uta.fi) Pontus Tallberg (Pontus.tallberg@outlook.com) Gabor Peteri (gpeteri@lgidev.com)
Yannis Psycharis (psycharis@prd.uth.gr) Gertrudes Guerreiro (gdsg@uevora.pt)
INTRODUCTION
The last two decades witnessed an ongoing trend towards fiscal decentralisation in Europe – sub-central governments have been given more responsibilities and greater shares in public spending (Bloechliger & Vammalle 2012). The policy of decentralisation brings with it a promise of increased efficiency in terms of service provision and resource allocation on local and regional levels. The often unwanted consequence of decentralisation is that growing taxing powers and financial autonomies given to territorial units are accompanied by growing disparities in terms of wealth and/or income distribution between local governments. Hence the need for fiscal equalisation appears.
The overriding objective of fiscal equalisation is to correct imbalances in fiscal capacity of territorial units resulting from sub-central autonomy and differentiation in terms of tax bases and to allow local and regional governments to provide their citizens with services of comparable quality and quantity. A recent study across eighteen countries (Australia, Austria, Canada, Denmark, Finland, Germany, Greece, Italy, Japan, Mexico, Norway, Poland, Portugal, Spain, Sweden, Switzerland, Turkey, and United Kingdom) showed that fiscal equalisation involves transfers varying from 0.5% to 3.8% of GDP (Bloechliger, Merk, Charbit, Mizell 2007).
Depending on specific arrangements, equalisation mechanisms may be in line with the chosen policy for development, supporting either territorially balanced development or placing emphasis on development engines. This paper builds on notions of fiscal federalism and fiscal
2 equalisation to give a better view of approaches to income equalisation between territorial units in six European countries.
Countries chosen for comparison within the framework of this paper are different in terms of geographical location, size, levels of socio-economic development and adopted local government systems. The major criterion for choosing case study countries was their geographical location, as it is the authors‟ intention to highlight differences in approach to fiscal equalisation between the Nordic countries (Finland and Sweden), Central European countries (Poland and Hungary), and the Mediterranean countries (Greece and Portugal). The hypothesis which is put forward and tested by the research team is as follows:
The attitudes and approaches towards fiscal equalisation between local governments in: (1) the Nordic countries, (2) the Central European countries and (3) the Mediterranean countries differ significantly, reflecting cultural differences and different economic conditions in these countries.
Specifically, the following sub-hypotheses are put forward and tested:
+ higher level of socio-economic development tends to favour stronger equalisation policy and mechanisms between local governments;
+ countries where local governments participate to a greater degree in public sector expenditures require far stronger equalisation mechanisms.
The hypotheses are backed up by reasonable expectation that the extent of horizontal equity pursued in each country is based on value judgments of political actors in power. There might also be efficiency motives for equalisation grants (King 1984, 140-146). The first sub-hypothesis may be justified by the need of developing countries to favour rapid growth and encourage people to move from low productivity areas to highly productive areas, resulting with strategies favouring development engines and cautious with regards to high levels of redistribution (i.e. by means of equalisation grants to local governments in lagging areas). Respectively the more developed countries tend to emphasise equality at the expense of a lower growth rate and tend to favour stronger equalisation policy and mechanisms between local governments. The second sub-hypothesis is a natural anticipation that big volumes of local government activities lead rather to big than low volumes of equalisation of local government expenditures.
The paper starts with snap-shot descriptions of countries chosen for analysis. Country backgrounds present situation in terms of socio-economic development, inequality in terms of personal wealth distribution and approaches to equalisation of personal incomes in respective countries. Each country‟s background also includes basic information on administrative division, scope of tasks performed by local governments, general structure of local government incomes and level of local government expenditure relative to GDP or central
3 government spending. The second part of the paper is devoted to describing in more detail the grant systems and income equalisation mechanisms applied in all six case study countries. The final, third, part of the paper presents examples of how equalising measures work in relation to selected local governments which provide an overview of local governments of different income level prior to equalisation. This part then leads to conclusions, revisiting the hypotheses formulated above. The conclusions described in the paper are of a tentative character, showing possible research problems for future in-depth analyses which were not possible in a large, six-country comparison.
4
1. COUNTRY BACKGROUNDS
1.1. COUNTRY BACKGROUND: POLAND
Poland‟s economic development after the political and economic transformation of the early 1990s may be described as dynamic. The country‟s GDP per capita in purchasing power standards increased from just 43% of the average for the 27 EU member states (excluding Croatia) in 1995 to 65% of the EU-27 average in 2011 (Eurostat, June 2012). The Eurostat data shows that Polish GDP grew at a rate higher than that for the EU-27 for as long as data on Poland has been collected (since 1995), with the exception of only 2001.
Convergence of Polish GDP with that of other European Union countries has not been accompanied by convergence in terms of internal personal wealth distribution and in terms of local governments‟ capacity for generating incomes. The GINI index increased from 0.267 in 1992 and 0.323 in 1993 to 0.341 in 2009, peaking at 0.359 in 2004, the year of accession to the EU (World Bank 2013). Interestingly, the redistributive role of personal income taxation in Poland has been decreased in recent years.
Personal income tax (PIT) was introduced in Poland on January 1st, 1992. It is, by definition, progressive with nominal tax rates increasing over set thresholds of income. A significant change in personal income tax was introduced as of January 1st, 2009. Nominal rates of PIT amounted to 19%, 30% and 40% before that date, while only two rates (18% and 32%) remained after. Furthermore, there exists a small sum of income which is exempt from tax (this is approx. 800 EUR per annum), as well as numerous regulations which cater for preferential treatment of certain taxpayers (i.e. spouses who can pay their tax jointly), as well as for exemptions and reductions (Podstawka, Deresz 2012). The real tax rates and fiscal burdens thus differ from person to person, allowing the PIT to serve its dual function: fiscal and redistributive, although it may be argued that the strength of redistributive, equalising mechanisms has weakened after the change which was introduced in 2009.
In terms of territorial self-governance Poland has many historical experiences, although modern day local governments have (re)appeared in 1990. The Local Government Act of March 8th, 1990 has led to creation of self-governing territorial units on the communal level. Currently, Poland‟s administrative division is a three-tier division which was introduced on January 1st, 1999. Apart from 2,479 communes, the organisation of which has not been substantially changed by the last reform of administrative division, there are now 380 districts (or counties) as well as 16 regions (Piasecki 2009, Turala 2011).
Legislation specifies tasks which all these territorial units have to perform, emphasising that activities of local governments on different levels need to be in line with the principle of subsidiarity. The tasks include, amongst others: spatial planning, environmental protection, public facilities and infrastructure, supplies of heat, gas and electricity, treating sewage, waste
5 management, local public transport, health care, social welfare, education, culture and public order (Owsiak 2005, Stawasz 2004).
The role of Polish local governments is best described by the amounts of their incomes and expenditures relative to the GDP of Poland. In 2011 Polish local governments collected incomes which amount to 11.25% of the GDP (including: communes and urban districts: 8.71%, districts: 1.55%, regions: 0.99%). This amount is comparable with state budget incomes which amount to 18.22% of the GDP (whereas the incomes of the entire public sector, including local government budgets and state budget amount to 39.67% of the GDP). On the other hand, local government expenditures amount to 11.92% of the GDP (including: communes and urban districts: 9.27%, districts: 1.58%, regions: 1.07%), while state budget expenditures and overall public sector expenditure amount to 19.87% and 43.33% of the GDP respectively (Central Statistical Office of Poland 2013).
The required incomes are provided through a mixture of sources, including own incomes and various grants. The communes were given the greatest financial autonomy (see: Oulasvirta & Turala 2009, Patrzalek 2010) – only they may collect local taxes and numerous local fees. Districts and regions on the other hand rely heavily on transfers from the central budget (Hanusz, Niezgoda & Czerski 2009). The communes which are the most autonomous territorial units in Poland and, at the same time, responsible for the greatest scope of tasks receive (data for 2011) 29.5% of their incomes came from local taxes, fees, incomes from property and other sources of own incomes. Further 16.0% comes from personal and corporate income tax shares awarded to communes, while 30.7% comes from general grants. The remaining 23.8% of communes‟ incomes comes in a form of targeted grants.
6
1.2. COUNTRY BACKGROUND: HUNGARY
Hungary belongs to the less developed countries of the European Union. The overall indicator of economic development, the GDP per capita is only 38% of the EU27 average (measured in EUR in market prices, Eurostat, 2013). Calculating the same indicator in purchasing power parity, the GDP per capita is EUR 16,725, with an annual increase of 2.3% in 2012 (CSO, 2013).
Regional differences in economic development increased during the past decade (Figure 1.). There are three major geographical-economic regions in Hungary: the most developed Central region, which includes the capital city, Western part of the country (Trans Danubia) and the poorer Great Hungarian Plain with the Northern, hilly region. As it can be seen from Figure 1. Budapest and Central Hungary region, which produces 48.8% of the national GDP, has increased its advantage compared to the country average: Budapest was 198% in 2000, but 220% of the country average in 2011. So according to this general indicator of economic development the regional differences are expanding.
Figure 1. Regional GDP per capita as % of the national average.
Source: prepared by the authors based on data from Central Statistical Office of Hungary.
The regional variations are influenced by the income differences, as well. The Gini index was 26.9 in 2012 (Eurostat), which is well below both the EU 27 average (30.4) and the indicator of the new EU member states (30.3). The trend during the past decade is also striking: Gini index in Hungary was 33.3 in 2006 and dropped to 24.1 by 2010. This increase in income difference in partly explained by the restructuring of household income: income from labour is only 66.6% of the gross per capita household income (69.6% in 2006), while the social revenues (pension, child-care subsidies, social assistance) are increasing. Obviously they cannot compensate the losses in labour income. In the same period the share of household revenues used for capital spending has declined by half. So in 2012 only 3.1% of total
7 available household income was used for investments (e.g. housing), the rest was consumption (in 2006 the same indicator was 5.6%).
Figure 2. Major taxes as % of central budget revenues.
Source: prepared by the authors based on data from Central Statistical Office of Hungary.
Personal income tax is one of the major central budget revenues: presently it provides 14.7 of total budget revenues (Figure 2.). So it is relevant from equalisation point of view. However, the composition of the major taxes also goes through a transformation: following the global trends consumption taxes are the largest public revenues and their share is increasing. So PIT is less significant factor of inequalities.
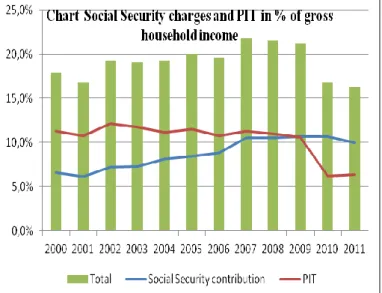
Figure 3. Social security charges and PIT as % of gross household income.
Source: prepared by the authors based on data from Central Statistical Office of Hungary.
Personal income tax should be always evaluated together with the other labour related taxes, fees and dues. They represent the total tax burden on residential income jointly. In Hungary the before 2010 their total share in gross household income was 21%, and slightly changing, however the ratio of social security charges was constantly increasing. The tax reforms of the
8 present government in 2010 significantly decreased PIT by introducing a flat rate at a relatively low level (16%). But due to the higher social security charges their share in household gross income remained the same (10%).
Hungary has a fragmented local government structure. There is a two-tier sub-national administrative system with county local governments at the intermediary level, cities and village municipalities at the lower tier. Average population size of local gove rnments is 3,200 and more than half o municipalities are below population 1,000 (Figure 3.). Due to this fragmented structure only 7.6% of total population lives on these smaller municipalities. The small municipalities are concentrated in the Trans-Danubian and the Northern regions.
Hungarian local governments have been responsible for a wide range of public services during the past two decades. They managed 25% of general government expenditures (approx. 12.5% of the GDP). Recent political changes (after 2010) resulted in centralisation of some costly municipal functions, such as public education, hospitals and administrative services. This reallocation of municipal functions led to a decline in local expenditures: local government expenditure fell to only 18.6% of general government expenditures in 2012 (this amounts to 9% of the GDP). These reforms have influenced the system of intergovernmental finances, as well, because new types of grants were introduced and the composition of centrally regulated transfers and shared revenues was modified.
Local governments are financed by three major types of revenues. Own source current revenues are dominated by the local business tax which provides 27.1% of total local government income. Together with the capital revenues (additional 9.3%) they represent 36.4% of local budget revenues. Local governments were eligible to shares in incomes from PIT – it is allocated on a derivation basis and amounts to 5.9% of total local government
9 incomes. Various intergovernmental transfers give the majority of the local budget revenues (57.7%).
10
1.3. COUNTRY BACKGROUND: FINLAND
Finland belongs to the Nordic countries that have traditionally emphasised the role of the public sector in the society and economy. The country is large in area and partly sparsely populated, which creates a challenging environment for arranging local public services and fiscal equalisation. Despite the rapid urbanisation in recent decades, around one third of the 5.3 million inhabitants still live in rural areas. Also the age structure of the population varies considerably between municipalities. As a result, the service needs and the operating environment as well as the ability to raise own source revenues differs much between areas in Finland. Despite these obstacles, Finland has been able to build an extensive public service system so that the country is considered to be a “Nordic welfare state” (Moisio, Loikkanen & Oulasvirta 2010). The level of local government expenditure in 2012 relative to GDP was 23.3 % (Statistics Finland, database: http://www.stat.fi/tup/tilastotietokannat/index_en.html). Finland joined the EU in 1995 and the EMU in 1999. The Eurostat data shows that Finnish GDP per capita has been gradually decreasing towards the EU-27 average. The country‟s GDP per capita in purchasing power standards was 117% of the EU-27 average in 2000 and 114% of the EU-27 average in 2011 (Eurostat, December 2012).
Although Finland clearly belongs to the Nordic countries with regards to its high degree of decentralisation, the Finnish case differs from the other Nordics in many ways. The most obvious difference is that public administration is organised into only two tiers of government in Finland: the central government and the municipalities, whereas in Sweden, Norway and Denmark the local government consists of municipalities and intermediate government level (Moisio, Loikkanen & Oulasvirta 2010,Loikkanen & Nivalainen 2011).
The GINI index in Finland increased after the severe economic recession in 1991-1993. The GINI index grew from 0.22 in 1995 to 0.27 in 2000 and to 0.28 in 2010. The GINI index has stayed between 0.27- 0.29 since 2000 (World Bank 2013). Having said that, it needs to be pointed out that Finland had the third lowest GINI index in 1995 and then in 2008 the seventh lowest GINI index of all OECD countries. Finland exercises a typical Nordic way of strong redistribution policies of household incomes. This emphasis on redistribution policies also permeates through state‟s fiscal policies towards municipalities (Oulasvirta & Turala 2009). The Finnish grant system redistributes efficiently municipal incomes from rich to poor municipalities and from municipalities with high service needs to those with relatively low service needs.
The Finnish Constitution safeguards the central features of local self-government, amongst others, the local authorities have the power to make financial decisions, based on the right to levy taxes. At the moment (2013) there are 336 municipalities in Finland. While Finnish local authorities have relatively small populations, the average size of local authorities has
11 increased in recent years because of mergers. According to the 2009 population data the average size of local authorities was 15,378 people (Suomen Kuntaliitto).
Municipalities have two kinds of functions: those mandated by national enacted laws (statutory functions) and optional or voluntary functions. The former include provision of basic services, the most important of which are health and social services, education and cultural services. In addition, municipalities are responsible for land-use planning and zoning. The voluntary functions include, for instance, sport and recreational services, i.e. all services which are not required by national law but the municipalities want to deliver to their inhabitants (Moisio 2011).
Those statutory specialized tasks that need a wide population base have been taken care by municipal joint organizations. About three-quarters of expenditures of municipal joint organizations are for provision of health organizations. The number of municipal joint organizations is about 180, the most important of which include 19 regional councils that take care of regional planning, 19 hospital districts, 38 joint organizations of public basic health care, 13 districts for disabled people and 43 joint authorities taking care of high schools and vocational learning (Suomen Kuntaliitto).
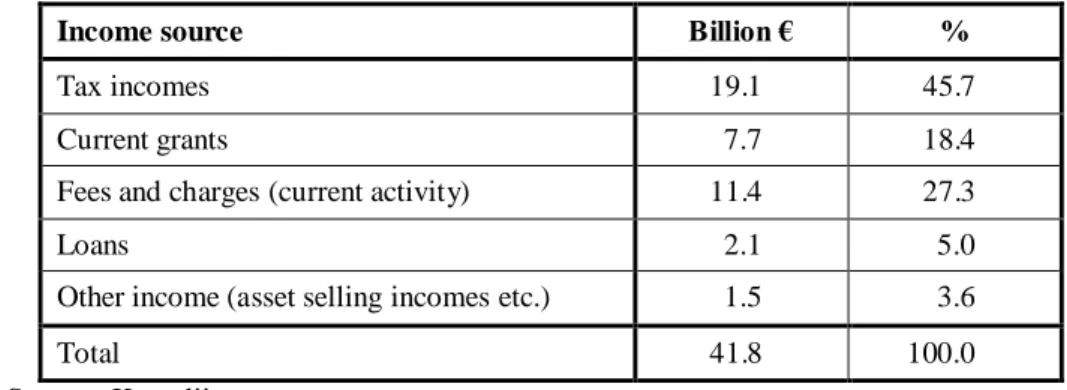
The Finnish municipal finances consist of tax revenues, grants, user fees and sales revenues. The main source of revenue is the municipal proportional income tax. Municipalities have also a property tax which has a small importance. Municipalities can set the property rates only within limits set by the central government. Municipalities are free to set their inco me tax rates without limits. The average local tax rate was in 2013 19.38% of taxable income (Suomen Kuntaliitto).
Municipal joint authorities do not have taxation rights. Municipal joint authorities derive their revenues by allocating and selling their services to their member municipalities. Joint authorities do not, as a main rule, get grants from the central government.
Table 1. Income structure of Finnish local governments (municipalities and joint authorities on municipalities), year 2011, book closures.
Income source Billion € %
Tax incomes 19.1 45.7
Current grants 7.7 18.4
Fees and charges (current activity) 11.4 27.3
Loans 2.1 5.0
Other income (asset selling incomes etc.) 1.5 3.6
Total 41.8 100.0
12 Municipalities have also a share of revenues from the national corporate tax. Municipalities do not have rights to decide about the tax bases, tax exemptions or deductions, which are decided by the central government and Parliament. Municipalities can decide freely of their overall spending levels and they are allowed to borrow freely without central government permission. The main part of the grant system in consisted of a single block grant that is based on service need and cost equalisation formulae. The grant system also equalizes tax bases of municipalities. Like other Nordic countries, the grant system results in a high degree of equalisation between municipalities (Moisio 2010).
13
1.4. COUNTRY BACKGROUND: SWEDEN
Sweden has about 9.6 million inhabitants (2013). Sweden's GDP for the year 2012 amounted to SEK 3.634 billions (SEK 378,600 per capita) In terms of PPP it is 116% of the per capita average in EU27 (Statistics Sweden; Economy Facts and Eurostat). Public spending total for the year 2010 amounted to SEK 1.69 trillion. This figure includes spending at state, county and municipal levels within their respective responsibility including health care spending on the county level and education and care spending on the municipal level. The Gini coefficient in Sweden has increased a little the last years and for 2011 it is 0,363.
Historically, Sweden has been a state with a strong national level (Riksdag, Government, and national authorities) and a similarly strong local level (the municipalities), with directly elected decision-making assemblies, the right to levy taxes, and an extensive area of responsibility. Today, Sweden is a nation-state, where the Riksdag (parliament) holds legislative power. Sweden has a parliamentary constitution, where the government is held accountable by the Riksdag. Like in other Nordic countries, the public sector has a strong role as part of the “Nordic welfare system”.
The country is divided into 21 counties, of which four are called regions. Each county has a County Administrative Board which is part of the government administration with traditions dating back to the XVII century (the first Swedish County Administrative Board was made up in 1634). Apart from the Board, there is also a separate County Council in each county (except for the County of Gotland, which consists of just one unitary local authority). The councils are elected directly by the citizens. The counties in Sweden have, on average, between 250,000 to 300,000 inhabitants.
Sweden is further divided into 290 municipalities which vary in size between 2,436 and 897 700 (Stockholm) residents. Table 2. shows the number of municipalities in varying population classes.
Table 2. Swedish municipalties divided into groups according population (2012)
Population class Total
2,436 - 6,000 27 6,001 - 10,000 50 10,001 - 20,000 94 20,001 - 40,000 59 40,001 - 100,000 46 100,001 - 897 700 14
Source: prepared by the authors.
A legislative municipal assembly of between 31 and 101 members (always an uneven number) is elected from party-list proportional representation at municipal elections, held
14 every four years in conjunction with the national parliamentary elections. The county councils – as administrations of the counties – do not control the municipalities in any way.
Sweden, as Finland, for example, is a large country in terms of size with many, especially northern parts, only sparsely populated. That generates problems for the (efficient) delivery of local services and requires a strong equalisation between municipalities in the denser southern and sparse northern regions of the country.
In essence, there are two political levels at which decisions are taken – the central government level and the municipal self-government level. There is thus a clear dichotomy between the national and local level of state power. The regional level in Sweden, at least up until now, has been less prominent. The county councils, which are also directly elected and have the right to levy taxes, are mainly responsible for one area; health care and medical treatment. However, the importance of the regional level is increasing, as is evidenced partly through the new Regions in Västra Götaland (population of approx. 1.6 million) and Skåne (population of approx. 1.2 million).
The responsibility of the municipalities was from the beginning based on the general needs of the citizens. The Swedish welfare state was expanded by turning the municipalities into the delivery agent of state services and provisions. This required bigger and more powerful municipalities to possess the necessary capacity, which meant that several smaller ones were amalgamated into fewer, bigger units.
The tasks of the municipalities and counties/regions is regulated by statute, with some 90% of them being statutory, compulsory tasks. However, there is some leeway for local choices, as municipalities are permitted to generally do work which is in the interest of the local population, but are not covered by established „must do‟ tasks. For this, municipalities and counties/regions have been granted powers of taxation. They do not have the right to decide what is to be taxed. But the municipalities decides the rate for the income tax which means that it differs between municipalities. The same goes for counties/regions.
The task of the state county administrative boards is mainly to coordinate state activities at county level as well as to monitor and to some extent coordinate and check activities of local authorities and county/regional councils, primarily health and medical services as well as tourism, regional culture and regional public transport. Local authorities, by contrast, are responsible for most other welfare services including schools, childcare, care of the elderly, social welfare, housing, rescue services, technical services (streets, waste, water and sewage) and also spatial planning. These make up the core of Swedish self-government responsibilities.
As mentioned before, local authorities and county councils have the right to levy local income taxes, which alone account for approx. 70% of their revenue. State agencies collect the taxes
15 on their behalf and distribute them to the respective authorities on the basis of their tax rate. In addition to these taxes, some state grants are paid out as non-earmarked block grants for local discretion. A challenge which calls for income equalisation measures, lies in the differences in tax-raising capacities between municipalities, reflecting structural economic and socio-demographic differences. As a result, the quality of services offered may also vary, leadin g to further shifts in population and economic patters through migration.
16
1.5. COUNTRY BACKGROUND: GREECE
The Greek Constitutional framework (Article 101) declares that the administration of the Greek state is organised according to the principle of decentralisation. Further, Article 102 states that the administration of local affairs shall be exercised by the first and second tiers of local government. This Constitution also allows for only two tiers of local government.
The milestones in the evolution of the administrative system in Greece at regional and local level during the last four decades are: (1) the establishment of regions in 1986 prior to their constitution as the second tier of local government in 2010 with fully elected councils and respective heads of regions (Law 2852/2010), (2) the establishment of prefectures as a second tier of local government in 1994 prior to their abolishment in 2010 and finally, (3) the two reforms of local administration from 1997 and 2010.
Since the restoration of democracy in 1974 and up until 1998, local government in Greece consisted of 457 municipalities and 5,318 communes. The reform of 1997, implemented through Law 2539/1997 (known as the „Kapodistrias Plan‟), resulted in drastic amalgamation and municipalisation. The number of local governments was reduced to 900 municipalities and only 133 communes. The second wave of reforms came in 2010 with Law 3852/2010 (known as the „Kalikratis Program‟). Further amalgamations resulted which reduced the number of communes and municipalities to just 325 municipalities (Chorianopoulos, 2012). Greece is a unitary state with very limited level of fiscal decentralization. Blöchliger et al. (2010: 18) and Leibfritz (2009:9) report that in 2006, according to fiscal decentralization indicators, Greece held the last position among its OECD peers, scoring just 6.3% in the ratio of the share of local government in total government spending and only 3.9% in the ratio of the share of local government revenue in total revenue.
Tax decentralisation is also very limited. With the Greek Taxing Authority remaining at the absolute power of the state, no tax can be legislated and levied from any other tier of government. According to the OECD Revenue Statistics, in 2010, local governments managed to collect only 0.87% of the total amount of taxes levied in the country. Local government tax revenue has remained at a level of less than 1% of total general government tax revenue over the last decade (OECD 2012) with Greece ranking as last among the OECD countries. Interestingly, this share is further decreasing over time, indicating that as time passes and uncollected tax liability accumulates, the less probable it is that this tax liability will ever be collected and thereby the authorities may have to ultimately delete it or characterise this debt as “uncollectible”.
As a result, Greece stands as the least decentralised across its OECD peers, with a very centralized tax system leading local government to a high degree of dependency on central government transfers.
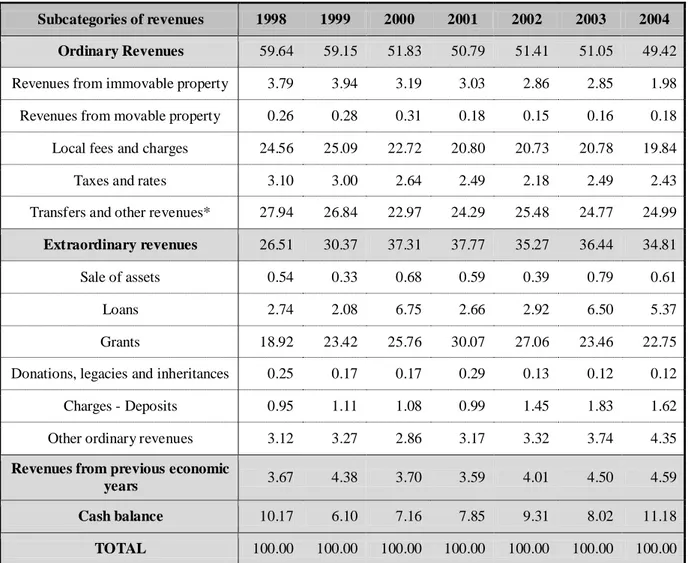
17 Furthermore, according to the Greek Constitution (Article 102) the state should provide local government jurisdictions the necessary means for executing their functions and responsibilities. Table 3. shows the composition of revenues of local authorities in Greece for the years 1998-2004 (Law 1065/1980). The revenues have been classified in accordance with Greek legislation into two categories: the regular and the extraordinary. Regular revenues include revenues from property, local fees and taxes, transfers (central autonomous funds) and other potential fees and rates in return of services delivered. The extraordinary revenues come from disposition of property, loans, donations, legacies and inheritance, local government participation in business activities, charges and administrative sanctions and any other source.
Table 3. Structure of the 1st level of Local Governments‟ revenues in Greece (%) 1998-2004.
Source: Hellenic Statistical Authority (EL.STAT) Revenues of Municipalities and Communities.
*Mainly revenues from State budget as provided in law (article 37 Law 4260/1962 & article 16 Law 703/1970)
Subcategories of revenues 1998 1999 2000 2001 2002 2003 2004
Ordinary Revenues 59.64 59.15 51.83 50.79 51.41 51.05 49.42
Revenues from immovable property 3.79 3.94 3.19 3.03 2.86 2.85 1.98
Revenues from movable property 0.26 0.28 0.31 0.18 0.15 0.16 0.18
Local fees and charges 24.56 25.09 22.72 20.80 20.73 20.78 19.84
Taxes and rates 3.10 3.00 2.64 2.49 2.18 2.49 2.43
Transfers and other revenues* 27.94 26.84 22.97 24.29 25.48 24.77 24.99
Extraordinary revenues 26.51 30.37 37.31 37.77 35.27 36.44 34.81
Sale of assets 0.54 0.33 0.68 0.59 0.39 0.79 0.61
Loans 2.74 2.08 6.75 2.66 2.92 6.50 5.37
Grants 18.92 23.42 25.76 30.07 27.06 23.46 22.75
Donations, legacies and inheritances 0.25 0.17 0.17 0.29 0.13 0.12 0.12
Charges - Deposits 0.95 1.11 1.08 0.99 1.45 1.83 1.62
Other ordinary revenues 3.12 3.27 2.86 3.17 3.32 3.74 4.35
Revenues from previous economic
years 3.67 4.38 3.70 3.59 4.01 4.50 4.59
Cash balance 10.17 6.10 7.16 7.85 9.31 8.02 11.18
18
1.6. COUNTRY BACKGROUND: PORTUGAL
Portugal joined the EU in 1986 and the EMU in 1999. Portuguese GDP per capita in purchasing power standards was 81% in 2000 and 77% in 2011 of the EU-27 average figures. Portugal is divided into seven NUTS II regions, five in mainland Portugal – North, Centro, Lisbon, Alentejo and Algarve, and two autonomous regions (islands): Madeira and the Azores, and 30 NUTS III regions (28 in mainland plus the two islands). These regions hold 278 municipalities in mainland Portugal and 30 municipalities in the islands.
In mainland Portugal, NUTS III regions with a higher population growth are also those experiencing lower rates of ageing, and with regard to demographic indicators the dichotomy coastal / inland is notorious. Moreover, the regions of greatest population dynamics are the ones that attract more immigrants, focusing there much of work force, particularly in metropolitan areas of Lisbon and Oporto. The Grande Lisboa (NUTS III region) is the strongest region, both in economic and social terms, with a tendency to depart increasingly from the other regions. The region of Oporto has also shown its strength, compared to other regions. The relative strength of these regions leads to large demographic and economic dynamics associated with the metropolitan areas of Lisbon and Oporto, which influence regional differences in income (Guerreiro, 2012a, 2012b).
The structure of the public sector is closely related with the structure of political power in Portugal with only two levels of democratic political decision on the mainland, but with three levels of government in a portion of the national territory: Government of the Republic, regional governments (autonomous regions of Azores and Madeira) and finally local governments. These three levels of government are politically legitimised through democratic elections and enjoy a high degree of autonomy and independence (political, financial, patrimonial and in management). They have their own budgets, proposed and approved by the respective executives in their representative assemblies (Republic Assembly, Regional and Municipal Assemblies) and prepare accounts for each financial year. The resources are derived mainly from tax revenues directly or indirectly (through grants from other levels of government). The central government receives EU funds as well as much of tax revenues, while regional and local government receives grants from the EU and from the State Budget, alongside its own revenues (Pereira et al., 2012).
Regions and municipalities have budgetary independence, but some government functions are performed jointly by the ministries, regional and local governments. For instance, the municipalities are responsible for school buildings, while central administration is responsible for the salaries of teachers, the municipalities are in charge of water supply, collection and waste management services, roads, streets and local gardens, but the security services and hospitals are the responsibility of central administration (see Table 4).
19
Table 4. Centralized and decentralized functions of Portuguese government levels.
Centralized functions
(Central government, public corporations and others)
Decentralized functions
(Local administration, municipal and intercity companies and others)
General Functions of Administration
Judicial system No competences in this field
National Defense No competences in this field
Public security Municipal police (optional)
Social Functions
Education:
1. National Curriculum
2. Teaching Staff (primary and secondary school) 3. School Equipment (Secondary)
4. Higher Education
Education:
1. Construction and maintenance of pre-schools and primary schools establishments
2. Non-teaching staff (basic school) 3. School social work
4. School transport
Health:
1. Hospitals, Health Centers 2. Medical, nursing and ancillary staff
Health:
1. Consultation and participation in planning the network of health center
Security and Social Action:
1. Transfers in favor of income (almost exclusively by central administration)
Security and Social Action:
1. Cooperation with social solidarity institutions 2. Cooperation (partnership with the central
government), in municipal social welfare programs and projects, particularly in the areas of combating poverty and social exclusion
Housing:
1. Regulation of the rental market (Rent control) 2. Urban renewal programs
Housing:
1. Provision of land for the construction of social housing
2. Promotion of housing programs
3. Cost control, eradication of tents and urban renewal
Cultural and Recreational Services:
1. Culture and science centers, libraries, theaters and national museums
2. Cultural, landscape and urban heritage (regional or national)
Cultural and Recreational Services:
1. Municipal cultural, landscape and urban heritage
Economic Functions
Agriculture, livestock, forestry, hunting and fishing:
1. Economic incentives to these sectors
No competences in this field Industry and Energy:
1. Distribution of electricity in high voltage and support to medium and small enterprises
Industry and Energy:
1. Distribution of electricity in low voltage 2. Urban and rural lighting
Transport and Communications:
1. National Network of Roads 2. Ports
Transport and Communications:
1. Viaducts, roads and complementary works 2. Municipal road network
Water, sanitation and waste:
1. Treatment of hazardous waste
Water, sanitation and waste:
1. Distribution of water 2. Solid waste treatment 3. Sewerage
Source: Pereira et al., 2012.
Currently, municipal indebtedness is limited by law to 125% of the revenue of the preceding year. Since 2005, there has been a contention of transfers of central administration, resulting from efforts to meet the commitments budget within the EU. As one of the measures to reduce the deficit in the short term, the Budget Act of 2006 imposed a zero increase of salary expenditure by local authorities (OECD, 2008).
The financial power of local government in Portugal is weak and, as such, it conditions the local governments‟ capabilities to handle the most diverse socio-economic needs at the
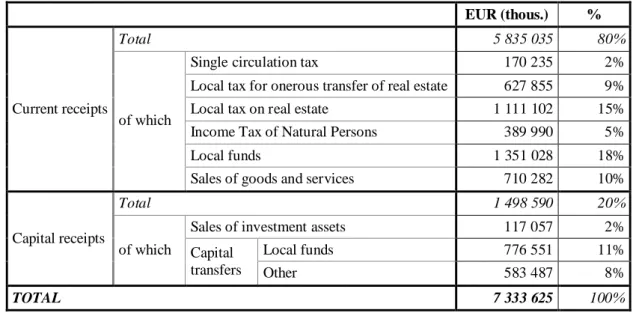
20 municipal level (Bilhim, 2004). In accordance with paragraph 2. of article 238. of the Portuguese Constitution, the rules governing local finances aim at achieving an equitable distribution of public resources by state and local authorities and the necessary correction of inequalities between municipalities of the same extent. The municipal participation in the state taxes is defined in Law no. 2/2007, of 15 January (Local Finance Law - LFL), with amendments introduced by Law no. 22-A/2007 of 29 June (Municipal Website).
The Portuguese municipal receipts consist, above all, of tax revenues and local funds described above (Table 5).
Table 5. Income structure of Portugal local governments (2010).
EUR (thous.) %
Current receipts
Total 5 835 035 80%
of which
Single circulation tax 170 235 2%
Local tax for onerous transfer of real estate 627 855 9%
Local tax on real estate 1 111 102 15%
Income Tax of Natural Persons 389 990 5%
Local funds 1 351 028 18%
Sales of goods and services 710 282 10%
Capital receipts
Total 1 498 590 20%
of which
Sales of investment assets 117 057 2%
Capital transfers Local funds 776 551 11% Other 583 487 8% TOTAL 7 333 625 100% Source: INE.
21
2. INCOME EQUALISATION MECHANISMS – GRANT SYSTEMS
In this paper we emphasise grant systems as equalisation mechanisms are typically contained within grant systems or they use grant systems to redistribute resources from local governments which have more favourable economic conditions (i.e. greater tax base) to those where economic conditions are less favourable.
In order to allow for systematic comparison, each country‟s grant system is first described and characterized relative to four classifications of grants outlined below:
+ general vs. specific: general purpose grants may be spent freely by the local government without any restrictions given by the donor, while specific grants are earmarked towards precisely defined purpose or task; in case of specific grants a further sub-classification into current vs. investment (capital) grants is possible;
+ discretional vs. automatic: in case of discretional grants the donor has latitude in terms of awarding the grant or not as well as with regards to the amount of given grant, while in case of an automatic grant there exists legislation or other compelling regulation which determines whether the grant is given and in what amount; in case of automatic grants a further sub-classification into matching vs. non-matching grants is possible; by matching grants we understand those that are calculated as a percentage of local government expenditure on a given task; non-matching grants are calculated based on objective criteria reflecting needs for grants (i.e. population density, demographical structure, geographical location, etc.);
Regarding the allocation criteria of non-matching (calculatory) grants there are two basic classes of criteria, namely:
+ Expenditure need factors:
o Service needs (i.e. share of old people in population, number of school children etc.);
o Cost conditions in production (long distances, sparsely populated community and need to keep small service production units etc.);
+ Income (tax base) factors;
In addition, the paper gives an outlook of revenue sharing (PIT, CIT, VAT) arrangements which may be perceived as an additional source of general automatic grants, even though national legislation tends to regards them as own income sources.
After the systematic comparison of grant systems the paper presents the adopted solution with regards to equalisation mechanisms and their relationship to the grant systems. Specifically,
22 the paper emphasises whether equalisation is financed by the state (central budget) and/or by
means of redistribution of local governments‟ own incomes. Gross amounts of grants
financed by the state as well as gross amounts of local government‟s own income redistributed between local governments are provided.
Finally, each country‟s case study evaluates the outcome of the grant system and the equalisation mechanism by showing how the disposable incomes per capita change after the grant system and equalisation impact (both in gross as well as in relative terms).
23
2.1. INCOME EQUALISATION MECHANISMS: POLAND
Polish local governments on all levels are financed through a complex system of incomes which is composed of own sources of incomes (most notably: local taxes and fees as well as incomes from property) and transfers from the state budget (general and specific grants) (Owsiak, 2005).
Given the significant spatial differentiation of socio-economic development levels, wealth and taxation bases, the system of financing Polish local governments includes an equalisation mechanism within the system of general grants – in the so-called „equalising‟ and „balancing‟ parts of the general grant, to be more precise. Both these parts of the general grant system participate in the equalisation mechanism, albeit differently. The detailed regulations on how to calculate the equalising and balancing parts of the general grant are included in the Local Government Incomes Act of 2003 (Journal of Laws, no. 203/2003, item 1966).
The equalising part of the general grant is designed primarily to protect the economically weaker territorial entities by providing them with additional incomes which are meant to compensate for the fact that their per capita incomes from chosen local taxes and fees as well as from shares in the personal and corporate income taxes are relatively low (in practice this means that every commune / city whose incomes from sources mentioned above are less than 92% of the national average receives this part of the general grant) (Strzelecki et al., 2008). This part of the general grant system is financed from the state budget.
The equalising part of the general grant is composed of two components. The first of the two, referred to as or „primary‟ is received by those communes (cities) where the per capita incomes from six local taxes (property tax, rural tax, forest tax, tax on the means of transport, lump-sum income tax, tax on civil law contracts), chosen fees as well as PIT and CIT are lesser than 92% of the national average. The equalising power of this component of the general grant is relatively great and may reach up to 80% of the difference between the average incomes from the mentioned sources and the actual incomes in a given commune or city. Figure 4. shows how significant this component of the general grant is in flattening the disparities in incomes from local taxes and fees between communes. It is enough to say that once applied, this mechanism ensures that communes have at least 81.57% of average per capita incomes from the said sources.
24
Figure 4. Income equalisation in communes through the equalising part of the general grant.
Income equalization mechanism in communes through the equalizing part of the general grant
0 10 20 30 40 50 60 70 80 90 100 0 10 20 30 40 50 60 70 80 90 100
per capita tax-based incomes
before the equalizing part of the general grant
p e r c a p it a t a x -b a se d i n c o m e s a ft e r th e e q u a li z in g p a rt o f th e g e n e ra l g ra n t
per capita tax-based incomes before receiving the equalizing part of the general grant in relation to average per capita tax-based incomes in Poland (%)
theoretical level of per capita tax-based incomes after receiving the equalizing part of the general grant
Source: prepared by the authors.
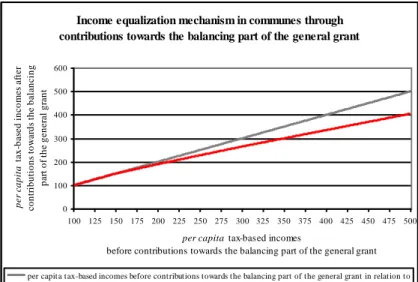
On the other hand, the balancing part of the general grant serves the purpose of further equalisation of income disparities between territorial units. What makes this part specific is that it provides a framework within which resources are redistributed between territorial units directly, i.e. territorial units which generate tax-based incomes which are significantly above the national average are supposed to contribute towards a fund which is then shared between the less wealthy territorial units. In other words – in order to increase the level of incomes of some territorial units, it is first necessary to reduce incomes of others. Figure 5. shows the strength with which the income equalisation system affects the communes generating the above-average tax-based incomes through the contributions towards the balancing part of the general grant.
Figure 5. Income equalisation in communes through the balancing part of the general grant.
Income equalization mechanism in communes through contributions towards the balancing part of the general grant
0 100 200 300 400 500 600 100 125 150 175 200 225 250 275 300 325 350 375 400 425 450 475 500 per capita tax-based incomes
before contributions towards the balancing part of the general grant
p e r c a p it a t a x -b a se d i n c o m e s a ft e r c o n tr ib u ti o n s to w a rd s th e b a la n c in g p a rt o f th e g e n e ra l g ra n t
per capita tax-based incomes before contributions towards the balancing part of the general grant in relation to average per capita tax-based incomes in Poland (%)
theoretical level of per capita tax-based incomes after contributions towards the balancing part of the general gran
25 The role of general grants in financing local governments in Poland is significant. In 2011 the amounts of general grants transferred from the state budget to communal and urban district budgets and their share in total incomes of communes and urban districts were, respectively (Polish Central Statistical Office, 2011):
o general grants in total: PLN 35.75 billion (26.94% of total incomes), including: equalising part: PLN 5.99 billion (4.51 % of total incomes);
balancing part: PLN 0.97 billion (0.73% of total incomes); educational part: PLN 28.43 billion (21.43 % of total incomes); other general grants: PLN 0.37 billion (0.27% of total incomes).
The grants transferred to Polish local governments are predominantly general, automatic and non-matching. Within this group, the balancing part and equalising part of the general grant are income-based, while the educational part of the general grant is expenditure-based.
The general grants are mostly financed from the state budget – the educational part and the equalising part of the general grant are transferred from the central government budget to local budgets. Only the balancing part of the general grant is redistributed amongst territorial units on all three levels of administrative division (communes, districts and regions).
In addition to general grants, Polish local governments participate in revenue sharing relating to the Personal Income Tax (PIT) and the Corporate Income Tax (CIT). Communes receive 39.34% of PIT revenue and 6.71% of CIT revenue, districts – 10.25% of CIT revenue and 1.4% and regions – 1.6% of PIT revenue and 15.9% of CIT revenue. Value Added Tax is not shared and remains in the central government budget in full. Formally speaking, these incomes are own incomes of local governments, even though their characteristics make them more similar to general grants. Communes and urban districts received as much as 20.62% of their total income from these tax sharing arrangements in 2011.
The remaining incomes are own incomes and specific grants. The data for 2011 shows that own incomes (apart from shares in PIT and CIT) amounted to 32.47% of total incomes in communes and urban districts. At the same time specific grants gave 19.97% of the local governments‟ incomes.
26
2.2. INCOME EQUALISATION MECHANISMS: HUNGARY
Equalisation was an important objective of local government finances in Hungary, not only because of the broad municipal functions, but due to the highly fragmented urban structure, as well. The average size of municipalities is only 3,200 (incorporating Budapest, the capital city in the national average). This means that 54% of municipalities have a population of less than 1,000.
During the past two decades two major trends can be detected in the total per capita local government revenues. Firstly, there are three clearly identifiable groups of local governments with different levels of per capita budgets: the capital city, the cities with population above 5,000 and the smaller towns, villages with lower population. The differences are caused by the costs and the scope of services performed.
Secondly, there was a reallocation of funds from the capital city towards the other municipalities in the period of 2002-2007. As transfers and shared revenues finance 70% of local budgets, this relatively stable level of local government revenues was achieved through various intergovernmental fiscal arrangements.
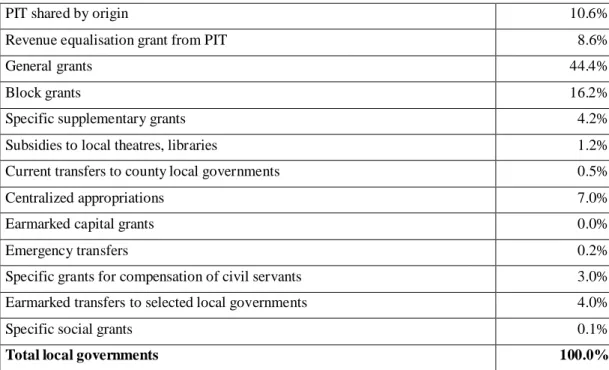
Local government transfers are dominated by the general grants (Table 6.). They are allocated by indicators of service capacity and population number. Similar methods are used for allocating block grants, for example in the case of particular education services. Centralized appropriations are allocated as subsidies for specific tasks, such as utilities, co-financing EU projects, road building, etc. Diverse earmarked transfers aim to provide support to local theatres and other cultural institutions.
Table 6. Local government transfers and shared revenues, 2012.
PIT shared by origin 10.6%
Revenue equalisation grant from PIT 8.6%
General grants 44.4%
Block grants 16.2%
Specific supplementary grants 4.2%
Subsidies to local theatres, libraries 1.2%
Current transfers to county local governments 0.5%
Centralized appropriations 7.0%
Earmarked capital grants 0.0%
Emergency transfers 0.2%
Specific grants for compensation of civil servants 3.0%
Earmarked transfers to selected local governments 4.0%
Specific social grants 0.1%
Total local governments 100.0%
27 All these grant mechanisms primarily aimed to guarantee the standard level of municipal services. They already have some built-in equalisation mechanisms. For example, transfers for municipal administrative services are differentiated by population size, when multipliers are used for groups of local governments. When the transfers are calculated as a difference of estimated expenditures and revenues, then the standard expenditures are measured separately for different groups of local governments. All these factors are defined by the annual budgets so they are transparent both at national and local level.
More direct equalisation policies are followed in the case of the deficit grant, which is available for municipalities with low revenue capacities. An emergency fund is allocated for local governments, which are hit by natural disasters or face vis maior situations. Since 2008 local capital investment are almost exclusively granted through the European Union funds, so the former earmarked capital transfers from the national budget lost their significance.
On the revenue side the shared revenues were used for equalisation purposes. A set percentage of shared personal income tax (PIT) was used for compensating those local governments which did not reach a minimum per capita sum of PIT and business tax revenues. These local tax capacity thresholds were differentiated by groups of municipalities with diverse population. This revenue equalisation mechanism operated for fifteen years till 2013.
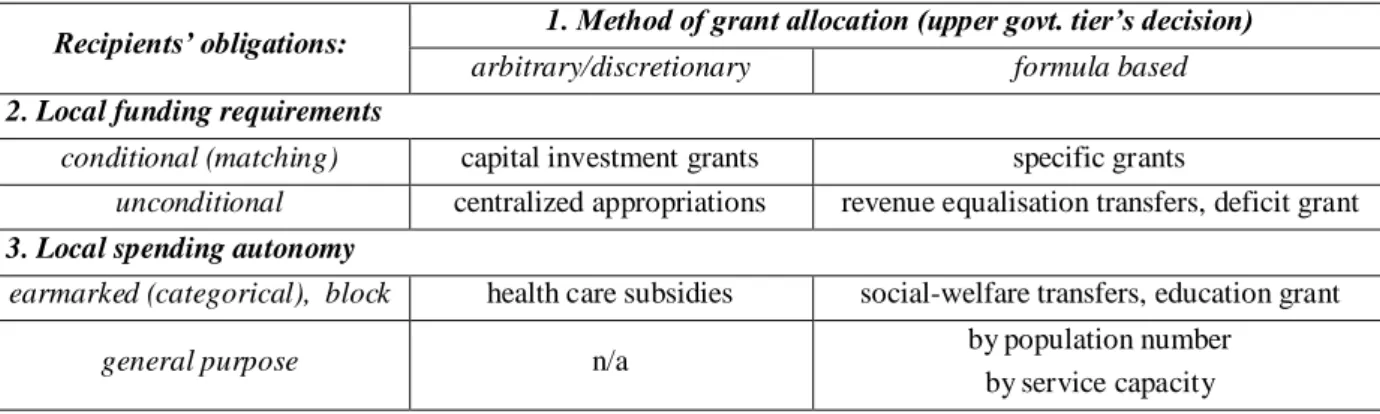
All these transfers, grants, subsidies and shared revenues can be categorized along three dimensions, as seen in Figure 6.:
a) how central funds are allocated, what types of regulations limit the discretion at national level (arbitrary or rule based allocation);
b) on the recipients‟ side there might co-financing requirements for matching grants or they might be unconditional grants;
c) finally municipalities might be constrained in using the available funds in the case of earmarked and block grants or they might have full local autonomy in using the received funds (general grants).
Figure 6. Typology of local government transfers.
Recipients’ obligations: 1. Method of grant allocation (upper govt. tier’s decision)
arbitrary/discretionary formula based
2. Local funding requirements
conditional (matching) capital investment grants specific grants
unconditional centralized appropriations revenue equalisation transfers, deficit grant
3. Local spending autonomy
earmarked (categorical), block health care subsidies social-welfare transfers, education grant
general purpose n/a by population number
by service capacity Source: prepared by the authors.
28 The grant allocation mechanisms discussed above fit into these boxes of the broad transfer typology. The overall trend of the past two decades was that natural disparities of local governments were managed by limiting local spending autonomy in spending and making the transfers more targeted. This tendency has changed the fiscal incentives for local governments, which became more grant dependent. Gradual transformation of grant allocation mechanisms weakened local incentives for own source revenue raising and to improve local expenditure efficiency. This decade long process led to the radical centralisation policies and bailout of the indebted municipalities in Hungary.
29
2.3. INCOME EQUALISATION MECHANISMS: FINLAND
In 1993, there was a major grant system reform that meant a change from a pure matching grant system with specific grants to a formula-based block grants system that is mainly automatic. In addition, the new Local Government Act was enacted in 1995. These reforms gave municipalities much more independence to decide their own matters, but the other side of the coin was that this freedom had to be targeted to spending cuts because of the severe economic situation in the country in the beginning of 1990‟s. The economy upswing began in 1994, but the municipal finances were still tight for many years partly due to grant reductions during the 1990‟s.
As in Poland and in other case study countries, there are big differences between the basic local governments, municipalities, in Finland. The smallest municipalities have about 1,000 inhabitants while the capital city of Helsinki has 600,000 inhabitants. The poorest rural municipalities‟ grant income is over 60 % of their total income while the corresponding figure is below 10 % for richest municipalities in the urban capital city area (Statistics Finland). A couple of the richest cities actually end up in the grant and equalisation system to a negative figure (“negative grant”).
The fiscal equalisation consists of two parts: the block grants system that aims to offset disparities in public service costs and the revenue equalisation that aims to equalise tax bases (Figure 7.). The block grants are defined using formulae. The revenue equalisation is organised separately, but block grants and revenue equalisation are united in the payments phase. The fiscal equalisation is quite extensive (Figure 8.). After tax base equalisation and block grants, the tax and grant resources per capita are similar in municipalities of different population sizes. The cost equalisation takes special account of the differences in need and operational environment, and that these are often highest in sparsely populated small municipalities. The fact that costs are also often high in the big cities due to urban cost factors like the share of immigrant based pupils or higher need for social assistance, is not adequately taken into account in the present grant models. This is one observation of a recent study on the present grant system (Lehtonen et al, 2008).
The block grant system was first introduced in 1993 when the matching grant system was abolished. The block grant system is based on so called “calculatory costs” that are defined using various formulae depending on the service. The block grant system constitutes the cost equalisation of the State grants system and is totally financed from the central government budget. The revenue equalisation is operated solely between municipalities and no central government funding is involved (Moisio et al. 2010).
Administratively the system works so that revenue equalisation is used to alter the block grants so that if the municipality has to pay in to the “revenue equalisation fund”, the block grants of that municipality are reduced by that amount. Similarly, in case where the
30 municipality is a receiver of revenue equalisation, the block grants are increased accordingly. The cost equalisation forms about 90 per cent of the total fiscal municipal equalisation in Finland.
The administration of the grant system was concentrated in the Ministry of Finance from the beginning of 2010. The Ministry of Education and Culture takes care of paying grants to expenditures of high schools and vocational schools and colleges (Moisio et al. 2010).
Figure 7. The administrative organisation of the Finnish grant system.
Source: prepared by the authors.
Ministry of Finance Grant formulas Tax base equalisation = Calcutorycosts – Municipal financing share Ministry of Education and Culture Grant formulas = Calcutorycosts – Municipal financing share = Grant 1* = Grant 1* +/ – TB equalisation +/– TB equalisation
= Final grant = Final grant
31
Figure 8. Municipal revenue sources by municipality size in 2007.
-1000 0 1000 2000 3000 4000 5000 6000 < 2000 2000-6000 6001-10000 10001-20000 20001-40000 40001-100000 > 100000 Block grant Tax base equalisation Corporate tax revenue Property tax revenue Income tax revenue Total EUR Population Class
Source: Statistics Finland and VATT Structural Indicators (Moisio et al. 2010, p. 35).
The major part of equalisation in the system comes from cost equalisation and less from the revenue equalisation. The grant system for health and welfare services is based on formulae. The formula for health care grant uses measures for population age structure, sickness and remoteness of the municipality (long distances and low density population). In the social and welfare services, the formula uses measures such as the population shares of child and elderly people, unemployment and remoteness. In addition, the social and welfare services formula uses need indicators for child day-care, child welfare and aid for the handicapped.
The formulae are used to calculate the estimated costs for health and welfare services for each municipality. The municipal financing share, that is same for all municipalities per inhabitant, subtracted form the amount of calculatory per capita cost and the result is the grant per inhabitant.
In the education services, such as comprehensive and secondary schooling, the formulae are based on the number of pupils. Also several additional cost indicators such as the share of pupils at the upper level of comprehensive schools, handicapped pupils, pupils in remedial instruction, pupils from foreign origin and Swedish speaking pupils are taken into account. In addition, indicators like population density, school size, bilingual status of the municipality and archipelago location are used. Just as in the health and welfare services formula, the calculatory costs of education and cultural services are used to define the grant for each
32 municipality. The municipal financing share is subtracted form the amount of calculatory per capita cost and the result is the grant per inhabitant.
Even if these above mentioned grants are calculated with sector specific criteria and are called sector specific grants in Finland they are by nature general non-matching automatic grants (block grants). The third element of the grant system, which is called in the Finnish grant terminology the general grant, is defined using several indicators that try to take both the rural and urban cost factors into account. The importance of this grant is small though, only about 2 per cent of all grants. This is as well the other above described grants block and non-matching automatic grants.
Revenue equalisation (tax base equalisation) is based on a municipality-specific calculation
of the tax revenues that the municipalities could raise, if they used the country average tax rates. The calculatory tax revenues are then based on actual taxable incomes and property tax bases together with the country average tax rates.1 The revenue equalisation system is to guarantee all municipalities 91.86 per cent of the average per capita calculatory tax revenues. The municipalities whose calculatory tax revenue is below this threshold receive the difference as a supplement to their block grants. The municipalities whose calculatory tax revenue is above the threshold, must pay 37 percent of the exceeding amount to the funding of the equalisation. In practice, the tax base equalisation is operated within the block grant system so that these sums reduce or increase the block grants. Although revenue equalisation is operated by the Ministry of Finance, the system is totally “financed” by the municipalities.
1
33
2.4. INCOME EQUALISATION MECHANISMS: SWEDEN
Sweden has a system of very strong financial equalisation. It seeks to counteract underlying structural differences and bring all local authorities and regions to almost a national average. This is necessary in order to maintain the system of taxation. The system of Swedish Tax
Equalisation is extensive and equals up to almost of 95% all payments between
municipalities. The system consists of basically two principles. It addresses differences in tax-raising capacity and underlying structural differences. It is constantly reviewed, since it needs to be adjusted to continuous changes, and since it is crucial for maintaining local tax-raising powers and legitimacy, based on the demands of the citizens for equal services no matter where they live.
The present system in Sweden came into operation January 1st, 2005. The purpose is to put all municipalities and counties on an equal financial base for delivering service no matter the income of the inhabitants and no matter structural situation. Difference in local taxes should reflect differences in efficiency and in levels of services and charges.
The system consist of five parts: income equalisation, cost equalisation, cost equalisation, a structural grant, a transitional grant and an adjustment grant/charge.
The income equalisation system is based on the difference between taxable income in the
local municipality and a base of 115% of the national average tax capacity for municipalities. The municipalities with a taxable income over the average has to pay equalisation charge to the Government. Municipalities with a taxable income less are entitled to grants. The system consist however mainly of a grant mainly from the government. In 2012 just 12 municipalities were net-payers to the system.
The cost equalisation is applied in case of differences in cost structure in the municipalities. There are two kinds of cost equalisation:
a) costs for service: in municipalities with a higher share of elderly than in average the cost for service to them will be higher then in other municipalities;
b) costs for producing service: in sparsely populated the costs for school easy can be over an average (smaller classes, bus transport).
This system is neutral between the municipalities. It is a complicated system based on a national standard cost and consist of different factors, which are updated annually and include:
+ pre-school service and out of school service, + compulsory school & pre-school service, + upper secondary school,
+ elderly care,