Faculty of Engineering of the University of Porto
ESCO Energy Audit – SONAE Indústria
João Filipe Mendes Granjo Lopes
P
RELIMINARYV
ERSIONThesis developed within the scope of the
Master of Electrical engineering and computer science
Major in Energy Systems
Supervisor: Prof. Dr. José Nuno Moura Marques Fidalgo
Co-supervisor: Prof. Dr. José Rui da Rocha Pinto Ferreira
i
Summary
Energy management is often neglected in the industry has it comprises a low cost when compared to costs such as labor and raw-materials. As such, energy waste is often common and impacts both the environmental sustainability and the production costs. This reality has been progressively changing due to the increasing international pressure to promote energy efficiency and also as a consequence of the present economic context, where cutting production costs has become a priority. Under this perspective, energy audits assume a particular importance: to manage the energy it is required to thoroughly understand its usage.
This thesis depicts the energy audit of a factory operated by SONAE Indústria, describing the work performed and advising a set of guidelines to help replicate the best practices on other factories of the group.
Considering that this factory has undertaken several energy audits in the past, what differentiates this project from the remaining is that it is meant to analyze smallest details and come up with measures that will make this plant the most efficient of the group of 26 factories, in 13 countries, operated by SONAE. It comprises a team with elements from SONAE, which have extensive experience in auditing, from EDP, which ranks amongst Europe’s largest electricity providers, and from the University of Porto, a reference institution of the higher education.
As a outcome of for this project, it is demonstrated that 9 energy efficiency measures were seen as feasible and, when implemented, will lead to savings of around 12.000MWh per year, which translates into savings of about 330.000€ per year.
Key words: Energy Audit, SONAE Indústria, EDP, Electrical efficiency, Mangualde plant, MDF
iii
Abstract
A gestão de energia é, recorrentemente, negligenciada na indústria visto que constitui frequentemente um custo relativamente baixo quando comparado com os custos de matéria-prima e mão-de-obra. Como tal, situações de desperdício energético são comuns. No entanto, esta realidade tem-se vindo a inverter devido à pressão internacional, que procura diminuir as emissões poluentes, e à situação económica atual, na qual se procura uma operação o mais eficiente possível. Na sequência desta mudança estratégia, empresas líderes de mercado que não negligenciam a sua responsabilidade social e económica, têm optado por criar planos para melhorar a eficiência energética.
Esta dissertação surge na sequência de um projeto nesse âmbito, que visa auditar energeticamente uma unidade fabril da SONAE Indústria, para posteriormente implementar medidas de eficiência energética. Ao longo do texto subsequente, o leitor pode encontrar uma descrição do projeto de auditoria, informações relevantes para a replicação do projeto, medidas para um consumo energético mais racional, e um estudo do impacte da implementação das medidas.
Como conclusão do projeto, demonstra-se que as medidas apresentadas permitem uma redução do consumo energético em cerca de 12MWh/ano, o que se traduz em poupanças efetivas de cerca de 330.000€/ano, o que constitui uma oportunidade de melhoria interessante, que irá ser capitalizada pela SONAE.
v
Acknowledgements
Apesar da língua inglesa dar voz ao trabalho que se apresenta, não poderia deixar de agradecer os vários, e valiosos, contributos que me foram dados na nossa língua materna. Desta forma, gostaria de agradecer ao Eng. Pedro Almeida Marujo e ao Eng. Luís Filipe Ferraz, pela oportunidade que me deram de entrar para o Universo Sonae, de conhecer os seus segredos e de aprender com a sua experiência. O companheirismo com que fui tratado ao longo deste percurso foi notável e por tal, estou ainda mais grato.
Ao Eng. Francisco Leitão, responsável pela energia da SONAE Mangualde, não há palavras para agradecer o seu tempo a ensinar-me, a partilhar os meus problemas como se dele fossem e a mostrar-me a cidade onde, antigamente, não conhecia ninguém e onde agora tenho bons amigos. Um sincero agradecimento.
Ao Prof. Dr. José Nuno Moura Marques Fidalgo, um sentido agradecimento pela orientação, flexibilidade e disponibilidade com que orientou este projeto, é-me mesmo impossível imaginar um orientador melhor para este trabalho, sendo que estou extremamente grato pela sua ajuda.
Por último, mas de especial importância, quero agradecer aos meus pais e à minha irmã, que sempre me apoiaram nesta jornada na Faculdade de Engenharia que chega agora ao fim com a entrega deste trabalho. Igualmente, e como se de família se tratassem, agradeço aos meus amigos, pelas horas de convívio que muito ajudaram nas alturas de maior stress e frustração.
A todos os mencionados, e a outros cujos agradecimentos serão dados pessoalmente, obrigado por tudo.
vii
Table of Contents
CHAPTER 1 INTRODUCTION ... 1
1.1-OBJECTIVES ... 2
1.2-DOCUMENT STRUCTURE ... 3
CHAPTER 2 FACTORY BACKGROUND ... 5
2.1-GENERAL FACTORY INFORMATION ... 5
2.2-LOCATION ... 6
2.3-HISTORIC OVERVIEW... 6
2.4-PRODUCTIVE PROCESS... 8
Flowchart of the Productive Process of MDF ... 8
2.4.1 Description of the MDF Productive Process ... 10
2.4.2 Description of the Wood Veneer Surfacing Productive Process ... 10
2.4.3 -2.5-DESCRIPTION OF THE ENERGY CONSUMPTION ... 11
Past Works on Energy Efficiency ... 12
2.5.1 -CHAPTER 3 THEORETICAL BASIS OF ENERGY AUDITS ... 13
3.1-CHARACTERIZATION OF ENERGY AUDITS AND EFFICIENCY MEASURES ... 13
3.2-METHODOLOGY ... 14 Planning ... 15 3.2.1 Field work ... 15 3.2.2 Data Analysis ... 15 3.2.3 -3.3-EQUIPMENT REQUIREMENTS ... 17
CHAPTER 4 INFORMATION REQUIREMENTS ... 19
4.1-GENERAL FACTORY INFORMATION ... 19
4.2-ENERGY CONSUMPTION ... 20
4.3-PRODUCTIVE PROCESS... 20
4.4-MOTOR DRIVEN SYSTEMS ... 21
4.5-ARTIFICIAL LIGHTING ... 21
4.6-COMPRESSED AIR SYSTEMS ... 22
4.7-AIR-DRIVEN TRANSPORTATION SYSTEMS ... 22
4.8-DE-DUSTING SYSTEMS ... 23
4.9-ENERGY MANAGEMENT ... 24
4.10-ADDITIONAL BEST-PRACTICES ... 24
CHAPTER 5 DEFINING METERING POINTS ... 25
5.1-INITIAL FACTORY OVERVIEW ... 25
5.2-CONCLUSIONS OF THE INITIAL FACTORY OVERVIEW ... 27
5.3-IMPLEMENTATION OF THE METERS ... 27
CHAPTER 6 MEASURES FOR ENERGY EFFICIENT OPERATIONS... 29
6.1-PREVENTIVE MAINTENANCE PLAN FOR THE VAPOR PIPELINE ... 31
6.2-OPTIMIZE THE OPERATION OF THE WOOD CHIPPER ... 31
6.3-OPTIMIZE THE OPERATION OF THE REFINER ... 31
6.4-INSERTION OF A DAMPER IN THE DE-DUSTING SYSTEM PIPELINE ... 32
6.6-REDUCTION OF THE COMPRESSED AIR LEAKAGE ... 32
6.7-IMPROVEMENT OF THE VENTILATION OF THE COMPRESSORS ROOM ... 33
6.8-INSERTION OF A VARIABLE TENSION SYSTEM FOR THE ARTIFICIAL LIGHTING ... 33
6.9-IMPLEMENT GAS BURNER AUTOMATIC CONTROL ... 34
6.10-REJECTED MEASURES FOR EFFICIENCY INCREASE ... 34
Installation of a photovoltaic panel ... 34
6.10.1 Renewing the Thermal Isolation of the Thermal-fluid pipes in the Glue Tank ... 35
6.10.2 -6.11-OVERVIEW OF THE MEASURES ... 35
CHAPTER 7 EXPECTED OUTCOME OF THE IMPLEMENTATION... 37
7.1-SUMMARY OF ENERGY EFFICIENCY MEASURES ... 37
7.2-CHARACTERIZATION OF THE CURRENT ENERGY CONSUMPTION ... 39
Electrical Energy ... 39 7.2.1 Thermal Energy ... 40 7.2.2 Natural Gas ... 40 7.2.3 Specific Consumption of the MDF product ... 41
7.2.4 Overview of all the energy consumption ... 42
7.2.5 -7.3-PREDICTED CONSUMPTION AFTER THE IMPLEMENTATION OF THE MEASURES ... 43
Electrical Energy ... 43 7.3.1 Thermal Energy ... 44 7.3.2 Natural Gas ... 44 7.3.3 Overview of the differences ... 45
7.3.4 -CHAPTER 8 CONCLUSIONS AND FUTURE WORK ... 49
8.1-OVERVIEW OF THE PROBLEM AND FINAL ANALYSIS OF RESULTS ... 49
8.2-FUTURE WORKS ... 50
ix
List of Figures
FIGURE 2.1LOCATION OF SONAEINDÚSTRIA MANGUALDE PCDM,SA ... 6
FIGURE 2.2AERIAL PICTURE OF THE FACTORY ON THE YEAR 2012 ... 8
FIGURE 2.3FLOWCHART OF THE MDF PRODUCTIVE PROCESS... 9
FIGURE 2.4ENERGY CONSUMPTION SPLIT INTO THE DIFFERENT SOURCES ... 11
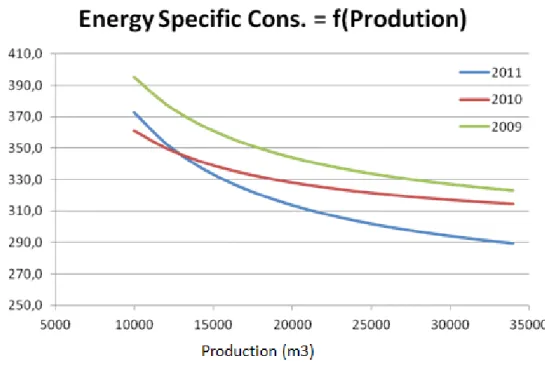
FIGURE 2.5SPECIFIC ENERGY CONSUMPTION AS A FUNCTION OF THE PRODUCTION. ... 12
FIGURE 3.1ENERGY AUDIT SPLIT INTO ITS OBJECTIVES ... 13
FIGURE 3.2FLOWCHART CONCERNING THE ACTIVITIES OF AN ENERGY AUDIT ... 16
FIGURE 5.1PICTURE TAKEN DURING THE AUDIT, PORTRAYING THE INSTALLATION OF A POWER QUALITY ANALYZER ... 28
FIGURE 7.1ENERGY CONSUMPTION COMPARISON ... 45
FIGURE 7.2RELATIVE DECREASE IN ENERGY CONSUMPTION AFTER IMPLEMENTING THE MEASURES ... 46
x
List of Tables
TABLE 2.1GENERAL FACTORY INFORMATION ... 5
TABLE 3.1CATEGORIES FOR ENERGY EFFICIENCY MEASURES ... 14
TABLE 3.2EQUIPMENT FOR A DETAILED ENERGY AUDIT ... 17
TABLE 4.1GENERAL FACTORY INFORMATION ... 19
TABLE 4.2ENERGY CONSUMPTION INFORMATION ... 20
TABLE 4.3PRODUCTIVE PROCESS INFORMATION ... 20
TABLE 4.4MOTOR DRIVEN SYSTEMS INFORMATION ... 21
TABLE 4.5ARTIFICIAL LIGHTNING INFORMATION... 21
TABLE 4.6COMPRESSED AIR SYSTEMS INFORMATION ... 22
TABLE 4.7AIR-DRIVEN TRANSPORTATION SYSTEMS INFORMATION ... 23
TABLE 4.8DE-DUSTING SYSTEMS INFORMATION ... 23
TABLE 4.9ENERGY MANAGEMENT INFORMATION ... 24
TABLE 5.1EXAMPLE OF A SCHEDULE FOR PRELIMINARY FIELDWORK ... 26
TABLE 7.1ENERGY PRICES ... 37
TABLE 7.2SUMMARY OF ENERGY EFFICIENCY MEASURES ... 38
TABLE 7.3ELECTRICAL ENERGY CONSUMPTION IN 2011 ... 39
TABLE 7.4THERMAL ENERGY CONSUMPTION IN 2011 ... 40
TABLE 7.5NATURAL GAS CONSUMPTION IN 2011 ... 40
TABLE 7.6SPECIFIC CONSUMPTION OF THE MDF PRODUCTION IN 2011 ... 41
TABLE 7.7CONVERSION FACTORS ... 42
TABLE 7.8OVERVIEW OF ALL THE ENERGY CONSUMPTION... 42
TABLE 7.9ELECTRICAL ENERGY CONSUMPTION AFTER THE IMPLEMENTATION OF THE ADVISED MEASURES ... 43
TABLE 7.10THERMAL ENERGY CONSUMPTION AFTER THE IMPLEMENTATION OF THE ADVISED MEASURES ... 44
Abbreviations, Acronyms and Symbols
List of Abbreviations and Acronyms
AC Alternate Current
BSC Balanced Scoreboard
e.g. exempli gratia (meaning “for example”) ESCO Energy Service Company
FEUP Faculty of Engineering of the University of Porto IRR Internal Rate of Return
kW Kilowatt
kWh Kilowatt-hour
kWp Kilowatt peak
MDF Medium-Density Fiberboard MIRR Modified Internal Rate of Return
MWh Megawatt-hour
NPV Net Present Value
PCDM Produção e Comercialização Derivados de Madeira (Production and commercializing of wood derived products)
PVC Polyvinyl chloride toe Tonne of oil equivalent VSD Variable Speed Drive
List of symbols
€ Euros
1
Chapter 1
Introduction
Energy is becoming increasingly scarce and, as such, it is urgent that all governments, industries and citizens adopt measures to utilize it efficiently. International committees have increased the pressure on governments to enforce the application of electrical efficiency measures: as an example, the European Commission adopted a plan which aims at the reduction of 20% of the consumption of energy in Europe, until the year 2020 [1]! It is even thought that one of biggest world’ challenge is to provide energy which is easily accessed and safe, without impacting the environment [2].
Aware of the importance of this matter, SONAE Indústria, one of the largest wood-based panels’ producers of the world [3], decided to develop a plan to reduce the specific consumption of their operations. In order to do so, the first step taken at a corporate level was to assign an energy manager in each of its 26 factories. This manager is in charge of developing projects to reduce the consumption of his factory and sharing their projects with the remaining group through monthly video-conference meetings.
That strategic change, which has been imposed since 2009, produced some interesting results: new technologies were introduced, energy was no longer seen as insignificant, efficiency had been improved, costs had been reduced and emissions had decreased. However, SONAE wanted to keep pursuing efficiency and cost reduction, and now it had at their disposable energy managers in each of its factories. Nonetheless, the simple, efficiency improvement projects have all been implemented; new ideas started appearing at a slower pace than before, and the measures that could be taken now are, apparently, the least profitable and, with the present economic crisis, senior management is not easily convinced in making funds available for projects that will that take over 5 years to provide any gains.
To overcome this apparent stall in efficiency improvements SONAE launched two pilot projects in two plants, which, if successful, are expected to be replicated in the remaining factories, spread over 13 countries.
One of these projects is the one this thesis describes: the performance of the most thorough energy audit ever achieved in one of SONAEs’ factories. Energy audits have been routinely performed before, as it is mandatory by the Portuguese legislation for facilities that consume over 1000 toe per year to have an energy audit every six years [4]. The difference is that, this time, the objective is to go into the smallest details, having been assembled a very
2
large team which comprises knowledge from SONAE Indústria, which is the second world’s biggest producer of wood board, EDP, which ranks among Europe’s major electricity operators, as well as being one of the largest business groups of Portugal, and the University of Porto, the largest Portuguese university by number of enrolled students and one of the most noted research outputs in Portugal [5]. This project is seen as an important improvement driver, which is noticeable not only by the involvement of such a large team, but also due to the funds made available which are about 5 times higher than what it is usually paid for an energy audit.
This way, the following thesis describes the most relevant issues of this project, and aims at providing the reader with enough information to be able to replicate the achievements and gain an understanding of the complexity an industrial energy audit might impose.
1.1 - Objectives
The project, in which this thesis is based, took place in the industrial plant established in Mangualde and had the purpose of performing an energy audit, in order to understand the energy needs and, subsequently, manage them and reduce the consumptions. As such, this dissertation has the objective of depicting the project, in order to share the gained
know-how with the remaining industrial facilities - specially the one’s operated by SONAE - and to
predict the impact of the energy efficiency measures implementation. As such, it includes the following objectives:
Theoretical defining an energy audit and defining the different steps it encompasses;
Characterize the audit process, providing guidelines for project replication, focusing on the most important success drivers :
o Audit Planning;
o Information Requirements; o Fieldwork;
Identify situations of energy waste;
Propose corrective measures for energy waste situations and new technologies to increase efficiency;
Estimate the outcome of the implementation of the energy efficiency measures;
Comment future work to further increase efficiency.
To sum up, this thesis intends to provide the reader with knowledge concerning an industrial energy audit, commenting on the different aspects that impact the outcome of the project, and analyzing the results. It is based on the actual work that was accomplished in SONAE and, as such, it provides both the theoretical perspective that was obtained through the analyzes of the works of the different authors referenced throughout the thesis, and the practical perspective, gained through the time spent in the factory, witnessing the difficulties and accomplishments that this project had.
3
1.2 - Document Structure
This report includes seven chapters besides this introductory chapter, where the topic that will be covered throughout this thesis is portrayed. Concerning the remaining chapters:
Chapter 2 provides a background of the factory in which the energy audit will be performed, defining both the plant and the productive process. It is important as the reader needs to be aware of the activity developed in the plant, in order to understand the challenges and particularities of this project.
Chapter 3 provides a theoretical context concerning the energy audit, explaining the best practices to perform the assessment, and clarifying the different processes that constitute this task. This chapter is relevant as it allows to compare the theoretical best practices with the actual work performed, allowing the reader to develop his own opinion concerning how such a project should be develop.
From chapter 4 to chapter 6, the actual activities for the energy audit are presented. Chapter 4 describes the information requirements for such an exhaustive audit, along with comments concerning the relevance of the information and the issues found while it was being gathered.
Chapter 5 comments on the fieldwork performed in the factory, more precisely it details the procedure followed to determine the most relevant monitoring points, and intends to provide criterion for the replication of the audit in other facilities.
Chapter 6 documents the energy efficiency measures to be implemented that are feasible both from the technical and the financial point of view. Simultaneously, it also refers measures that were analyzed but not implemented due to various reasons. Once again, it aims at providing enough information for the reproduction in other industrial facilities.
Chapter 7 predicts the impact of the implementation of the measures presented in the previous chapter on the future consumptions.
Chapter 8 summarizes the whole thesis, mentioning the main highlights and difficulties found during this work and discussing other chores to further increase energy efficiency.
5
Chapter 2
Factory Background
The following chapter offers some information concerning the industrial unit where the energy audit, in which this thesis is based, was performed. Ranging from a general factory overview to a specific description of the productive process, this chapter intends to provide the reader with background information to allow a better understanding of the audit process, and energy efficiency measures, described subsequently.
2.1 - General Factory Information
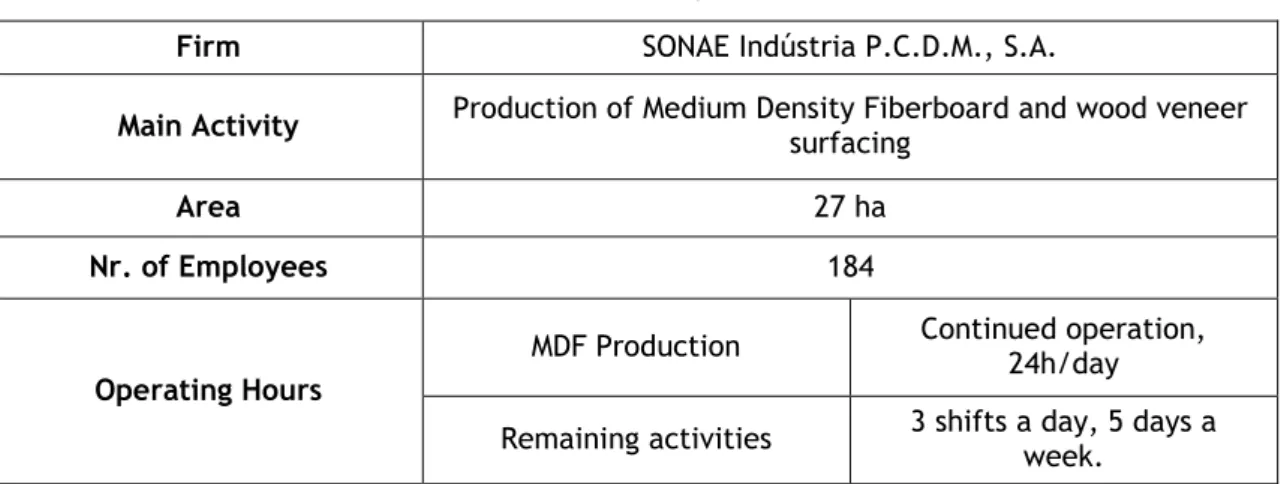
The plant in which the audit was performed is a plant that produces mainly Medium Density Fiberboard and wood veneer surfacing. It employs around 184 permanent employees and occupies an area of 27 ha, which, to put under perspective, is the area of about 32 football fields. The general factory information is summarized on the following table:
Table 2.1 General Factory Information
Firm SONAE Indústria P.C.D.M., S.A.
Main Activity Production of Medium Density Fiberboard and wood veneer surfacing
Area 27 ha
Nr. of Employees 184
Operating Hours
MDF Production Continued operation, 24h/day
6
2.2 - Location
The plant is located in Água Levada in the county of Mangualde, district of Viseu, as shown inFigure 2.1 Location of SONAE Indústria Mangualde PCDM, SA Figure 2.1 Figure 2.2:
2.3 - Historic Overview
After the installation of the factory in 1987, the factory suffered several improvements. The changes and developments it undertook up to this moment are presented in the following bullets [6]:
1987 SONAE Indústria launches the project of an MDF plant at Mangualde, under the name SIAF – Sociedade de Iniciativa e Aproveitamentos Florestais, SA (a forestry company created in 1946 by the Swedish Match Group that was later involved in wood-based panels and doors manufacturing and that was bought by SONAE Indústria at this time).
1988 Building construction start up, and startup of mechanical assembly.
1989 Company head-office moves to Mangualde and production of the first Sonaepan board, trade mark of MDF produced by SIAF.
40°35'18.31"N
7°47'41.38"W
7
1990 On the 8th of October there’s the official ceremony marking the opening of the Mangualde Industrial unit.
1992 SONAE Indústria – SGPS, SA, gets the control of 100% of SIAF bonds.
1993 The plant obtains the ISO 90000 certification and later that year, with a new diesel power generator unit, the unit becomes energy self-sufficient.
1994 Approval of a new MDF production line and start-up of that line installation (line II).
1995 Official opening of the second MDF production line and production of the first MDF board in line II. Later that year, the unit was recognized has a company responsible for electrical power and heat generation and supply.
1996 Start-up of the 2nd stage of biological treatment of the waste water treatment unit.
1997 Start-up of SIAF-Energy, SA, a company that manages the selling of the electrical production generated in the plant.
1998 Start-up of wood veneer surfacing line I.
2000 Start-up of wood veneer surfacing line II and, following the reorganization process of SONAE Indústria, the plant becomes part of Casca-Sociedade de
Revestimentos, SA.
2004 The MDF plant becomes part of SONAE Indústria – Produção e Comercialização de Derivados de Madeira, SA.
2005 The former ESSO Portuguesa Lda paraffin emulsions plant, located inside the Mangualde site, is integrated in the SONAE Indústria operation.
2007 Certification of the Environmental Management System according to standard NP EN ISO 14001:2004 in 20-06-2007 (Certification n. PT-2007/AMB.0313 issued by APCER – Associação Portuguesa de Certificação).
2008 Start-up of the third stage of the waste water treatment process, enabling the reuse of the treated water.
8
Figure 2.2 Aerial picture of the factory on the year 2012
2.4 - Productive Process
As stated before, there are mainly two products being produced in the factory: the MDF board and the wood veneer surfacing. Both production processes have a certain complexity which could lead to a much extended description. But, since the purpose of the chapter is to provide the reader with a simple production overview, only the general process will be analyzed , and commented upon.
Flowchart of the Productive Process of MDF
2.4.1 -
The following page presents a flowchart of the productive process of the MDF board. It is a simple overview, but offers a clear idea of process. On the top of the flowchart, the production of electricity and thermal energy, through the cogeneration plant, is displayed. Bellow it is presented the actual process to create a MDF board, starting from the wood chipper. It is interesting to notice how connected the cogeneration plant is with the production process, meaning that the behavior of the cogeneration plant (the thermal energy it provides) directly affects the production of the MDF. The same analysis will not be presented for wood veneer surfacing since it is a simpler process and a description is sufficient.
9
10
Description of the MDF Productive Process
2.4.2 -
Concerning the production of the MDF board, named Sonaepan board, it is an industrial process that transforms wood in various shapes (logs, slabs and chips) into compact and dimensionally stable board. These can be cut, profiled, sanded, painted and surfaced with wood veneer, PVC, paper or any other type of finishing, just like wood [3]. The main production stages are the following:
1. Chip Production: Chips (small wood strands) are produced in a blade wood chipper, that processes debarked logs and slabs, mainly from pine wood.
2. Chip Screening: Mechanical screening and separation of smaller and larger chips. The smaller chips are used as biomass for the cogeneration plant and the larger chips are redirected to the wood chipper again, to be made smaller.
3. Chip Washing: After the screening, the chip is washed with hot water to remove sand and dirt stuck on the wood pieces. The water used in this process is, afterwards, cleaned on the water treatment plant.
4. Chip Cooking: wood chips are “cooked” with steam in a pressurized digester, to enable an easier refining operation.
5. Refining: The wood chips, which are now softer due to the “cooking process”, are mechanically separated into wood fibers, by passing the chips between the metal discs of the refiner. This step is the most energy consuming step as each refiner has a 4MW motor and is working continuously.
6. Glue Spreading: Controlled dosage of the glue is mixed into the fiber. The glue is a mixture of resin and other chemicals in optimized proportions, which afterwards will act as the fiber bonding agent.
7. Drying: The exceeding water content of the fiber is thermally extracted with hot air, being released as water steam through the dryer outlet.
8. Mat forming: Fibers are uniformly deposed as a mat on a conveyor belt.
9. Pressing: The fiber mat is compressed in a multidaylight press (on the production line I), or in a continuous press (on the production line II), by means of pressure and temperature. When the glue curing temperature is reached, its polymerisation will bond the fibers and give consistency to the board.
10. Sanding: The board surface is finished through the passage of several sanding machines. The sanding grit gets thinner and thinner from one machine to another, and removes the less dense external overlay of the board.
11. Cutting: The board is cut to achieve the market required standard sizes, according to the customer requirements.
12. Packaging: Board packing and pallet assembly, with all the components that assure the pallet protection and identification, until its arrival to the customer.
Description of the Wood Veneer Surfacing Productive Process
2.4.3 -
The wood veneer surfacing, called Lamipan, production is a simpler process. It is also a much smaller energy consumer. To obtain a pack of wood veneer the boards go through the following process:
11
1. Line inlet: The first operation is to feed the lines with the raw materials: particleboard or MDF and the wood veneer. The veneer had previously been prepared in the lay-ons plant, where cutting and edge gluing of wood veneer is made, to get the lay-on dimensions required.
2. Gluing: Uniform distribution of the glue over the board in both the upper and lower surfaces.
3. Wood veneer lay down: In this step the positioning of wood veneer is done. Both up and down veneer lay-ons are positioned by a mechanical system, which uses vacuum heads to move the lay-ons.
4. Pressing: The board and lay-ons are now heat-pressed together until the glue reaches a reactive temperature and, consequently, glues the wood panels to the core board. 5. Edge trimming: The wood veneer that is oversized in length or width is cut off. 6. Sanding: The boards’ surface is sanded to provide it with a smoother exterior. 7. Grading: The boards are classified according to their quality.
8. Packaging: Board packing and pallet assembly, with all the components that assure the pallet protection and identification, until its arrival to the customer.
In the present situation, due to the lack of customer demand, the wood veneer surfacing is only partly functional, but is expected that in the following years, if the market responds as predicted, the production line starts operating at full capacity.
2.5 - Description of the Energy Consumption
Splitting the energy consumption into the different sources, and taking as reference the year of 2010, one can notice that electrical energy is the main consumer, as shown in Figure 2.4, accounting for around 80% of all the energy consumed.
12
It is possible to conclude, at this point, that the audit should focus primarily on electrical consumption as it is the most relevant driver for costs, and the most widespread energy on the factory. Nonetheless, taking into account that in the previous years this source of energy was the most managed, several improvements were already accomplished, which might mean that there are several opportunities present in the other energy sources.
Concerning the electrical energy, the most significant consumers are the motor driven systems, in particular the refiner, the compressed air systems and the air-driven systems. Regarding the natural gas, it is used as a back-up thermal energy for the productive process, used when thermal energy from the cogeneration plant is not available or when this thermal energy is too “dirty” for the making of premium products. Lastly, the thermal energy is used for the productive process, especially for drying the wood-fiber and for heating the presses.
Past Works on Energy Efficiency
2.5.1 -
As stated before, several energy efficiency improvement measures have been undertaken in this factory. Mainly, the measures focused on three areas: Idle reduction time, insertion of VSD in variable load motors and the insertion of a daily process which is called “Energy monitoring, targeting and reporting” and that aims at increasing the awareness for correct energy usage, through daily monitoring on the most significant equipment and daily discussions when abnormal energy consumptions are detected.
Through these three areas, a process for continuous improvement was created which is still undergoing. This way, it was able to obtain a decrease of 5.1% in the specific consumption when comparing the consumption from 2009 to 2011, as is highlighted in Figure 2.5.
13
Chapter 3
Theoretical Basis of Energy Audits
This chapter provides a characterization of the audit process and advices practices, from several authors, for a successful project. It is an important chapter as it will allow the reader to compare what is advised from a theoretical point of view to what was truly done in the project, and then conclude concerning the value of the practices presented.
3.1 - Characterization of Energy Audits and Efficiency
Measures
An energy audit is defined as a detailed examination of the energy usage of a given installation [7]. Through the audit process, it is possible to understand when and where the energy is used, what the efficiencies of the different processes are and where energy waste is happening. In other words, it is an examination of an energy consuming system to ensure that the energy is being used efficiently. Furthermore, it provides solutions for situations of energy waste and attempts to pinpoint those situations.
There are two types of energy audits defined, which are differentiated by the complexity of the work involved in performing them: one is denominated simple audit and, the other one, is named complex audit.
Concerning the simple audit, it comprises the visual observation and a superficial data gathering in order to diagnose the energetic situation of the installation. It is more common to find this type of audits in residential facilities. Regarding the complex audit, it comprises a
14
thorough analysis of the energy usage, detailing the energy utilized in each sector and process. It is the common audit performed on industrial facilities and it is the kind of audit that this thesis depicts, being that, from now on, the term audit effectively means a complex energy audit. Both of them are useful in providing measures to reduce the energy consumption, and in aiding the operators of the facility to use energy rationally, being differed only due to the scope of each: the simple audit is much more superficial.
Regarding the energy efficiency measures advised in any audit, they are divided in 3 categories in regard to their pay-off time [8] and to their impact on the productive process, as shown in Table 3.1 Categories for energy efficiency measures.
Table 3.1 Categories for energy efficiency measures
Category of Energy efficiency
Measure Capital Cost
Category 1 (named quick-wins in SONAE)
Pay-off occurs earlier than 6 months after the implementation. Usually involving idle reduction measures such as turning off non useful machinery.
Category 2
Involves low cost investment with some minor disruption of the operations. Pay-off occurs later than 6 months and earlier than 3 years.
Category 3 Involves relatively high capital cost investment or much disruption of the operations. Pay-off occurs after 3 or more years.
3.2 - Methodology
Different authors refer different methodologies concerning how the audit should be conducted. Nonetheless, all agree that it involves the process of undertaking chores in a well-defined and sequential manner, meaning that the planning stage is crucial [9]. Concerning the chores, it is agreed that they include:
a detailed analysis of the electrical energy payments of the preceding year;
a thorough analysis of the equipment present in the facility that produces or consumes electrical and thermal energy, exploring both their operation conditions and the maintenance activities performed on them;
identification of non-useful energy usage;
a list of measures in order to improve energy efficiency, that are feasible according to both technical and financial criteria.
15
Regarding the actual process to achieve the previously mentioned chores, it obviously depends on the size and complexity of the audit, and of the purpose it encompasses. Nonetheless, it includes at least four different phases: planning, fieldwork, data analysis, and elaboration of the report with conclusions and recommendations.
Planning
3.2.1 -
The planning stage of any audit constitutes one critical stage, has it directly impacts the efficiency of the remaining processes. Amongst the various chores to be undertaken in this stage, some are important to highlight due to their importance, specifically:
the determination of the scope of the project;
the clear statement of the objectives of the audit;
the schedule, with tollgates and milestones;
the audit team responsibilities;
the information requirements.
Without a project plan, due to the high number of activities that should be undertaken, it is more likely that some activities will be forgotten, and that the audit will not be as trustworthy as it could be.
Field work
3.2.2 -
The fieldwork includes two main chores:
Defining the energy consuming equipment that should be monitored
Installing the meters;
Naturally, the activities included in each of these tasks differ greatly from one industry to another, and therefore nothing can be concluded concerning the time each task might take.
Concerning the equipment required, it will be detailed on 3.3, nonetheless auditing best practices advice the use of portable measurement equipment. This is due to the fact that most industries are not equipped with proper measurement devices with acceptable margin errors.
The outcome of the audit depends greatly on the quality of the work developed on this stage. It is advised that, besides education in energy systems, the auditor possesses experience in auditing before attempting an industrial facility audit due to the increased complexity such facility displays. Above all, it is required that the auditor maintains full awareness in the development of the fieldwork, in order to identify all the possible opportunities for improvement.
Data Analysis
3.2.3 -
After the field work, the auditors shall organize and process all the information collected in the preceding stages. This analysis shall produce a number of metrics and indicators, of a quantitative nature, which will allow the assessment of electrical efficiency performance [6].
16
The most advisable practice is to segments the energy consumption per type of equipment, per type of product, and per factory sector. Concerning the most energy consuming machines, they should be compared to the most energy efficient options in the market in order to understand the savings that could be obtained.
17
3.3 - Equipment Requirements
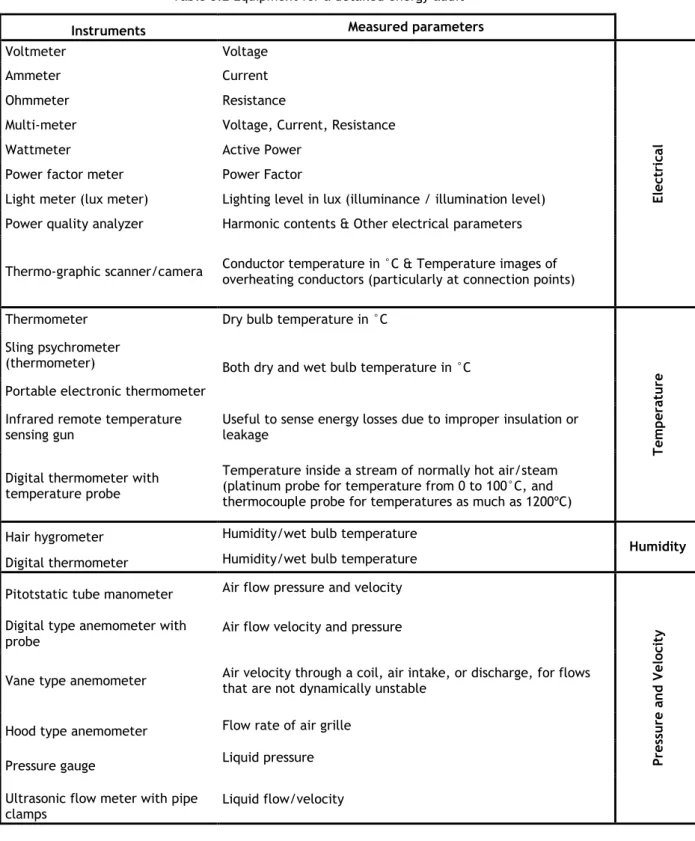
As stated before, monitoring equipment must be implemented onto the strategic points to measure the energy consumptions. Taking into account the several states in which energy can be found, different metering equipment is required. The next table provides an overview of the equipment for an energy audit.
Table 3.2 Equipment for a detailed energy audit
Instruments Measured parameters
Voltmeter Voltage E le ct ri cal Ammeter Current Ohmmeter Resistance
Multi-meter Voltage, Current, Resistance Wattmeter Active Power
Power factor meter Power Factor
Light meter (lux meter) Lighting level in lux (illuminance / illumination level) Power quality analyzer Harmonic contents & Other electrical parameters
Thermo-graphic scanner/camera Conductor temperature in °C & Temperature images of overheating conductors (particularly at connection points)
Thermometer Dry bulb temperature in °C
Tem
p
erature
Sling psychrometer
(thermometer) Both dry and wet bulb temperature in °C Portable electronic thermometer
Infrared remote temperature sensing gun
Useful to sense energy losses due to improper insulation or leakage
Digital thermometer with temperature probe
Temperature inside a stream of normally hot air/steam (platinum probe for temperature from 0 to 100°C, and thermocouple probe for temperatures as much as 1200ºC) Hair hygrometer Humidity/wet bulb temperature
Humidity
Digital thermometer Humidity/wet bulb temperature Pitotstatic tube manometer Air flow pressure and velocity
Pres su re and V el oc it y
Digital type anemometer with
probe Air flow velocity and pressure
Vane type anemometer Air velocity through a coil, air intake, or discharge, for flows that are not dynamically unstable
Hood type anemometer Flow rate of air grille Pressure gauge Liquid pressure Ultrasonic flow meter with pipe
18
Instruments Measured parameters
Exhaust gas analyzer with probe Boiler exhaust temperature, O2, CO, CO2 and NOx contents
Mi sc el la n eo u s
Refrigerant gas leakage tester Detect refrigerant leakage Ultrasonic leak detector Detect compressed air leakage Steam leak detector Steam leakage, usually for steam trap Tachometer Rotation speed
19
Chapter 4
Information Requirements
From this chapter onwards the actual work done in SONAE will be presented. Similarly to what is advised in chapter 3, this process started with several information requirements.
Preceding the actual field-work, it is important to gather as much information as possible regarding the energy consumption in the factory, in order to pin-point the most relevant causes for the energy use. In a smaller facility this task would not be very complicated, but in such a complex unit, where constant improvements are done due to productive needs, it can be a very time-consuming and difficult procedure, especially because the changes performed are not always properly documented.
As such, the following chapter presents the information that was required for this project, in order to provide an information checklist for a new audit project to be performed in another industrial facility. For this particular project, all the data was acquired through archive research, factory surveying and contacting equipment suppliers.
4.1 - General Factory Information
For organizational and planning purposes, general information concerning the site in which the audit will be performed must be obtained. Table 4.1 summarizes this information:
Table 4.1 General Factory Information
Item Comment
Identification of the company The best practice would be for the audit team to provide a template where all the relevant information could be inserted.
20
4.2 - Energy Consumption
Historical data concerning the energy consumption of the facility allows for the auditors to assess the current energy consumption and the seasonable variation of consumption due to different productive behaviors (or maintenance periods). As an example, in this facility, SONAE Indústria Mangualde, the maintenance is usually done in August, and, as such, the energy consumed in that period does not reflect the normal behavior of the factory. Upon noticing this, through the analysis of the historical data, the schedule for the audit was changed. If this had not been identified, the project would have followed the initial plan and the information elicited would have been useless. Table 4.2 summarizes which items should be provided.
Table 4.2 Energy Consumption Information
4.3 - Productive Process
The particularities of the productive process impact both the conclusions of the audit and the fieldwork that should be performed. As such, information concerning the process should be provided. Simultaneously, to correctly interpret the energy receipts provided, it is important to also know the production volume, to relate the energy usage with the production needs. Table 4.3 summarizes the information requirements concerning this subject.
Table 4.3 Productive Process Information
Item Comment
Written consent to access energy consumption information of the energy provider
The best practice would be for the audit team to provide a document that would allow this action, upon being signed. Receipts of all forms of energy used in the
factory: electricity, propane, butane, diesel, etc.
Ideally, the receipts should refer to the last 3 years. If it is not possible, at least the receipts of the last 12 months should be provided.
Item Comment
Description and flow chart of the productive process
A summarized description of the productive process is important for the auditor team to gain an understanding of the particularities that impact the productive process
Monthly production volume
In order to better understand the energy consumption and to understand seasonal needs of the factory, a monthly production volume description is required.
21
4.4 - Motor Driven Systems
Motor-driven systems (Appendix B) are the most significant consumers in most industries; as such, information concerning this equipment is of unique importance. Since a facility such as the one analyzed can easily contain over two thousand motors, it is important that it possesses a centralized database listing all the equipment, allowing the access to motors’ data in a quick and precise way. Table 4.4 summarizes the information to be gathered concerning this matter and comments on how to do it.
Table 4.4 Motor Driven Systems Information
Item Comment
List of all the motors in the factory
Often this type of information is difficult to obtain due to the number of motors which easily ascend to over two thousand. That is one of the reasons why it is important to maintain an up-to-date database of equipment. In this particular case, such information was obtained through the consultation of the database and through factory surveying, which allowed to cross the information between the different sources, updating the database which is a valuable task in itself.
Technical information of the most relevant motors such has torque, rotation speed, power, current, existence of VSD and type of transmission.
Once again, this information is often difficult to gather. In this particular case, the criteria used for defining the most relevant motors were to consider motors with a power greater than 30kW. All the motors which fell under that category were surveyed.
4.5 - Artificial Lighting
Lighting systems offer easy ways to improve efficiency due to the constant developments in LED technologies and lighting control systems. Even though the consumption of such systems is often low when compared with other equipment, it should not be overlooked. On the following table, it is summarized the information requirements concerning the artificial lighting systems.
Table 4.5 Artificial Lightning Information
Item Comment
Factory survey depicting the layout of the lighting systems and its characteristics.
Changes in the factory, due to maintenance or malfunction, often mean that the information available is not up-to-date. This is particularly true for the lighting systems, since the activity of changing a lighting bulb when it stops working is not always documented, because it appears as such an insignificant task. Nonetheless, as those situations occur, after several years the information that is present in the database is very different from the reality. In this case, since the power consumption of such systems is relatively small, it was possible to work with the available information, even though it was not precise, but such situations should be avoided and updated databases of equipment should be kept.
Number of hours in which the illumination is turned on.
Frequently it is trivial for the employees of the factory to describe the usage of the lighting systems. If that is the case, this information should be provided has it allows to easily analyze the existence of energy waste. If not, this information should be gathered, taking into account the seasonable behavior that the illumination system might follow.
22
4.6 - Compressed Air Systems
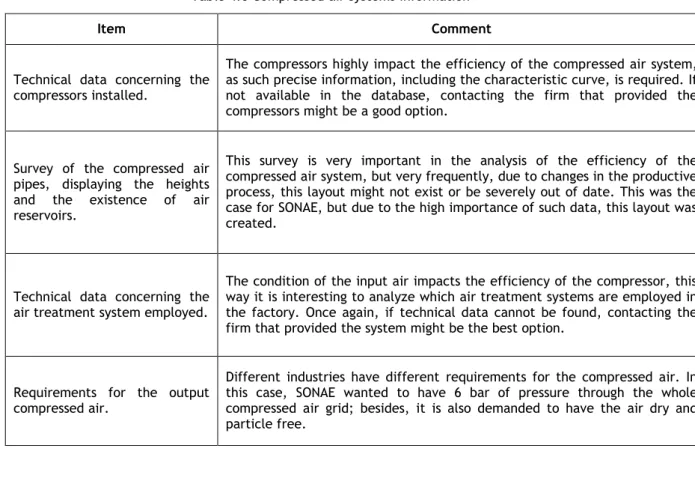
Compressed air (Appendix C) is used in such a transversal way in all industries that it is commonly seen as a fourth utility, after electricity, water and gas. If it were a utility it would be the most expensive of all: compressors offer relatively low efficiency, leakage in pipes is common and misuse on behalf of the staff is typical. As such, it is often an area in which efficiency improvement opportunities exist and thus data about this issue is valuable; Table 4.6 summarizes the most important items to provide and comments on them.
Table 4.6 Compressed air systems Information
Item Comment
Technical data concerning the compressors installed.
The compressors highly impact the efficiency of the compressed air system, as such precise information, including the characteristic curve, is required. If not available in the database, contacting the firm that provided the compressors might be a good option.
Survey of the compressed air pipes, displaying the heights and the existence of air reservoirs.
This survey is very important in the analysis of the efficiency of the compressed air system, but very frequently, due to changes in the productive process, this layout might not exist or be severely out of date. This was the case for SONAE, but due to the high importance of such data, this layout was created.
Technical data concerning the air treatment system employed.
The condition of the input air impacts the efficiency of the compressor, this way it is interesting to analyze which air treatment systems are employed in the factory. Once again, if technical data cannot be found, contacting the firm that provided the system might be the best option.
Requirements for the output compressed air.
Different industries have different requirements for the compressed air. In this case, SONAE wanted to have 6 bar of pressure through the whole compressed air grid; besides, it is also demanded to have the air dry and particle free.
4.7 - Air-Driven Transportation Systems
Pneumatic systems are widely used in industries, especially for transportation of material. Within these systems, there are several aspects which impact the efficiency, being one of the most relevant the impellers used: wrongly chosen geometries or sizes for the impeller lead to excessive consumption (Appendix D). As such, similar to what occurs with the compressed air systems, data on this matter is valuable; Table 4.7, on the next page, summarizes the information requirements and comments on them.
23
Table 4.7 Air-Driven Transportation Systems Information
Item Comment
Technical data concerning the ventilators installed.
There are very different sizes and shapes of ventilators, and the operational characteristics of the device highly impact the efficiency of the air-driven systems. As such, the operational curves of the ventilators are valuable information. Once again, if not available in the archive, contacting the company who supplied the ventilators might be a good option.
Survey of the air transportation pipes, displaying the heights and diameters.
Similar to what was commented concerning the survey of the compressed air pipes (4.6), this layout is important but is frequently out of date or inexistent. This was the case for SONAE, which decided to create the survey due to its importance for the project.
Information about the material transported.
The material to be transported affects the possible solutions for the pneumatic system. For example, the kind of impeller to be installed depends on what is being transported: some impellers might stall or quickly degrade due to the impact of the particles transported. As such, it is important to understand which material is going to be conveyed.
Number of hours in which the air-driven transportation systems are being used.
It is useful information in order to understand the power consumption such systems involve, and it is easily obtained by interviewing experienced staff.
4.8 - De-dusting Systems
De-dusting systems might not be present in all sorts of industry, and in some industries they might even be categorized under the air-driven transportation systems, since they are, in fact, air-driven transportation systems. Nonetheless, for the industry currently under discussion, these systems are of such importance that it is even important to distinguish them from other similar systems. Such importance is due to the particularities these systems present in terms of filtering needs, pipe layout, and efficiency improvement opportunities, which are very different from their similar, but different, air-driven systems. Table 4.8 summarizes the information that should be elicited concerning the de-dusting systems.
Table 4.8 De-dusting Systems Information
Item Comment
Technical data concerning the
ventilators installed. See Table 4.7 Survey of the de-dusting pipes,
displaying the heights and diameters.
See Table 4.7
Information about the material
transported. See Table 4.7 Number of hours in which the
de-dusting systems are being used.
See Table 4.7
Technical data concerning the filters.
The filters present in this system might not be the most adequate, which can lead to pressure or speed drops. As such, understanding their behavior is useful.
24
Item Comment
Type of maintenance performed
on the filters. The type of maintenance helps to characterize the filter and to understand if it is, in fact, the most adequate choice.
4.9 - Energy Management
Under this last topic - energy management - all remaining relevant information concerning the energy policies applied on the factory should be provided. Depending on the site in which the audit is taking place, this might comprise different items. Nonetheless Table 4.9 provides a short list of items that, if available, should be provided.
Table 4.9 Energy Management Information
Item Comment
Last energy audit. If available, the access to the last audit performed is valuable as it provides a unique way to acknowledge the energy consumption. List of energy management
practices.
Often, industries have internal policies concerning the practices to manage energy. If available, those should be provided.
Documentation concerning centralized energy management software.
Often, industries have centralized energy management software that aims at reducing the peak consumption and helps in the overview of the productive process. If that is the case, reports of the software should be provided.
Other
Other data, that the staff feels can help the auditors, should also be provided, even if not requested. This might include spreadsheets with analyzed information concerning the energy consumption, “rules of thumb” applied in the factory due to empirical needs, regulation concerning minimum and maximum energy consumption agreed with the energy provider, amongst other.
4.10 - Additional Best-practices
The information provided directly impacts the quality of the energy audit, since it shapes the approach the audit team will take and, consequently, their findings. It can be seen as one of the most critical points.
Often it involves a very high workload for the factory staff, which might lead to an overload of work and thus a poor information gathering. From my experience, having external staff go into the factory and gathering all this information is the best choice because it assures the existence of additional human means to help, preventing the high workload. Furthermore, having an external employee whose sole task is to help in the audit, leads the information gathering effort in a more efficient way as this employee will always judge the information gathered according to its purpose, while, on the other hand, a factory worker who is not fully aware of the purpose and importance of the information, might not disclose important details.
Concerning the actual work done in SONAE, it was accomplished through archive research, factory surveying, contacting providers, and staff interview. In the end, all the previously mentioned items were given an answered, which proved very valuable to the audit team.
25
Chapter 5
Defining Metering Points
As stated before, an energy audit requires monitoring the energy consumptions to understand the energy behavior and to define measures to improve it. As Robert Kaplan, the founder of the strategic performance tool BSC, said in regard to quality: “If you can’t measure it, you can’t manage it”. The same applies for the energy consumption. Since it would not be feasible to measure the consumption of every single device, there is a need to define which points are the most relevant to monitor, both in terms of electrical energy and thermal energy. The information gathered in the previous chapter is of great importance for that, although it is not enough: a responsible auditor must observe the facility and interview the staff to understand the particularities of the process and to gain a more detailed perspective of the electrical and thermal circuits.
5.1 - Initial Factory Overview
Such a task begins with a meeting with all the stakeholders, which should include factory staff, who will accompany the auditors clearing their doubts and empathizing relevant productive process particularities; senior management, who will manage the overall development of the project according to the company expectations; and the auditors themselves. During the meeting, a schedule should be provided for this work, alongside with resources that might be required - such as special protection equipment or access to, otherwise, restricted areas. According to the experience of the auditors in this project, a typical schedule for such a task, in a complex industrial facility, is of 4 days, but keeping a full working week available for such task is advised as the density of the task might lead to delays or to the need of further studies. As an example, the schedule followed in this project is present in the Table 5.1.
26
Table 5.1 Example of a schedule for preliminary fieldwork
Days Actions
Day 1
Preliminary meeting, culminating in detailed week planning and resource requirements; (~1 morning)
General view of the productive process and all factory sectors; (~1 afternoon)
Day 2
Identification of the thermal-fluid network, taking into account the pumping motors used and their characteristics;
Identification of the water pumping systems;
Identification of the de-dusting systems network, noticing the motors used and their characteristics;
Identification of the air-driven systems network, noticing the type of impellers used and how they are controlled;
Day 3
Identification of the compressed air systems network, noticing how the compressors are controlled;
Identification of the steam systems, including the pipeline trails and how the production is controlled;
Identification of exhaust gas uses and pipelines;
Day 4
Detailed analysis of the electrical circuits, understanding exactly where each equipment is connected;
Identification of the monitoring points currently installed in the facility and the characteristics of the meters;
Day 5
Interviews with senior factory staff to answer any doubts that might have arose during the development of the actions;
Final meeting where the auditor team shares with senior management some preliminary ideas about the next steps and agrees on a date for the delivery of the report stating which points to monitor.
During the whole 5 days, there are several aspects of which the auditors should take special notice, such has:
Temperature losses and possible process re-arrangements, which would allow for a better utilization of the thermal energy;
Process control software, specially VSD control and possible changes concerning the variables acting as input to the software (for example: using temperature instead of pressure as an input);
Impellers used in the ventilation systems, and their characteristics;
The efficiency level of the motors present.
This way, at a very initial stage, it is possible for the auditors to shape a strategy into where the biggest energy saving opportunities might be, and present those initial findings to the senior management, in a way that the whole team can collaborate and manage each other’s expectations so that the final outcome is exceptional for both parties.
27
5.2 - Conclusions of the Initial Factory Overview
After the conclusion of this first contact with the factory, the auditors are able to identify, at a very initial stage, potential measures to implement, and provide a document, to the management where they detail their findings. When comparing this method to the more traditional way of developing audits: defining the points to monitor the consumption and, immediately implement the meters, one can notice that this method offers some advantages and disadvantages. On one hand, it’s a more expensive procedure, it is more time consuming and requires more dislocations to the factory. On the other hand, it allows for a more detailed planning and to take into account very small details that could, otherwise, be overlooked. Overall, taking into account that the expectation for this project is to determine the smallest details in terms of energy efficiency, it is easy to realize that this method, even with its drawbacks, is strongly advised.
Such was the option in this project: at the end of this stage, the auditors submitted a report to the company to plan what they wanted to monitor, motivating their choice, assuring the approval of all the stakeholders.
5.3 - Implementation of the Meters
Upon having a detailed plan of actions, agreed by all the parties, the actual fieldwork of implementing the meters becomes relatively simple. Nonetheless, a few issues affect the quality of this task. Listed below are several guidelines for a successful implementation of the meters:
Follow the project-plan strictly, both concerning the location of the equipment and the equipment itself, documenting any unforeseen changes that might arise;
Follow the security measures presently applied to the company: often the implementation of the meters carries the danger of electrocution or severe burn.
Use meters which have an acceptable error margin for what they are measuring;
Once the implementation is concluded, the consumption will be monitored during a period which is representative of the load diagram of the equipment. As an example, concerning the project for SONAE Indústria, that period is of 3 months.
28
29
Chapter 6
Measures for Energy Efficient Operations
This chapter details the most relevant measures for increasing the energy efficiency of the operations. Framing this chapter in the overall process, the general audit process includes the following stages: Information gathering
Fieldwork to assess strategic metering points
Meter installation
Data gathering
Data analysis
Decision about electrical efficiency measures
As such, taking into account that the industry specific data cannot be published due to the confidentiality agreement with SONAE, this next chapter will focus on the decisions about energy efficiency measures. Even though the real data analysis will not be presented, it is useful for the reader to understand how the data was evaluated. Therefore, follows a short overview concerning the features the auditors paid special attention:
Discovery of energy losses in the transportation of thermal fluids, such as vapor, hot gas or thermal-oil: such losses might comprise huge efficiency improvement opportunities, since improving the thermal isolation of the pipes appropriately or reducing the path of fluids through valves, are simple and cheap measures with high energy gains.
Detection of situations of no-load electrical operation which can be reduced through better equipment control: situations of equipment operation when there is no actual load are common in facilities with a continuous work flow, such as SONAE, since it is easier to maintain a device continuously operating, than to devise a strategy to turn it off when appropriate. Nonetheless, in equipment with high power consumption, this situation leads to very high energy waste, and increased maintenance needs, and is an aspect which can be easily overcome with suitable control means.
Finding over/under dimensioned equipment, which leads to poor efficiency: the motors that are currently employed in the factory usual work more efficiently when in a range of 75% to 100% load [10], but often the motors are working bellow that range
30
to anticipate higher load demands due to productive changes and to reduce maintenance requirements (over-dimensioned motors require less maintenance and have a higher life span). Nonetheless, once again, this faulty choice of the equipment leads to huge energy losses, which can be easily compensated with the insertion of variable speed drives or motor substitution.
Discovery of non-useful operation of equipment: often, in such large facilities, faulty utilization of factory equipment occurs, since the staff is not always aware of the impact of their behavior. Situations such as un-justified use of compressed air, excessive levels of illumination or continuous use of air conditioner equipment is something easy to change which impacts the consumption.
Keeping the above mentioned factors in mind, and using other criteria that are more specific for the MDF industry, it was possible to formulate several potential measures to implement. These measures were weighted with a cost-benefit analysis, which had mainly two concerns:
The investment would effectively be pay-off within a maximum period of 10 years, and ideally within a period of 5 or less years.
The measure would not cause any, or would cause little, disruption on the productive process of the factory.
It is important to notice that in such an analysis, not all benefits are easy to assess due to their nature. For example, it is not easy to access the value of having less thermal losses, since the thermal energy occurs as a “side-effect” of the cogeneration plant in the factory: through the incineration of biomass in the cogeneration plant, thermal energy occurs as a “side-effect” of the production of electricity; as such, since the policy is to always produce the maximum amount of electrical energy, thermal energy is readily available, and reducing its losses might be, or not be, relevant, depending on in which sector it occurs. And when it is relevant, its value is difficult to objectively assess its value. The same happens to the costs, for example, it is not easy to access the value of having the production stopped for several hours to change equipment. As such, part of what is difficult about such a project is making decisions with imperfect and incomplete information. To overcome this issue and to develop a successful project, it is greatly significant that, when deciding upon the efficiency improvement measures, all the stakeholders of the project - auditors, factory staff and senior management - meet to discuss each particular measure in opposition to having it decided only by the senior management, which have a better global view of the installation but lack the detailed operations sensibility that the factories staff can offer.
At the time of delivery of this thesis, the measures that will be subsequently presented were still being discussed by SONAE’s management, and it was still not clear which ones would be implemented. Nonetheless the measures presented in the next sections are considered by all the stakeholders as the most feasible, and will be now motivated under a theoretical point-of-view with enough information for the reader to understand why these procedures are relevant.


![Figure 2.3 Flowchart of the MDF productive process [6]](https://thumb-eu.123doks.com/thumbv2/123dok_br/16046606.1105369/23.1785.230.1541.158.965/figure-flowchart-mdf-productive-process.webp)
![Figure 2.4 Energy consumption split into the different sources [13]](https://thumb-eu.123doks.com/thumbv2/123dok_br/16046606.1105369/25.892.171.760.794.1063/figure-energy-consumption-split-different-sources.webp)
![Figure 3.2 Flowchart concerning the activities of an energy audit [8]](https://thumb-eu.123doks.com/thumbv2/123dok_br/16046606.1105369/30.892.149.708.225.907/figure-flowchart-concerning-activities-energy-audit.webp)