Environmental Disclosure Determinants in Dutch Listed Companies
Dion van de Burgwal Auditor, Ernst & Young
E-mail: [email protected]
Rui José Oliveira Vieira
Ph.D., Assistant Professor, Amsterdam Business School, Universiteit van Amsterdam E-mail: [email protected]
Received on 3.14.2013- Desk acceptance on 3.22.2013- 3rd. version approved on 2.11.2014
ABSTRACT
Previous studies have already reported mixed results on the relationship between corporate environmental disclosures and environmental performance. The purpose of this paper is to identify variables that impact significantly the level of environmental disclosure practices provided by Dutch listed firms. A content analysis scorecard is used to test the mentioned level. The scorecard is based on the Global Reporting Initiative sustainability reporting guidelines, developed by Clarkson, Li, Richardson, and Vasvari (2008) in collaboration with an environmental disclosure expert. It is one of the first studies that have applied this comprehensive scorecard. This method is valuable to users who seek to assess the firms’ true environmental exposure. Furthermore, there are no published studies that examine variables in which it is possible to find a significant impact on the disclosure practices of Dutch companies. The environmental information for 2008 was collected from a sample of 28 Dutch listed companies, which ones represent 90% of the total market capitalization on the Dutch stock exchange, and the selected variables that could affect the level of environmental disclosure are firm size, industry membership and firm profitability. The statistical tests proved that firm size and industry membership are significantly and positively associated with the level of environmental disclosure. This result is consistent with prior research that has used other measures of environmental disclosure. However, profitability is not statistically significant related to the level of environmental disclosure. This may be due to the impact of the financial crisis that has arisen in 2007/2008.
1 INTRODUCTION
Societal awareness and concerns for the environmental impact of businesses have arisen to increase in about four decades ago. At this time, questions about issues affecting the natural environment were raised. According to Gamble, Hsu, Jackson, and Tollerson (1996), these issues include, in addition, movement of waste, emissions, protection of the ozone layer, toxic waste destruction, and climate change. Al-though the criticisms on the harmful environmental impact of organizations slightly faded in the 1980s, the 1990s repre-sent a new focus of attention for this topic (Kolk, 2003). This renewed attention for the natural environment has not been isolated in a particular region or culture, but it has drawn global attention (Gamble, Hsu, Jackson, & Tollerson, 1996).
The trend in environmental awareness has led to a growing demand for environmental accountability by organizations. The corporate social responsibility (CSR) is a policy of an organization that identifies the concerns with society-related issues as: the environment, human resources, community involvement, and product safety (Roberts, 1992). Providing social or environmental dis-closure is a method to explain CSR policies and to take responsibilities for ethical, social and environmental actions (Adams, 2004; Brammer & Pavelin, 2006). Sin-ce the mid-1990s, attention for environmental accoun-ting related research has been increased. A popular field of research is related to the corporate and the country specific determinants of environmental disclosure (Bar-tiaux, 2008; Bassetto, 2010; Beck, Campbell, & Shrives, 2010; Buhr, 1998; Burritt & Welch, 1997; Christ & Bur-ritt, 2013; Clarkson, Li, Richardson, & Vasvari, 2011; Cormier & Magnan, 2003; Cowen, Ferreri, & Parker, 1987; Deegan & Gordon, 1996; Dong, Ishikawa, Liu, & Hamori, 2011; Erlandsson & Tillman, 2009; Hackston & Milne, 1996; Harte & Owen, 1991; Kolk & Perego, 2010; Murray, Sinclair, Power, & Gray, 2006; Roberts, C. B., 1991; Roberts, R. W., 1992; Rosa, Ensslin, Ensslin, & Lunkes, 2012; Silva Monteiro & Aibar-Guzmán, 2010; Tilt & Symes, 1999; Trierweiller, Peixe, Tezza, Bornia, & Campos, 2012).
This study differs from comparable studies on three aspects. First, it examines the environmental disclosure determinants in the Netherlands. Most of the studies re-garding corporate techniques of environmental disclo-sure are focused on Anglo-Saxon countries (Gray, Kou-hy, & Lavers, 1995). Roberts (1991) states that Europe is especially interesting for research in environmental disclosure practices because it is the home of many ac-tive environmental groups, different types of accoun-ting information systems are used there and the cultural attitudes towards social disclosure differ from others. Therefore, it is expected that the level of environmen-tal disclosures will vary significantly across European countries (Gamble et al., 1996).
Second, prior empirical research is mainly focused upon the largest companies and industries identified as
environmental polluting (Brammer & Pavelin, 2006). Another comparative advantage of this study is that in the sample both large and small firms (although lis-ted) and both non-environmental and environmental polluting industries are included. As a result, this study is able to compare differences in environmental dis-closure between larger and smaller firms and between more environmental polluting and less environmental polluting companies.
Third, this study differs from comparable studies on an important aspect, the measurement of environmen-tal disclosure level. Other research has measured the level of disclosure by counting, for example, the num-ber of words, sentences or pages in the annual report. After this, the relation between specific variables and the amount of disclosures are tested (Deegan & Gor-don, 1996; Gray et al., 1995; Guthrie & Parker, 1989; Hackston & Milne, 1996; Milne & Adler, 1999; Neu, Warsame, & Pedwell, 1998; Patten, 2002). Applying this measurement tool, questions can be raised because environmental disclosure will differ across companies due to variation in writing style, page and type size (Brammer & Pavelin, 2006; Hackston & Milne, 1996). In addition, there is not a straightforward relation be-tween the amount or the length of disclosure and the level of environmental disclosure. It is more interesting to examine measures of quality.
The purpose of this paper is to identify whether specific environmental actions are disclosed, whether the environmental impact of an organization is quan-tified and whether environmental targets are achieved (Brammer & Pavelin, 2006). Content analysis is the research method, which is used to identify whether the above issues are included in the environmental report (cf. Beck et al., 2010). Therefore, it is an im-proved tool to measure the level of environmental dis-closure compared to counting the words or sentences. In other words, the scope, depth and length of envi-ronmental disclosure, is evaluated. This research is employing the content analysis scorecard, developed by Clarkson et al. (2008) in collaboration with an en-vironmental disclosure expert. The authors state that the scorecard “is valuable to users who seek to assess the firms’ true environmental commitment and rela-ted environmental exposures” (Clarkson, Li, Richard-son, & Vasvari, 2008, p.305). Ribeiro, Van Bellen, and Carvalho (2011) claim that this scorecard based on Global Reporting Initiative (GRI) is comprehensive and very complete.
2 LITERATURE REVIEW
2.1 Definitions and Context.
The aim of this research is to test the influence of selected variables on the level of environmental disclosure by using the Clarkson et al. (2008) scorecard, which is highly valu-able to assess the firm’s true environmental commitment. This research’s analyzed data is a sample of Dutch firms. In order to examine the relationships between potential deter-minants and environmental disclosure, the data is impor-tant to realize a clear definition of environmental disclosu-re. It can be defined as the provision of public and private information, financial and non-financial information, and quantitative and non-quantitative information regarding to the organization’s management of environmental issues. This information is provided in the annual report or in any other form, mostly of the time a separate environmental report is issued (Gray et al., 1995). This separate environ-mental report is often referred to a CSR report. Helpful is the World Business Council for Sustainable Development in which is provided this definition of CSR reports (World Business Council for Sustainable Development [WBCSD], 2002, p.7):
(…) public reports by companies to provide internal and external stakeholders with a picture of corporate position and activities on economic, environmental and social di-mensions. In short, such reports attempt to describe the company’s contribution toward sustainable development. KPMG (2008) has performed an international survey of corporate social reporting on the 100 largest companies by revenue from a sample of 2200 firms in 22 countries. They concluded that, nowadays, environmental reporting is widely adopted by organizations, as the 80 percent of the world’s largest companies issues stand-alone CSR reports: “The question is no longer ‘Who is reporting?’ but ‘Who is not?’ Corporate responsibility reporting is now a mainstre-am expectation of companies” (KPMG, 2008, p. 14).
A research shows that more and more organizations decide to report environmental information to their stakeholders. In the early 1990s, Roberts (1991) concluded that, despite the majority of the companies in France, Ger-many, the Netherlands, Sweden and Switzerland disclose environmental information, the level of this information is low. Nevertheless, a study performed by Kolk (2003) to the 250 largest Fortune 500 companies (this data repre-sents companies from France, Germany, Italy, Japan, the Netherlands, South Korea, Switzerland, the UK and the US) during the years 1998 to 2001, concluded that sustai-nability reporting has increased considerably within those countries. The author also concluded that environmental reporting is applied more in the industrial sectors than in the financial sectors. The level of environmental disclosure
is also depending on country specific legislation and the re-porting culture of the country. The companies make more environmental disclosures in such regulated countries, es-pecially in the USA, Canada and the UK either because en-vironmental reporting is mandatory or because society or stakeholders demand reporting (Gray et al., 1995; Hacks-ton & Milne, 1996). Besides the mandatory requirements to disclose environmental information, there are a variety of reasons why organizations decide to, voluntarily, disclo-se this information.
A list of motivations for managers to provide environ-mental information is mentioned by Deegan (2002): 1) to believe in an accountability or responsibility to report, 2) to desire to comply the borrowing requirements, 3) to comply the community expectations, as a result of certain threats to the organization’s legitimacy, 4) to manage particular stakeholders, 5) to attract investment funds, 6) to comply the industry requirements, 7) to forestall efforts to introdu-ce more onerous disclosure regulations, 8) to win particu-lar reporting awards, among others.
In the accounting literature, an extensive research has been conducted in which the presence, quantity, quality and usefulness of environmental disclosure are examined (Belkaoui, 1976; Brammer & Pavelin, 2006; Campbell, Craven, & Shrives, 2003; Cho & Patten, 2007; Cormier & Magnan, 2003; Cowen et al., 1987; Deegan & Gordon, 1996; Gray et al., 1995; Hackston & Milne, 1996; Ingram, 1978; Kolk, 2003; Neu et al., 1998; Patten, 1992, 2002; Ro-berts, 1992; Shane & Spicer, 1983; Silva Monteiro & Aibar-Guzmán, 2010; Trotman & Bradley, 1981). The results have been mixed, however, researches investigating environ-mental disclosures practices and its quality performed in the 1980s and in the early 1990s concluded that the qua-lity of environmental disclosure is poor and that there is a lack of consistent disclosure techniques (Gamble et al., 1996). Nevertheless, the quality of the environmental re-porting seems to have increased during the 1990s. Cormier and Magnan (2003) state that firms in most of the Europe-an countries are expEurope-anding the quEurope-antity Europe-and the quality of their environmental disclosure.
2.2 Environmental Reporting in the
Netherlands.
The country level variables explain the level of environ-mental disclosure (Roberts, 1991). In contrast to the un-derstanding of environmental disclosure in Anglo-Saxon countries, the environmental disclosure determinants in continental Europe are rather unknown (Cormier & Mag-nan, 2003). This research is an attempt to extend the scope of knowledge about the country specific determinants of The fourth section contains the research
methodolo-gy, including a description of the sample selection, the measurement of the variables and the data collection. In the fifth section, the results of the study will be
environmental disclosure by examining the environmental disclosure determinants in the Netherlands.
Only little empirical researches have been conducted about environmental reporting in the Netherlands. The Dutch consultancy firm DHV (2001) examined repor-ting practices and questioned firms operarepor-ting in the Ne-therlands. DHV states that corporate social responsibility is becoming more important in the Netherlands, because, in general, the number of firms reporting has been deve-loping positively. On the other hand, they found out that, in the period from 1998 to 2000, there was an opposite or reluctant development in sustainability reporting. Firms stopped their reporting because of the costs and the non-stimulating, non-interested stakeholders. Akzo Nobel, for instance, stopped reporting because of its high costs and the stakeholders were not interested in such reports. Shell decreased their reporting practice in 2000 in comparison to 1999 for the same reasons.
The Dutch government builds on the self-regulating and disciplining functioning of businesses and, there-fore, there are no mandatory legislations or rule-based standards (Ministry of Economic Affairs, 2008). In 2000, the government has requested recommendations to the Social-Economic Council (Sociaal-Economische Raad) about CSR and the role of the Dutch government, business community and Non-governmental organiza-tions (NGOs). The recommendaorganiza-tions were published in ‘De winst van waarden’ [the profit of values] (Sociaal-Economische Raad [SER], 2000). The Social-Economic Council advocates enhanced transparency of CSR by in-creasing economic, social and environmental reporting. To make it possible, a conceptual framework for me-dium and large organizations was prepared by the Dutch Accounting Standards Board (Raad voor de Jaarverslag-geving), upon the Dutch government instructions. This framework, based on the guidelines for sustainability reporting developed by the GRI, stimulates the CSR re-ports consistency, transparency and verifiability (Raad voor de Jaarverslaggeving, 2003).
2.3 Environmental Performance Determinants.
Examining environmental performance determi-nants has been a popular field of study (Christ & Bur-ritt, 2013; Cormier & Magnan, 2003; Cowen et al., 1987; Deegan & Gordon, 1996; Erlandsson & Tillman, 2009; Hackston & Milne, 1996; Liu & Anbumozhi, 2009; Roberts, C.B., 1991; Roberts, R. W., 1992; Silva Monteiro & Aibar-Guzmán, 2010; Trotman & Brad-ley, 1981). These studies have examined the effect of several variables like: firm size, profitability, industry, country of firm ownership, country of reporting, leve-rage, capital intensity, company age, the existence of a CSR committee, stakeholder power and governmental influences (Hackston & Milne, 1996; Roberts, 1992). Three frequently studied determinants are corporate size, industry and corporate profitability. There is no existing empirical knowledge about the effect of these variables on environmental disclosure. Therefore, this
study will also examine the relationship between these determinants and environmental disclosure in order to compare the results with the existing accounting litera-ture. In the following part, the current state of know-ledge on each determinant will be described.
2.3.1 Corporate size.
The majority of the empirical studies has found sig-nificant evidence that there is a positive relation between company size and the level of social and environmental disclosure (Brammer & Pavelin, 2006, 2008; Cormier & Magnan, 2003; Cowen et al., 1987; Gray et al., 1995; Ha-ckston & Milne, 1996; Kolk, 2003; Patten, 1992, 2002; Sil-va Monteiro & Aibar-Guzmán, 2010; Trotman & Bradley, 1981; Zeng, Hu, Yin, & Tam, 2012). This positive relation assumption is based on the fact that, in general, larger companies participate in a higher number of businesses and are operating on an international scale. These acti-vities have a greater impact on the natural environment and, consequently, on society. Also, larger companies have to satisfy a higher number of stakeholders who might be interested in environmental management and initiatives undertaken by the company. Therefore, these compa-nies experience higher social and regulatory pressures to disclose environmental information than smaller firms (Brammer & Pavelin, 2006; Cowen et al., 1987; Deegan & Gordon, 1996; Hackston & Milne, 1996; Silva Monteiro & Aibar-Guzmán, 2010).
Furthermore, the environmental disclosure process is costly and the larger companies are more likely to be able, in contrast to medium and small sized companies, to spend resources to prepare and disclose environmental informa-tion (Silva Monteiro & Aibar-Guzmán, 2010). The last as-sumption, suggested by Wong and Fryxell (2004), underlies this positive relationship. The authors state that especially larger firms are becoming aware of the importance of buil-ding and maintaining a good corporate reputation and tho-se firms try to disclotho-se its environmental information to safeguard or expand this reputation. In addition, Brammer and Pavelin (2006) think also that larger companies are making significantly higher quality disclosures than smal-ler firms. However, other studies did not find a positive re-lationship between firm size and environmental disclosure (Roberts, 1992; Toms, 2002; Wagner, Phu, Azomahou, & Wehrmeyer, 2002).
2.3.2 Industry.
A generally accepted assumption is that a relationship between the industry in which a firm is operating and its environmental disclosures exists The general expectation is that companies in, so-called, high profile (or tal sensitive) industries will disclose more environmen-tal information than companies in low-profile industries (Brammer & Pavelin, 2006, 2008; Campbell et al., 2003; Cho & Patten, 2007; Deegan & Gordon, 1996; Hackston & Milne, 1996; Roberts, 1992; Zeng et al., 2012).
envi-ronmental sensitive industries have to comply with strict environmental regulations due to the polluting characteristics of their activities (Silva Monteiro & Aibar-Guzmán, 2010). Therefore, firms operating in these sensitive industries should disclose their envi-ronmental concerns, otherwise stakeholders and es-pecially investors will assume the worst (Cormier & Magnan, 2003; Clarkson et al., 2008; Cho & Patten, 2007; Hackston & Milne, 1996).
Second, environmental sensitive industries face gre-ater societal pressure because they are more likely to be associated with visible environmental concerns, like the greenhouse gas emission and the risk of environmen-tal disasters (Brammer & Pavelin, 2006; Silva Monteiro & Aibar-Guzmán, 2010). As a result, if environmental sensitive firms do not disclose sufficient environmental information, it can unleash disturbing reactions among environmental pressure groups and governments. Ulti-mately, society will turn against those companies. The-refore, companies that operate in environmentally sen-sitive industries tend to disclose more environmental information (Cho & Patten, 2007; Clarkson et al., 2008; Deegan & Gordon, 1996; Hackston & Milne, 1996).
Several studies actually find a relationship between industry and environmental disclosure, although the industries classification differs among them. Hackston and Milne (1996), Patten (1991) and Roberts (1992) re-ached a consensus that high-profile industry companies disclose significantly more environmental information than companies from low-profile industries. High-pro-file industries are for example the oil, chemical, metal, utility, airline, paper and water sectors (Cho & Patten, 2007; Clarkson et al., 2008; Hackston & Milne, 1996; Patten, 1991; Roberts, 1992).
Kolk (2003) concluded that environmental reporting is much more common in industrial sectors, compared to the financial sector. Silva Monteiro and Aibar-Guzmán (2010) state that industry membership is positively and significant correlated with environmental disclosure, in the Portu-guese context. Furthermore, Brammer and Pavelin (2006)
postulate that firms in the chemicals, resource extraction and utilities sectors provide significantly higher quality of environmental disclosure and firms in the high technology and finance sectors disclose a significantly lower quality of environmental information.
2.3.3 Proitability.
The third variable that will be tested in this study is the relationship between environmental disclosure and corpo-rate profitability. It can be expected that there is a positi-ve relationship between profitability and environmental disclosure. This expectation is based on the thought, best described by Brammer and Pavelin (2006, p.1174), that: “profits provide managers with a pool of resources from which the costs of making environmental disclosures are funded.” Furthermore, if management is disclosing their environmental activities and performance, it is demons-trating to its stakeholder that the company can meet and respond to social demands. In other words, management is undertaking long-term strategic planning which is needed to survive (Cowen et al., 1987).
However, studies that have determined the relationship between profitability and environmental disclosure provi-ded mixed results. Whereas some of the studies conclude that there is a positive relationship between profitability and environmental disclosure (Al-Tuwaijri, Christensen, & Hughes, 2004; Clarkson et al., 2011; Ingram, 1978; Neu et al., 1998), other studies have failed to find a signifi-cant relationship between these two variables (Brammer & Pavelin, 2006, 2008; Cowen et al., 1987; Freedman & Jaggi, 1982; Hackston & Milne, 1996; Patten, 1991; Silva Monteiro & Aibar-Guzmán, 2010; Zheng et al., 2012). Furthermore, some studies find a positive, but temporary, relationship between profitability and environmental dis-closure (Belkaoui, 1976; Shane & Spicer, 1983), and Ro-berts (1992) has found evidence of a positive relationship between lagged profits and environmental disclosure. This is in line with Ullmann’s argument (1985), in which is said that profit should be necessary before a company devotes its resources to meet stakeholder demands.
3 THEORY AND HYPOTHESES
The objective of this research is to test the influence of selected variables on the level of environmental dis-closure. For this study, three variables that have been used to explain the environmental disclosure are selec-ted. The variables are corporate size, industry and pro-fitability. For each variable, a hypothesis based on the existing knowledge and theory will be formulated. The-refore, firstly, it will be given an overview of the environ-mental disclosure theory.
3.1 Theoretical Framework.
In former research, it is approached different the-ories, which can explain the effect of the specific va-riables on the provided environmental disclosure.
Obviously, the theoretical underpinnings differ (Silva Monteiro & Aibar-Guzmán, 2010). The theories inclu-ded in the majority of the studies in CSR reporting are the legitimacy theory (Aerts & Cormier, 2009; Brown & Deegan, 1998; Campbell et al., 2003; Cho & Patten, 2007; Deegan, 2002; Deegan, Rankin, & Tobin, 2002; Deegan & Gordon, 1996; Neu et al., 1998; O’Donovan, 2002; Patten, 1992, 2002), the stakeholder theory (De-egan & Blomquist, 2006; Roberts, 1992) and the volun-tary disclosure theory (Brammer & Pavelin, 2006; Cla-rkson et al., 2008; Verrecchia, 1983).
3.1.1 Legitimacy theory.
used to explain environmental disclosure. According to Cho and Patten (2007), the legitimacy theory im-plies that environmental disclosure is a function of the intensity of societal and political pressure faced by a company regarding the environmental performance. As a reaction on this pressure, firms try to provide more environmental information.
Organizations strive for a balance between organi-zational values and societal values. When it is achie-ved, there is a, so-called, social contract between the organization and the society. If the society observes that the organization fails to operate as the social con-tract, the societal values are not in accordance with the organizational values, so there will be a negative so-cietal opinion about this organization (Milne & Patten, 2002). Such a negative opinion might be a threat to the organization’s going concern. When the organization is operating in such a manner that does not satisfy the society, it will break the organization’s social contract. The societal reaction will be, for example, reduced de-mand by consumers for the products or services from the organization, and suppliers will limit the supply of resources to the firm (Deegan, 2002). A broken social contract is referred to as a legitimacy gap. In respon-se to this gap, organizations will do the best they can to repair or compensate the broken contract (Deegan, 2002). For example, companies try to repair the con-tract by providing positive environmental disclosure (Milne & Patten, 2002; Patten, 1992).
3.1.2 Stakeholder theory.
The stakeholder theory is highly interrelated with the legitimacy theory. Whereas the legitimacy theory focuses on communication with society, the stakehol-der theory focuses on the communication with diffe-rent stakeholder groups. According to the stakeholder theory, society consists of various stakeholder groups. Those groups have unequal power to influence the ac-tivities of an organization, but all groups are concerned with the environmental performance of the company (Roberts, 1992). The going concern of an organization requires the stakeholders’ support and therefore the corporate activities should be adjusted to the stakehol-ders’ demands. The more power stakeholders have, the more a company must adjust its activities to stakehol-ders’ demands (Gray et al., 1995), because stakeholders have the ability to control resources that are critical for the activities of an organization (Ullmann, 1985). Roberts (1992) observes that disclosure is part of the dialogue between the company and its stakeholders for negotiating the social contracts.
Legitimacy and stakeholder theory are closely rela-ted and should not be considered competing but in a broader sense as complementing each other (Deegan, 2002; O'Donovan, 2002). Motivations for stakeholder’s involvement is an item that have been studied by Ber-man, Wicks, Kotha, and Jones (1999), they have argued
that the intrinsic stakeholder’s commitment – to do what is the right thing to these stakeholders – plays no significant role. The main reason why companies enga-ge in stakeholder’s involvement relates to the bottom-line number, that is, profitability.
3.1.3 Voluntary disclosure theory.
The legitimacy theory and stakeholder theory might be useful in explaining ‘what’ an organization disclosed, but it might not be useful in explaining ‘how much’ is dis-closed (Clarkson et al., 2008). Therefore, a supplementa-ry theosupplementa-ry is used in the literature, which can explain the level of disclosure practices. Voluntary disclosure theory is based on the agency theory perspective. According to Brammer and Pavelin (2006, p.1171): “Voluntary disclo-sures are attempts to remove informational asymmetries between the firm and external agents, primarily agents in the investment community.” The voluntary disclosure theory predicts that organizations, which have a good environmental performance, do not hide the environ-mental impact of their operations and are willingly to inform stakeholders about their environmental activi-ties. Voluntary disclosure predicts that the information risk for current and potential investors will be lowered (Brammer & Pavelin, 2006).
First, voluntary disclosure can lead to a competiti-ve advantage because it highlights the environmental programs and the impact of activities on the natural environment. Second, stakeholders receive bad news from the company along with good news. Investments in environmental management or programs are costly and, for the short term, they will not result in higher returns. If disclosure is absent or low, stakeholders will assume that the current environmental strategy adopted by the firm is inferior (Clarkson et al., 2008; Verrecchia, 1983). Superior environmental performers truly disclose issues regarding environmental affairs, the quality of their disclosures is superior to the quali-ty of the weak environmental performers. The superior firms believe that their strengths will outweigh the we-aknesses and do not fear the reaction of any stakehol-der (Clarkson et al., 2008).
3.2 Hypotheses Development.
3.2.1 Impact of size.
com-pany. Larger organizations have more stakeholders and therefore they are more likely to satisfy their stakehol-ders, in order to keep they operating.
Hypothesis 1 – There is a positive relationship between the size of a company and the level of environmental dis-closure.
3.2.2 Impact of industry.
A positive association between the business nature of the organization and the environmental disclosure can be expec-ted (Brammer & Pavelin 2006, 2008; Campbell et al., 2003; Cho & Patten, 2007; Deegan & Gordon, 1996; Hackston & Milne, 1996; Roberts, 1992; Zeng et al. 2012). It is consistent with the legitimacy and stakeholder theory which state that some industries are considered to feel greater pressure from society or certain stakeholders, to provide environmental information and thus they are more likely to disclose this information to avoid a legitimacy gap between the society and the corporate operations (Deegan, 2002). Therefore, it is expected that firms that operate in a high profile industry reach a higher level of environmental disclosure than firms that operate in a low-profile industry.
Hypothesis 2 – There is a higher level of environmental disclosure provided by firms operating in a high-profile
in-dustry than by firms operating in a low-profile inin-dustry.
3.2.3 Impact of proitability.
Given the inconsistent results for the relation betwe-en economic performance and betwe-environmbetwe-ental disclosure as described in the literature review, a null hypothesis is formulated to test the association between profitability and environmental disclosure.
Hypothesis 3 – There is no relationship between the economic performance of a company and the level of envi-ronmental disclosure.
The notion of profitability seems consistently with voluntary disclosure theory, as the means to convey in-formation to outside investors is perceived as a vehicle to gain a competitive advantage. The idea underlying this theory is that companies can use voluntary envi-ronmental disclosure to signal that they have intangi-ble assets (such as legitimacy or superior environmen-tal performance advantages), which will help them to secure future profits. A rejection of this hypothesis will assume that economic performance or profitability is associated with environmental disclosure and the sign of correlation will point out whether it is a positive or negative relationship (Freedman & Jaggi, 1988).
4 RESEARCH DESIGN
4.1 Sample.
In order to perform the research, the largest 30 com-panies listed on the Amsterdam Euronext Index, on December 31st, 2008, were selected. This size ranking is
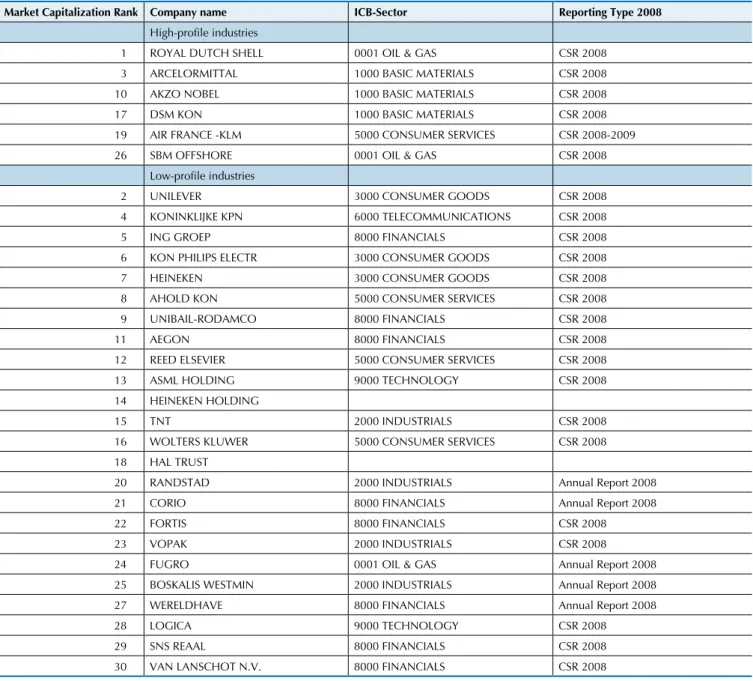
based on the market capitalization of the companies (see Table 1). Hackston and Milne (1996) used a similar me-thod to select the sample for their research. The 30 largest companies represent 94% of the total market capitaliza-tion on this date. From the initial sample, two companies are excluded. Those companies are holding companies of firms that are already in the sample. Heineken Holding is de holding of (7) Heineken. Hal Trust is an investment company that holds substantive investments in, among others, (23) Vopak and (25) BoskalisWestminster (Hal Investments, 2011). The final sample consists of 28 com-panies listed on the Amsterdam Exchange Index (AEX) and the Amsterdam Midcap Index (AMX), which repre-sents 90% of the total market capitalization in the Dutch stock exchange. The CSR reports were collected from those 28 companies (if available).
Table 1 shows an overview of the sample, its industry and its reporting type. The initial intention was to rate the environmental disclosure provided in the annual reports, because it has been used in former studies as a basis of measuring environmental disclosure (Al-Tuwaijri et al., 2004; Cowen et al., 1987; Deegan & Gordon, 1996; Gray
et al., 1995; Hackston & Milne, 1996; Hughes, Anderson, & Golden, 2001; Neu et al., 1998; Patten, 2002; Wiseman, 1982). Furthermore, Neu, Warsame, and Pedwell (1998) observed that annual reports are the primary source for stakeholders, regarding financial and non-financial infor-mation. However, in this research, CSR reports1 are used
as a source for environmental disclosure measurement. In most annual reports, there is a chapter for CSR, but, for the majority of the sample, this CSR-chapter consists of a brief summary of the company’s CSR report, and for addi-tional information they refer to their CSR report. Other companies, like Akzo Nobel and Philips, have merged their CSR report in their annual report. For the fairness of environmental disclosure measurement, it has been made the decision to measure the environmental disclosure as provided in the company’s CSR report.
There was no CSR reports found on the corpora-te websicorpora-te of five companies. Email correspondence confirmed that they did not publish a separate CSR report. For those five companies, the annual report was used, in which they disclosed information about health, safety and environmental (HSE) issues. The CSR reporting year is 2008. For financial data the Bureau van Dijk database ‘Amadeus’ (Analyze major databases from European sources) was used. Missing financial data was calculated manually.
Table 1 Sample overview
Market Capitalization Rank Company name ICB-Sector Reporting Type 2008
High-proile industries
1 ROYAL DUTCH SHELL 0001 OIL & GAS CSR 2008
3 ARCELORMITTAL 1000 BASIC MATERIALS CSR 2008
10 AKZO NOBEL 1000 BASIC MATERIALS CSR 2008
17 DSM KON 1000 BASIC MATERIALS CSR 2008
19 AIR FRANCE -KLM 5000 CONSUMER SERVICES CSR 2008-2009
26 SBM OFFSHORE 0001 OIL & GAS CSR 2008
Low-proile industries
2 UNILEVER 3000 CONSUMER GOODS CSR 2008
4 KONINKLIJKE KPN 6000 TELECOMMUNICATIONS CSR 2008
5 ING GROEP 8000 FINANCIALS CSR 2008
6 KON PHILIPS ELECTR 3000 CONSUMER GOODS CSR 2008
7 HEINEKEN 3000 CONSUMER GOODS CSR 2008
8 AHOLD KON 5000 CONSUMER SERVICES CSR 2008
9 UNIBAIL-RODAMCO 8000 FINANCIALS CSR 2008
11 AEGON 8000 FINANCIALS CSR 2008
12 REED ELSEVIER 5000 CONSUMER SERVICES CSR 2008
13 ASML HOLDING 9000 TECHNOLOGY CSR 2008
14 HEINEKEN HOLDING
15 TNT 2000 INDUSTRIALS CSR 2008
16 WOLTERS KLUWER 5000 CONSUMER SERVICES CSR 2008
18 HAL TRUST
20 RANDSTAD 2000 INDUSTRIALS Annual Report 2008
21 CORIO 8000 FINANCIALS Annual Report 2008
22 FORTIS 8000 FINANCIALS CSR 2008
23 VOPAK 2000 INDUSTRIALS CSR 2008
24 FUGRO 0001 OIL & GAS Annual Report 2008
25 BOSKALIS WESTMIN 2000 INDUSTRIALS Annual Report 2008
27 WERELDHAVE 8000 FINANCIALS Annual Report 2008
28 LOGICA 9000 TECHNOLOGY CSR 2008
29 SNS REAAL 8000 FINANCIALS CSR 2008
30 VAN LANSCHOT N.V. 8000 FINANCIALS CSR 2008
4.2 Measurement of Variables.
4.2.1 Dependent variable.
The dependent variable in this study is the level of the environmental disclosure, or CSR disclosure, as it is used in its complete form. The most widely used te-chnique to measure CSR disclosure is content analysis (Al-Tuwaijri et al., 2004; Clarkson et al., 2008; Cowen et al., 1987; Deegan & Gordon, 1996; Gray et al., 1995; Hackston & Milne, 1996; Hughes et al., 2001; Neu et al., 1998; Wiseman, 1982). Content analysis is a techni-que whereby text is codified into groups or categories according to specific criteria (Milne & Adler, 1999). A definition to content analysis is provided by Krippen-dorff (1980, p. 21): “a research technique for making replicable and valid inferences from data according to their context.”
In prior research, environmental disclosure measu-rement techniques can be categorized into two groups: the ones who count disclosures, and the ones who classify them (Milne & Adler, 1999). The first group uses measures that quantify the level of
environmen-tal disclosure. For example, number of pages, senten-ces and words, number of news types (bad, good, or neutral news) or number of disclosure items (Deegan & Gordon, 1996; Gray et al., 1995; Guthrie & Parker, 1989; Hackston & Milne, 1996; Milne & Adler, 1999; Neu et al., 1998; Patten, 2002). The main criticism on this type of measurement is that it cannot take into ac-count the use of non-textual information (McMurtrie, 2005). Neither is it possible to assess the quality of the disclosed information.
disclosure on 18 items. These items were classified into four categories: 1) economic factors; 2) environmental litigation; 3) pollution abatement items; and 4) other environmentally related information. The total score of each firm was calculated.
Al-Tuwaijri, Christensen, and Hughes (2004) and Freedman and Jaggi (1982, 1988) developed a simpli-fied scorecard. Al-Tuwaijri et al. (2004) used a content analysis methodology focused on the pollution-related information in the environmental report. Four diffe-rent pollution items are assessed: 1) designation for cleanup responsibility of toxic; 2) toxic waste genera-ted and recycled; 3) oil and chemical spills; and 4) en-vironmental fines and penalties. Freedman and Jaggi (1982) developed a pollution disclosure index, which assigns weights to different aspects of the environmen-tal disclosure provided in the annual report. The index contained items, like emissions data, past/current/fu-ture capital expendipast/current/fu-tures on environmental initiatives and descriptive information regarding environmental initiatives.
For this study, the environmental disclosure index, used in Clarkson et al. (2008), will be adopted (see Appendix A). The Clarkson et al. (2008) content analy-sis index is suitable for environmental reports, but also for corporate websites. The scorecard was developed in cooperation with an expert in the field of environmen-tal reporting and it is based on sustainability reporting guidelines, issued in 2002, by the Global Reporting Ini-tiative (GRI). The GRI is a joint iniIni-tiative of the Coali-tion for Environmentally Responsible Economies, a US NGO, and the UN Environmental Program. The overall goal is to develop a universally accepted framework to enhance the quality, rigor, and utility of sustainability reporting (Global Reporting Initiative [GRI], 2009).
The index contains items that are divided into ‘hard’ and ‘soft’ disclosure items. The 29 ‘hard’ disclosure me-asures (divided in 4 categories) are objective meme-asures. Environmental claims can easily be verified and cannot easily be mimicked by poor environmental performers. The 16 ‘soft’ disclosure measures (divided in 3 catego-ries) are subjective, because they are unverifiable clai-ms to be committed to the environment and they can be easily mimicked. The scorecard consists of seven categories. The categories 1 to 4 represent ‘hard’ and the categories 5 to 7 represent ‘soft’ environmental dis-closure items. Each category represents a specific topic, regarding possible disclosures: 1) ‘governance structure and management systems’, which can be in place with respect to environmental protection; 2) ‘credibility’ of the provided disclosures in the report; 3) ‘environmen-tal performance indicators (EPI)’ are assessed.
EPI data can be disclosed by firms to convince stakehol-ders about their environmental commitments. Extra sco-res are awarded when firms disclose EPI with sco-respect to historical trends, emission targets and the industry ave-rage; 4) ‘environmental spending’; 5) ‘disclosure of vision and environmental strategy’; 6) ‘environmental profile’ of
a firm given the current and forthcoming environmental regulations; 7) ‘environmental initiatives’ in which a firm is participating (Clarkson et al., 2008).
The main problem with content analysis is dealing with reliability and the ability to replicate the study (Mi-lne & Adler, 1999). Therefore, to deal with these issues, two other coders were asked to rate a sample of the CSR reports. Disagreements were discussed and some items were adjusted to the agreed score. In general, the opi-nions of each coder were in line with each other.
4.2.2 Independent variables.
Size
The size of a company can be measured in several ways. The most commonly used measures are number of employees, total assets, sales volume, or an index rank (Fortune 500). In this study, three indicators will be used as measures of size: market capitalization (as on December 31st, 2008), sales, and total assets
(Cla-rkson et al., 2008; Hackston & Milne, 1996; Trotman & Bradley, 1981). Using multiple measures of size will contribute to the robustness of the findings.
Industry type
The classification of industries into environmental sensitive and non-sensitive industries is a subjective method. For every industry, it is possible to ground it into an environmental sensitive industry. In this re-search, the classification criteria outlined in Roberts (1992) will be used. Roberts defines high-profile indus-tries (environmental sensitive indusindus-tries) as those with high consumer visibility, high level of political risk, and concentrated intense competition. For the indus-tries, included in this research sample, the oil and gas and basic materials (steel and chemicals) are classified as high-profile. These industries seem to be the ones that meet Roberts’ definition of high-profile industries. Consumer services and goods, industrials, financials and communications are classified as low profile in-dustries (Table 1).
However, there are two exceptions in the classifi-cation of companies into high- and low-profile indus-tries. The company Fugro is classified into the oil and gas industry, according to the Industry Classification Benchmark Sector (ICB-Sector). In this research, Fu-gro will be classified as a low profile, because FuFu-gro is a company that “collects, processes and interprets data related to the earth’s surface and the soils and rock be-neath” (Fugro, 2010). Fugro is only indirectly involved with drilling of oil and gas or mining. Fugro performs exploration activities by analyzing data and gives advi-ce to oil, gas and mining corporations.
pressure regarding flying. Flying is perceived as high-polluting (Wong & Fryxell, 2004). As a reaction, airlines give customers the option to compensate their emission. Also the governments are trying to make flying less at-tractive by extra taxation when using airplanes.
Proitability
Profitability can be measured by multiple indicators. In prior studies, single year accounting measures are used
(Freedman & Jaggi, 1982) and multiple year averages are used (Cowen et al., 1987; Hackston & Milne, 1996). A more reliable measure of profitability is measuring pro-fitability over an extended period (Hackston & Milne, 1996). Therefore, in this study the five-year average return on equity (EBIT/total equity) and the five-year average return on assets (EBIT/total assets) is used as a measure for profitability. Once more, multiple measures of size will contribute to the robustness of the findings.
5 RESULTS
For this research, 28 companies have been rated on the level of their environmental disclosure in the year 2008. Five of those companies did not publish a separate CSR report. The data of those companies are collected from their annual reports of 2008. All data used is derived from CSR reports and annual reports; no data is used from the corporate websites or other media channels. After rating the CSR reports, the annual reports were also rated. It was done because some data were not available in the CSR reports while they were in the firms’ annual reports. For example, information about whether executive compen-sation was linked to environmental performance measu-res. In the CSR report, no information was given on this
topic, but in the remuneration report, which is part of the annual report, the information about global chief execu-tive officer’s (CEO) targets was available. Also disclosure about management positions for environmental manage-ment was not always included in the CSR report, but it was available in the annual report.
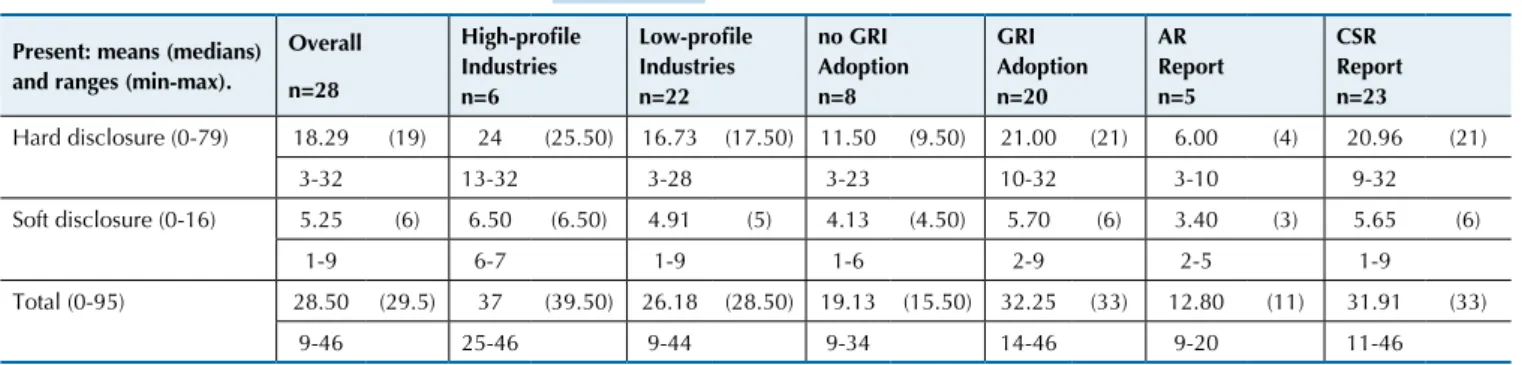
In Table 2, the descriptive statistics are presented for the overall sample (for a score per firm, see Appendix B). A distinction is made among: 1) the high- and low-profile industries; 2) CSR reports without GRI-guide-lines and with GRI-guideGRI-guide-lines; and 3) environmental reporting as part of the annual report or separate CSR reporting.
Table 2 Descriptive statistics
Present: means (medians) and ranges (min-max).
Overall
n=28
High-proile Industries n=6
Low-proile Industries n=22
no GRI Adoption n=8
GRI Adoption n=20
AR Report n=5
CSR Report n=23
Hard disclosure (0-79) 18.29 (19) 24 (25.50) 16.73 (17.50) 11.50 (9.50) 21.00 (21) 6.00 (4) 20.96 (21)
3-32 13-32 3-28 3-23 10-32 3-10 9-32
Soft disclosure (0-16) 5.25 (6) 6.50 (6.50) 4.91 (5) 4.13 (4.50) 5.70 (6) 3.40 (3) 5.65 (6)
1-9 6-7 1-9 1-6 2-9 2-5 1-9
Total (0-95) 28.50 (29.5) 37 (39.50) 26.18 (28.50) 19.13 (15.50) 32.25 (33) 12.80 (11) 31.91 (33)
9-46 25-46 9-44 9-34 14-46 9-20 11-46
As can be seen, the mean values among the three groups are higher for the groups also expected. The hi-gh-profile industries, the GRI-adoption group and the CSR report group show a higher mean than their oppo-sites. The higher mean score for the high-profile indus-tries is also assumed in the second hypothesis, because high-profile industries are more likely to face societal perceptions about their environmental damaging acti-vities, and so they are more likely to provide a detailed report to comply with stakeholder demands (Adams, 2004). Testing of this hypothesis will be discussed later.
Twenty companies have adopted the GRI guidelines for sustainability reporting. Therefore, those companies have structured their report in almost the same way. The companies that did not adopt the GRI guidelines have a mean score of 19.13, and the companies that have adopted the GRI guidelines have a mean score of 32.25. This diffe-rence in means could be possible because the scorecard that is based on the GRI guidelines. Therefore, it is more likely that the companies that have applied the GRI
gui-delines will score higher. In absolute numbers, the diffe-rence between AR reporting and CSR reporting is larger. It happens because in the annual reports environmental issues it has just a little brief discussion, which makes it very hard to score any points.
In a depth analysis for the total disclosure score, exa-mining the hard disclosure items and the soft disclosure items, the results are equals. The groups, for which a higher score is ‘expected’, report a higher mean on both, hard and soft disclosure. As can be seen, the absolute differences be-tween high- and low-profile industries, no and GRI-adoption and AR- and CSR-reporting are larger for the hard disclosure items than for the soft disclosure items.
discloses all its EPIs. There are 10 EPI’s and a maximum of 6 can be given to every EPI. The maximum score that is awarded in this category is 19 (30%). It means that 41 points on a total of 79 hard disclosure items are not awarded during this content analysis. This will result in relatively low numbers of addressing the hard disclosu-re items. On average, 23% of the hard disclosudisclosu-re items are scored (18.29 out of 79) with a maximum of 40% (32 out of 79). Furthermore, it is remarkable that on certain aspects of the scorecard no points are scored, especially in the soft, easy to mimic, disclosure items
environmental profile and environmental initiatives. None of the companies provide an overview of the en-vironmental impact on the industry in which they are operating. Also, no information about their environ-mental performance relative to their industry peers is given by any of the firms in the sample.
In the environmental spending item (hard disclosure item), only 1 (out of 28) company has disclosed informa-tion about their savings arising from environmental ini-tiatives. Information about the amount spent on environ-mental technologies is also absent for 26 companies.
Table 3 Descriptive statistics independent variables (N=28)
Mean Std. Deviation Min Max Skewness Kurtosis Shapiro-Wilk
W-stat Sig.
Independent variables
Market capitalization 2008 15.352 1.146 13.798 18.050 0.487 -0.534 0.952 0.228
Total assets 2008 16.722 1.637 14.568 21.010 0.815 0.267 0.934 0.079
Sales 2008 15.496 1.822 11.736 19.578 -0.114 -0.112 0.986 0.964
ROE 2008 -0.005 1.266 -6.274 1.157 -4.788 24.536 0.397 0.000
ROE average 0.230 0.184 -0.335 0.544 -0.571 2.026 0.915 0.025
ROA 2008 0.058 0.074 -0.100 0.211 0.283 -0.120 0.965 0.463
ROA average 0.078 0.056 -0.013 0.222 0.496 0.254 0.963 0.406
Dependent variables
Hard disclosure 18.29 8.142 3 32 -0.278 -0.504 0.966 0.490
Soft disclosure 5.25 1.898 1 9 -0.142 0.069 0.954 0.255
Total disclosure 28.50 10.983 9 46 -0.354 -0.787 0.943 0.128
Table 3 provides the descriptive statistics for the inde-pendent measures of size and profitability and the depen-dent variables. The size measures are adjusted to the natural logarithm due to their non-normality. The negative figures in return on assets (ROA) and return on equity (ROE) mini-mums are possible because of the negative financial perfor-mance figures. Negative figures of the ROE of 2008 measure can be explained due to the worldwide financial crisis.
A Shapiro-Wilk test is performed to test normality. This test is used due to the small sample size. The ROE 2008 and the average ROE numbers are not normally distributed. It happens, as mentioned before, because of the disturbed 2008 financial figures due to the financial crisis. The other variables are normally distributed.
In the total, three hypotheses are tested in order to examine the relationship between an independent va-riable and the level of environmental disclosure.
The first hypothesis tested is the following:
Hypothesis 1 – There is a positive relationship between the size of a company and the level of environmental disclosure.
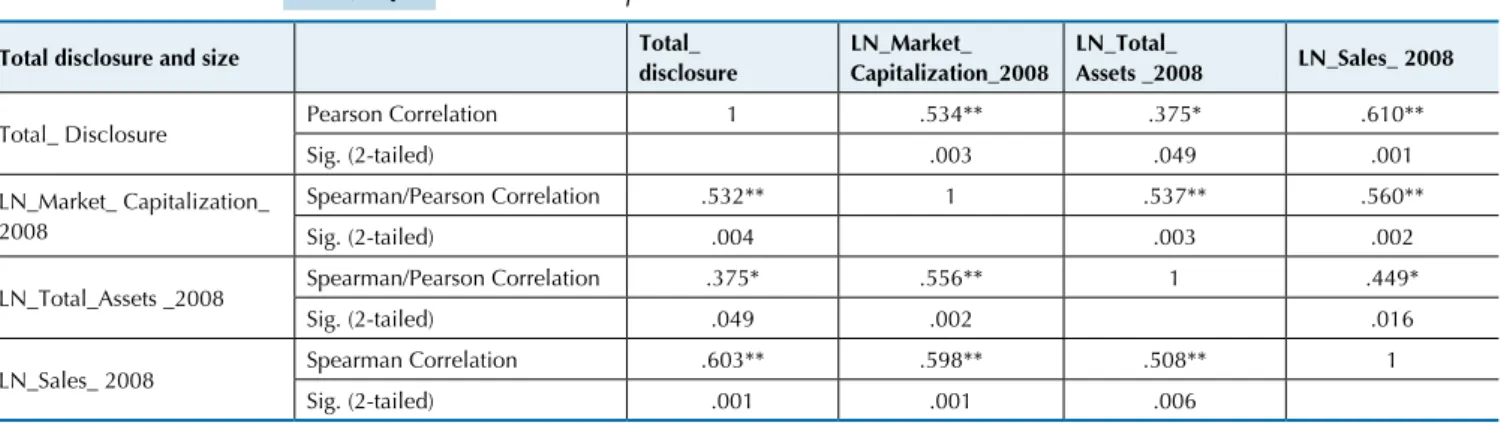
The effects of three size indicators were tested on the depen-dent variable total disclosure. As can be seen in Table 3, both, the dependent variable and the independent variables, turned out to be normally distributed, which means that a Pearson cor-relation can be used to test the cor-relationship between these varia-bles. However, also the Spearman correlations are given.
Table 4 presents the results of the pair-wised Pearson and Spearman rank correlation tests and their significance.
Table 4 Pearson and Spearman correlation test. Total disclosure and size
Total disclosure and size Total_
disclosure
LN_Market_ Capitalization_2008
LN_Total_
Assets _2008 LN_Sales_ 2008
Total_ Disclosure Pearson Correlation 1 .534** .375* .610**
Sig. (2-tailed) .003 .049 .001
LN_Market_ Capitalization_ 2008
Spearman/Pearson Correlation .532** 1 .537** .560**
Sig. (2-tailed) .004 .003 .002
LN_Total_Assets _2008 Spearman/Pearson Correlation .375* .556** 1 .449*
Sig. (2-tailed) .049 .002 .016
LN_Sales_ 2008 Spearman Correlation .603** .598** .508** 1
Sig. (2-tailed) .001 .001 .006
Every correlation is positive. It implies that larger companies disclose on average a higher level of envi-ronmental information than smaller companies do. All the size measures are significantly correlated with en-vironmental disclosure. When applying Pearson’s cor-relation test, market capitalization has a corcor-relation of 0.534 and it is statistically significant at the 1% level. Sales are also statistically significant at 1% and have a correlation of 0.610. Both correlation coefficients in-dicate a strong relationship with environmental dis-closure. There is a medium relationship of 0.375 be-tween total assets and environmental disclosure. This relationship is also confirmed, because the finding is statistically significant at the 5% level (0.049 < 0.050).
The same findings are supported when applying Spearman’s rank correlation test. All the size measures are statistically significant correlated with environmen-tal disclosure. Market capienvironmen-talization has a correlation coefficient of 0.532 at 1% level and sales have a corre-lation of 0.603 at the same significance level. There is a medium correlation between environmental disclosure and total assets of 0.375 and this relationship is
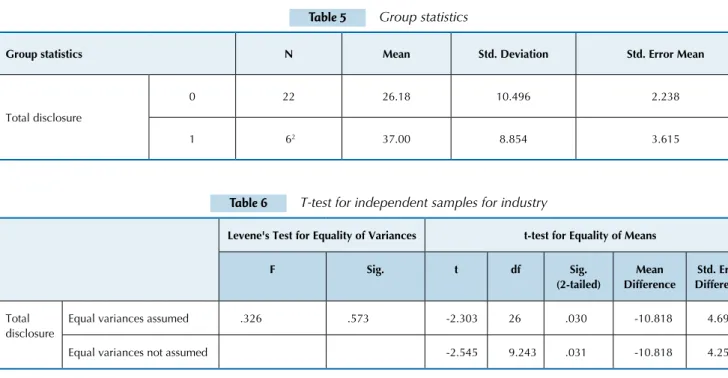
signifi-Table 5 Group statistics
Group statistics N Mean Std. Deviation Std. Error Mean
Total disclosure
0 22 26.18 10.496 2.238
1 62 37.00 8.854 3.615
2 If Fugro is included in the high-proile sample, the hypothesis would not be conirmed. The means are 26.90 for the low-proile and 33.29 for the high-proile industry and the signiicance would be 0.260. Equal variances are not assumed since the significance
is 0.573 > 0.05. There is an absolute mean difference of the total disclosure level of 10.818 between low profile and high profile industries (the mean of high profile tries is 10.818 higher than the mean of low profile indus-tries). Consequently, this mean difference is statistically significant (0.031 < 0.05). Therefore, the relation between environmental sensitive industries and the level of envi-ronmental disclosure can be confirmed. This is consistent with findings from comparable studies (Hackston & Mil-ne, 1996; Patten, 1991; Roberts, 1992).
The last hypothesis tested is:
cant (0.049 < 0.05). All three measures of the size varia-ble are significantly mutually correlated. It was expected because the three variables (market capitalization, total assets and total sales) should reflect the size of a com-pany. Overall, the hypothesis one is confirmed. The fin-dings suggest that the larger listed Dutch firms disclose more environmental information than the smaller firms. This is also consistent with the results from other studies (Hackston & Milne, 1996; Patten, 1991; Roberts, 1992; Silva Monteiro & Aibar-Guzmán, 2010).
The second hypothesis tested is:
Hypothesis 2 – There is a higher level of environ-mental disclosure provided by firms operating in a high-profile industry than by firms operating in a low-profile industry.
In order to test the relationship between the indus-try, a firm in operating and the level of environmental disclosure, a t-test for independent samples is perfor-med. Concerning the firms’ industry, a distinction be-tween low profile (0) and high profile (1) industries is made. Table 5 shows the group statistics of the test and in Table 6 the results of the t-test are presented.
Table 6 T-test for independent samples for industry
Levene's Test for Equality of Variances t-test for Equality of Means
F Sig. t df Sig.
(2-tailed)
Mean Difference
Std. Error Difference
Total disclosure
Equal variances assumed .326 .573 -2.303 26 .030 -10.818 4.698
Equal variances not assumed -2.545 9.243 .031 -10.818 4.251
Hypothesis 3 – There is no relationship between the economic performance of a company and the level of envi-ronmental disclosure.
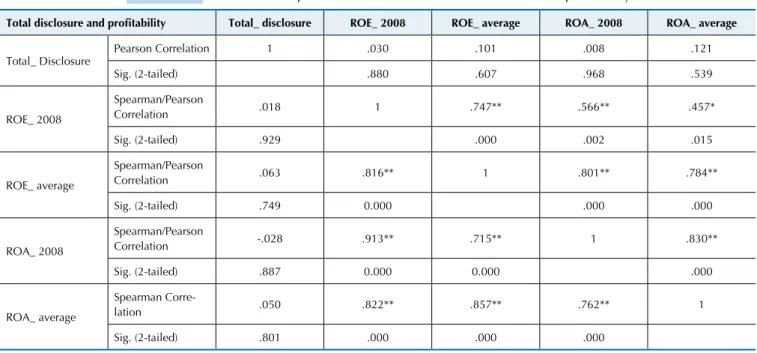
In order to examine the impact of the economic per-formance of a firm on its level of environmental disclo-sure, four measures of this economic performance are tested. These measures are: 1) ROE of 2008; 2) 2004-2008 average ROE; 3) ROA of 2008; and 4) 2004-2008 average ROA. Both Pearson and Spearman correlations are given, because ROE of 2008 is not normally distributed.
Table 7 Pearson and Spearman correlation test. Total disclosure and proitability
Total disclosure and proitability Total_ disclosure ROE_ 2008 ROE_ average ROA_ 2008 ROA_ average
Total_ Disclosure
Pearson Correlation 1 .030 .101 .008 .121
Sig. (2-tailed) .880 .607 .968 .539
ROE_ 2008
Spearman/Pearson
Correlation .018 1 .747** .566** .457*
Sig. (2-tailed) .929 .000 .002 .015
ROE_ average
Spearman/Pearson
Correlation .063 .816** 1 .801** .784**
Sig. (2-tailed) .749 0.000 .000 .000
ROA_ 2008
Spearman/Pearson
Correlation -.028 .913** .715** 1 .830**
Sig. (2-tailed) .887 0.000 0.000 .000
ROA_ average
Spearman
Corre-lation .050 .822** .857** .762** 1
Sig. (2-tailed) .801 .000 .000 .000
**. Correlation is signiicant at the 0.01 level (2-tailed). *. Correlation is signiicant at the 0.05 level (2-tailed).
The variables that reflect the profitability of the com-pany (ROE of 2008, average ROE, ROA of 2008 and avera-ge ROA) are mutual highly correlated. None of the profi-tability measures provide statistically significant evidence to explain the relation between the corporate profitability and the level of environmental disclosure. According to the Pearson test, the correlation is weak till medium (ran-ge between 0.008 - 0.101). The results of the Spearman rank test provide only a very weak relationship (range be-tween -0.028 - 0.063). Therefore, the third hypothesis is supported. The level of environmental disclosure seems to be unrelated to the profitability of the 28 largest Dutch
companies. This is consistent with other research, which also failed to support a relation between corporate profi-tability and environmental disclosure (Cowen et al., 1987; Hackston & Milne, 1996; Patten, 1991; Roberts, 1992).
Summarizing, the size measures (market capitaliza-tion, total assets and sales) provide a statistically sig-nificant explanation about the dependent variable, en-vironmental disclosure. An organization operating in an environmental sensitive industry is also positively associated with the level of environmental reporting. The remaining variable, profitability, does not have ex-planatory power over environmental disclosure.
6 CONCLUSION
The aim of this research was to perform an empirical study on the determinants of voluntary environmental dis-closure in the Netherlands. The study makes two contribu-tions to the extant literature. Firstly, by the way, it measures environmental disclosure. It is used a content analysis sco-recard, applied in Clarkson et al. (2008), to investigate the level of environmental disclosure. The scorecard was de-veloped in collaboration with an environmental disclosure expert. This current study is the first one that uses this kind of CSR quality measure. Former studies have used more quantitative measures of CSR disclosure, like number of words or sentences. The scorecard used in this research “is valuable to users who seek to assess the firms’ true environ-mental commitment and related environenviron-mental exposures” (Clarkson et al., 2008, p. 305).
Secondly, the focus of the paper is the determinants of environmental reporting in the Netherlands. There is limited knowledge about Dutch disclosure practi-ces and it is an interesting research area because the
Dutch government does not enforce mandatory repor-ting laws, but builds on the self-regularepor-ting and disci-plining functioning of businesses. They stimulate the disclosure of environmental information by providing a framework, which gives guidance for the consistency, transparency and verifiability of CSR reports. In this respect, it can be concluded that, due to the self-regula-ting and functioning of businesses, firms have to make decisions about the level to which environmental dis-closure is provided. This research is an attempt to fill a gap and seek to uncover the variables that influence corporate motivation for CSR reporting.
to measure the environmental disclosure per firm. The results confirm that two of these variables have a signi-ficant impact on the level of environmental reporting in the Netherlands. Firm size is a determinant of environ-mental disclosure, supported by hypothesis one. In this study, three indicators of size are used: market capitali-zation, sales and total assets (as on December 31st, 2008).
All the size measures are significantly correlated with the environmental disclosure. The notion that larger firms leave a larger footprint and have more stakeholders than smaller ones is consistent with stakeholder theory.
The variable industry is also having a significant im-pact on environmental disclosure. Firms are classified into high- and low-profile industries, meaning that hi-gh-profile ones are environmental sensitive industries. In this research, the oil and gas, basic materials (steel and chemicals) and the airline industry are classified in the high-profile group. The results show that there is a significant difference between low- and high-profile industries and the level of their environmental disclo-sure. This means that environmental sensitive firms (high-profile) report a higher level of environmental disclosure than firms in low-profile industries, this is consistent with legitimacy theory.
In contrast to size and industry, profitability is not statistically significantly related to the level of environ-mental disclosure. This could be because of the finan-cial crisis, started in 2008. Finanfinan-cial numbers could be disturbed due to the unexpected losses or financial pre-cautions taken by the majority of firms. The five-year ROE and ROA average between 2004 and 2008 and the single ROE and ROA in 2008 are used to measure pro-fitability. Nevertheless, this failed test for the relation between profitability and environmental disclosure is also consistent with prior research (Cowen et al. 1987; Hackston & Milne, 1996; Patten, 1991; Roberts, 1992). Using multiple measures of size and profitability con-tributes to the robustness of the results.
There are, however, limitations in this study that should be taken into account when interpreting the results. First, the time period in which this research is undertaken is insufficient to draw definite conclusions, particularly due to the development and improvement of reporting
guide-lines and sustainability issues after the period of analy-sis. However, this limitation is mainly an opportunity for further research. The analysis is based on cross-sectional observations; longitudinal analysis would give more insi-ght into the environmental disclosure practices in the Ne-therlands. Second, content analysis is used as a measure for the quality of environmental disclosure. Brammer and Pavelin state that (2008, p.1186):
An alternative approach would be an independent focus upon each individual indicator of quality. This would permit insight into whether indicators are com-plements or substitutes, as well as revealing the extent to which each is associated with particular firm or in-dustry characteristics.
Third, only three variables are used to examine whether they influence the quality of environmental disclosure. Those three are chosen because of the ability to compare the results with existing literature. Other, less researched, variables like: ownership structure, country of ownership, environmental performance, corporate governance struc-tures, organizational culture and media exposure could be investigated. Finally, the source used for environmental disclosure is the stand-alone CSR report of the company, or the annual report in absence of the CSR report. Infor-mation from other communication channels, like the cor-porate website or environmentally-related press releases is not addressed (cf. Aerts & Cormier, 2009). Furthermo-re, this study could be improved or extended by using a survey or conducting interviews as a research method in order to deepen the understanding of the variables that influence the reporting practices among Dutch firms.
Despite of the limitations, this research can contri-bute to the existing literature. It is one of the the first studies performed in the Dutch context and it is also one of the first studies that examines variables that in-fluence the level of environmental disclosure by using the Clarkson et al. (2008) scorecard. The majority of the studies analyzed the presence or absence of envi-ronmental information or analyzed the quantity of the disclosed environmental information. However, this study has evaluated the scope, depth and length of en-vironmental disclosure provided by a sample of listed firms in the Netherlands.
Adams, C. A. (2004). he ethical, social and environmental reporting-performance portrayal gap. Accounting, Auditing & Accountability
Journal, 17 (5), 731-757.
Aerts, W., & Cormier, D. (2009). Media legitimacy and corporate environmental communication. Accounting, Organizations and
Society, 34 (1), 1-27.
Al-Tuwaijri, S. A., Christensen, T. E., & Hughes, K. E. II (2004). he relations among environmental disclosure, environmental performance, and economic performance: a simultaneous equations approach. Accounting, Organizations and Society, 29 (5/6), 447-471. Bartiaux, F. (2008). Does environmental information overcome practice
compartmentalisation and change consumers’ behaviours? Journal of
Cleaner Production, 16 (11), 1170-1180.
Bassetto, L. I. (2010). A incorporação da responsabilidade social e sustentabilidade: um estudo baseado no relatório de gestão 2005
da companhia paranaense de energia - COPEL. Revista Gestão e
Produção, 17 (3), 639-651.
Beck, A. C., Campbell, D., & Shrives, P. J. (2010). Content analysis in environmental reporting research: enrichment and rehearsal of the method in a British-German context, he British Accounting Review, 42 (3), 207-222.
Belkaoui, A. (1976). he impact of disclosure of the environmental efects of organizational behavior on the market. Financial Management, 5 (4), 26-31. Berman, S. L., Wicks, A. C., Kotha, S., & Jones, T. M. (1999). Does
stakeholder orientation matter? he relationship between stakeholder management models and irm inancial performance. he Academy of
Management Journal, 42 (5), 488-506.
Brammer, S., & Pavelin, S. (2006). Voluntary environmental disclosures by large UK companies. Journal of Business Finance & Accounting, 33
(7/8), 1168-1188.