Mestrado em Engenharia Eletrotécnica
Energetic Macroscopic Representation of an
Hybrid Energy Storage System for an Electrical
Vehicle
Trabalho de projeto apresentado para a obtenção do grau de Mestre em
Engenharia Eletrotécnica
Especialização em: Automação e Comunicações em Sistemas de Energia
Autor
Rapahel Andrade Barbosa
Orientador
Professora Doutora. Marina M.S Perdigão
Instituto Superior de Engenharia de Coimbra
Professor Doutor.Alain Bouscayrol
Université de Lille 1
L2EP
Acknowledgements
This work would have been impossible if it had not been for two professors, Professor Alain Bouscayrol who received and helped me with my adaptation to Lille and made me progress professionally and personally. I also want to thank Professor João Pedro Trovão that proposed me the opportunity to work in this field and to undergo this experience.
I want to thank Ali Castaing and the L2EP laboratory control team that helped me during all the process of my master’s thesis.
RESUMO
A sociedade hoje em dia é maioritariamente dependente do petróleo, esta dependência é verificada sobretudo em setores industriais. Esta dependência é ainda mais acentuada na indústria automóvel, onde a maioria dos combustíveis provêm do petróleo. O fato de só alguns países possuírem reservas de petróleo faz com que se crie uma dependência destes países a esse produto. Esta dependência é prejudicial a nível económico e ambiental. A produção de CO2 e de outros gases para a atmosfera durante o processo de queima do petróleo tem causado fenómenos, como por exemplo, efeito de estufa, alterações climáticas, chuvas ácidas, buraco de ozono etc., o que tem levantado algumas preocupações em reduzir essas emissões de gases. Estas preocupações têm feito desenvolver novas tecnologias em diversos setores industriais visando sempre um desenvolvimento sustentável e processos mais eficientes.
elétricos no nosso quotidiano tem que ser um compromisso entre diversos setores da sociedade. Um dos setores influêntes é o setor politico.Esse setor terá de porpocinonar formas e condições para a implementação deste tipo de veículos na sociedade. Outros setores serão os de marketing para realçar as vantagens de o uso desse tipo de transporte. Por fim, o ultimo setor será o setor automóvel, esse setor tem como tarefa apresentar produtos atrativos e a preços acessíveis. Este estudo foi realizado com a colaboração do “Laboratoire d’Electrotechnique et d’Electronique de Puissance de Lille, L2EP”. Este laboratório é especializado em controlo de sistema electromecânicos como por exemplo, metros, carros elétricos, tendo também experiência em sistemas de produção de energia como sistemas eólicos e painéis fotovoltaicos. O trabalho consiste no desenvolvimento de um sistema de armazenamento de energia híbrido elétrico para veículos elétrico e da sua estratégia de gestão de energia. Este sistema é constituído por baterias e supercondensadores. Para a representação deste sistema foi utilizado um formalismo desenvolvido pelo L2EP, “Energetic Macroscopic Representation” utilizando a ferramenta do Matlab Simulink. Este formalismo é desenvolvido pelo “Laboratoire d’Electrotechnique et d’Electronique de Puissanse de Lille, L2EP”e baseia-se no efeito de causalidade. Para definir a cadeia de controlo é necessário inverter diretamente cada um dos elementos. Com esta forma de deduzir o controlo encontramos diretamente onde serão necessários colocar controladores. Assim sendo, o controlo do sistema é conseguido de forma sistemática. De forma a distinguir cada um dos elementos, consoante as suas características, utilizam-se cincos diferentes pictogramas. Estes são:
Fontes de energia;
Elementos de acumulação;
Elementos de conversão mono físicos Elementos de conversão multi físicos; Elementos de acoplamento;
O sistema estudado é um veículo elétrico “TAZZARI”. Este veículo pertence ao L2EP e é utilizado para desenvolver projetos académicos ou projetos de doutoramentos. O seu sistema de tração é constituído por um motor de indução trifásica, inversor, um diferencial, rodas e o seu chassis. O sistema de armazenamento de energia estudado é um híbrido elétrico constituído por baterias, supercondensadores e um conversor de eletrónica de potência.
energia possuir uma densidade energética inferior à dos combustíveis utilizados nos veículos térmicos. Estas fontes de energia são tipicamente baterias devido à sua grande densidade de energia elétrica. É essa densidade energética que permite obter a sua autonomia. Em contra partida uma bateria possui baixa densidade de potência, e esta característica torna-se prejudicial quando o sistema de tração requer grandes quantidades de potência, em momentos de grandes acelerações por exemplo. Nestes momentos de alta potência as baterias poderão fornecer essa potência mas degradando o seu tempo de vida. O fato de o sistema ser constituído por baterias, trás desvantagens em relação aos seus custos. De fato este componente é dos mais caros neste tipo de veículos. Baterias têm um tempo de vida em modos de utilização aconselháveis de aproximadamente 5 anos. Como foi explicado, uma bateria não é o mais adequado para alimentar este tipo de tração. Neste momento no mercado não existe nenhuma fonte de energia que seja capaz de satisfazer plenamente o sistema em termos de potência e energia. Existe então uma necessidade de encontrar soluções para aumentar o seu tempo de vida de forma a baixar os custos associados à manutenção. Esta solução tem passado por criar sistemas de armazenamento de energia híbridos. Diversos estudos têm sido desenvolvidos sobre este tipo de sistemas. Tem-se estudado diversas topologias, existindo duas grandes categorias, passiva e ativa, sendo estas possuidoras de características distintas:
Passiva: nesta topologia as duas fontes encontram-se conectadas diretamente em paralelo;
Ativa, esta topologia possui diversas sub-topologias:
“Cascade converters”
“Paralell Multi-inputs converter”
“Multiple converters”
Supercondensadores/Baterias Baterias/Supercondensadores
Para o controlo deste tipo de sistemas é necessário aplicar uma estratégia de gestão de energia de forma a conseguir gerir da melhor forma possível os fluxos de energia entre as duas fontes. Algumas das estratégias já estudadas são:
Filtragem
Corrente de saturação
“Switch”
Neste trabalho é estudada a topologia ativa, supercondensadores/baterias. Esta topologia possui duas grandes vantagens. Possui um DC-Bus praticamente constante, dado ter a bateria a garantir o nível tensão e utilizar os supercondensadores com alto rendimento para conseguir-se aproveitar grande parte da potência armazenada. A estratégia utilizada é a estratégia de filtragem. Esta estratégia permite filtrar a potência de tração necessária em altas e baixas frequências. A potência de tração possui altas frequências, que corresponde a níveis de potência elevados e baixas frequências que corresponde a níveis de energia elevados. Como foi dito anteriormente as baterias conseguem alimentar um sistema com muita energia mas não conseguem, sem degradar o seu tempo de vida, fornecer altas potências. Com esta estratégia é possível separar isso e fazer com que as baixas frequências sejam alimentadas pelas baterias e as altas pelos supercondensadores. Contudo a estratégia é definida por um conjunto de regras definidas de forma a assegurar a segurança do utilizador e dos componentes. Nessa estratégia existe a particularidade de poder recuperar alguma da energia reenviada pelo sub sistema de tração durantes as fases de travagem. Esta característica permite-nos recarregar as baterias e os supercondensadores. Tendo isto como objetivo os supercondensadores serão dimensionados consoante a potência necessária para o sistema de tração e as baterias serão dimensionadas para a necessidade energética .
Na representação do sistema foram expostos todos os elementos constituintes do sistema. Foram considerados para cada um dos modelos os fenómenos mais relevantes para a análise final do sistema. A parte do controlo é obtida através da inversão direta de todos os elementos à exceção dos elementos de acumulação, onde essa inversão direta não é possível. Nesse elemento o controlo é feito com a ajuda de controladores do tipo IP, integral proporcional. Foi feita a escolha desses controladores para evitar “overshoots” e em certos casos para resolver problemas de “algebric loops”. De forma a simular o comportamento de um condutor, foi utilizado um “cycle drive” para veículos elétricos, “World-Wide Harmonized Light”“WLTC”. Este tipo de ciclo possui diversas classes conforme o rácio entre a massa do veículo e a potência da máquina elétrica.
Os resultados obtidos não foram integralmente os esperados. Verifica-se, em alguns momentos, que os supercondensadores não fornecem a parte de altas frequências devido a limitações impostas pela estratégia de energia.
Table of contents
Acknowledgements i
RESUMO ii
LIST OF TABLES iii
LIST OF FIGURES iv
Simbology vii
Abbreviations viii
1 Introduction 1
1.1 Context ... 1
1.2 Subject ... 2
1.3 State of art ... 3
1.3.1 Hybrid Storage System (H-ESS) ... 5
1.3.2 Strategies of Energy Managment ... 9
1.4 Laboratory of Electrical Engineering and Power Electronics (L2EP) ... 11
1.5 Outline of the work ... 12
2 Energetic Macroscopic Representation (EMR) 14 2.1 Representation of pictograms ... 14
2.1.1 Source element ... 14
2.1.2 Accumulation element ... 15
2.1.3 Mono-Physical/Multi-Physical Conversion Element- ... 15
2.1.4 Coupling element ... 15
2.2 Associations rules ... 16
2.2.1 Merging rule ... 16
2.2.2 Permutation rule ... 17
2.3 Traction subsystem ... 19
2.3.1 Traction subsystem model ... 20
2.3.2 Conflict of associations ... 27
2.4 Hybrid Energy Storage System (H-ESS) ... 29
2.4.1 Model of H-ESS ... 30
3 Control structure 38 3.1 Control of traction subsystem ... 39
3.1.1 Tuning paths ... 39
3.1.2 Element inversion ... 39
Chassis 41 3.2 Control of H-ESS ... 43
3.2.1 Element inversion ... 44
3.3 Simulations ... 48
3.3.1 Cycle Drive ... 48
3.3.2 Simulation results ... 49
References 58
ANNEX A 61
ANNEX B 62
ANNEX C 63
iii
LIST OF TABLES
Table 1-Topologies of H-ESS ... 6
Table 2- Dynamics parameters ... 20
Table 3- Characteristics of Static Model (Letrouvé et al. 2010) ... 26
Table 4- Characteristics of the battery ... 32
Table 5- Main characteristics of the system ... 37
Table 6- Classes of WLTC cycle ... 49
iv
LIST OF FIGURES
Figure 1-Evolution of the consumption and discovery of oil resources (Ehsani et al. 2005) .... 1
Figure 2-Emission of CO2 in transportation per sector (International Energy Agency 2014) .... 1
Figure 3-Subsystems... 2
Figure 4- Comparison of Energetic density and Power density between Batteries and SC (Guibert and (Saft Groupe SA) 2009) ... 4
Figure 5- Results of association between batteries and SC (Allegre 2010) ... 5
Figure 6-Passive system (Cao and Emadi 2012) ... 7
Figure 7-Batteries/Supercapacitors (Cao and Emadi 2012) ... 8
Figure 8-Cascaded configuration (Cao and Emadi 2012) ... 8
Figure 9-Multiple converter configuration (Cao and Emadi 2012) ... 9
Figure 10-Multiple input converter configuration ... 9
Figure 11- Source element ... 14
Figure 12- Accumulation element ... 15
Figure 13- Figure (a) Mono-Physical Figure (b) Multi-Physical ... 15
Figure 14- Coupling element ... 16
Figure 15- Merging Rule ... 17
Figure 16- Conflict of association ... 17
Figure 17- Equivalent virtual element ... 18
Figure 18-Tazzari EV ... 19
Figure 19- Traction subsystem (Depature et al. 2014) ... 19
Figure 20-Climb forces ... 22
Figure 21- Environment pictogram ... 22
Figure 22- Mechanical Break pictogram ... 23
Figure 23-Shaft pictogram ... 23
Figure 24- Chassis pictogram ... 24
Figure 25 - Differential Pictogram ... 24
Figure 26- Wheel pictogram ... 25
Figure 27- Asynchronous Machine ... 26
Figure 28- Chassis pictogram ... 27
Figure 29-Conflict of association ... 27
Figure 30- Shaft pictogram ... 28
v
Figure 32- Permutation ... 29
Figure 33-EMR of Traction Subsystem ... 29
Figure 34- Schematic of H-ESS ... 30
Figure 35- Energy and Power demand ... 31
Figure 36- Schematic of the Battery model ... 31
Figure 37- Pictogram of batteries ... 32
Figure 38- Supercapacitors model ... 33
Figure 39- Pictogram Supercapacitors ... 33
Figure 40- Pictogram of inductance ... 35
Figure 41- Configuration of the DC-DC converter ... 36
Figure 42- Pictogram of DC/DC Converter ... 36
Figure 43- Coupling of the current ... 37
Figure 44- H-ESS EMR ... 37
Figure 45- Schema for control ... 38
Figure 46-Tuning paths of traction system ... 39
Figure 47- Inversion Pictogram of the chassis ... 40
Figure 48- Pictogram control of the differential and wheels ... 41
Figure 49- Pictogram control of wheels ... 41
Figure 50. Braking Strategy... 42
Figure 51- EMR Strategy block ... 43
Figure 52- Final EMR of the traction subsystem ... 43
Figure 53- Tuning path for control of H-ESS... 44
Figure 54- Pictogram control of inductance ... 44
Figure 55-Pictogram control of chopper ... 45
Figure 56- Inversion ... 45
Figure 57- Pictogram control of coupling element ... 46
Figure 58- First Current strategy ... 47
Figure 59-Strategy block for batteries current ... 47
Figure 60- Final EMR and MCS of H-ESS ... 48
Figure 61- Drive cycle curve ... 49
Figure 62- Result of velocity control ... 50
Figure 63- Current traction ... 50
vi
Figure 65- Battery current ... 51
Figure 66- Batteries recharge SC ... 52
Figure 67-Result of the control current ... 53
Figure 68- Battery voltage ... 53
Figure 69- State of Charge of batteries ... 54
Figure 70- Supercapacitors current reference ... 54
Figure 71- SC voltage ... 55
Figure 72- Duty Cycle ... 56
Figure 73- Table o different coeficients ... 62
Figure 74- IP Schema block for transfer function of IP corrector ... 63
Figure 75- Battery characteristics ... 64
vii
Simbology
a- Acceleration
losses
f - Friction losses
A- Area
C- Capacitance
caero- Aerodynamic coefficient
E- Energy F- Faradays F- Linear force
Facc- Acceleration Forces
Fbreak- Break forces
Fdrag- Drag forces
f-Frequency
fr- Coeficient of losses by friction
Fres- Resistives forces
Fslop- Slop forces
Ftract- Traction forces
g- Gravity I-Current
ima- Currant machine itrac- Currant traction J- Inertia
Kdiff-Transformation ratio
kg- Kilogram kW- Kilowat
kW/h/L- Kilowat hour per liter
Kwheels- Wheel radius
L- Inductance m-Mass
Nscp- Supercapacitors in paralele
Nscs- Supercapacitors in serie
Nsctot- Total quantity of supercapacitors
P- Electric Power p- Weight
Pacc- Power acceleration
Plosses- Electrical power losses
Pres- Power resistive
Psc- Supercapacitors power
Ptract- Power traction
R- Resistance rd- Radius
rwheels– Radius wheels
T- Torque
Tmach- Torque machine
Twheels- Torque wheels
udc- DC voltage
usc- Supercapacitos voltage v- Linear velocity
V- Voltage
W/kg- Watt per kilogram
Wh/kg- Watt hour per killogram
τ- Constant time Ω- Angular velocity
Ωdiff- Angular velocity of the differential
Ωmach- Angular velocity machine
Ωshaft- Angular velocity shaft
Ωwheels- Angular velocity of wheels
viii
Abbreviations
CO2 - Dioxide Carbone
EMR-Energetic Macroscopic Representation ESS-Energy Storage System
EV- Electrical Vehicle
H-ESS- Hybrid Energy Storage System HV- hybrid Vehicle
IM-Induction Machine
L2EP- Laboratoire d’Electrotechique et d’Electronique de Puissance Li-Ion-Lithium Ion
OCV- Open Circuit Voltage PSA- Peugeot Citroen RC- Resistance Capacity SC-Supercapacitors
SNCF- Sociéte Nationale de chemins de fer Français UC-Ultracapacitors
viii
Abstract
Nowadays the environmental preoccupations are increasing due to climate changes, the ozone hole and other effects. These consequences are mainly produced by the automobile industry, due to the thermal engines used for vehicles. This sector one of the most pollutants, 23% of emissions are caused by this sector. Therefore, it is necessary to find solutions in order to reduce these impacts. One solution is to develop electrical vehicles (EVs). These vehicles possess 0% of local pollutant emissions. However, these kind of vehicles have large costs associated to batteries and reduced autonomy in comparison with thermal vehicles. Another characteristic is that the batteries’ lifetime is limited in traction applications. So, different hybrid solutions should be studied in terms of topology and strategy.
The topology studied in his work, is composed of batteries and supercapacitors. The strategy used is a filtering strategy. The choice of this topology was due to its characteristics, constant DC-bus, high efficiency utilization of supercapacitors and simple control. The strategy possesses the advantages of dividing the power traction in high frequency and low frequency. It is advantageous because high frequencies damage the lifetime of batteries due to their low power density. Thus, the installation of supercapacitors that possess high power density will supply the high frequency part.
This work is realized with the Matlab tool Energetic Macroscopic Represnetation, EMR.
Key words: Electrical Vehicles, Energetic Macroscopic Representation, Energy Storage
1
1
Introduction
1.1 Context
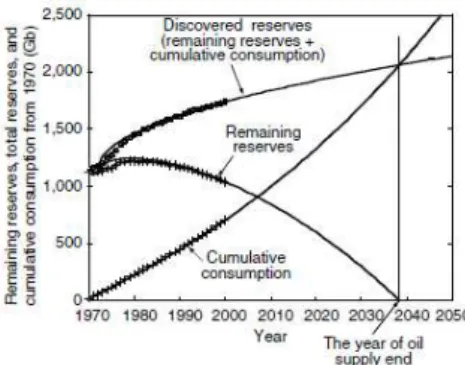
Our society is more and more concerned with environmental issues and the impact of our behaviour in the ambient (Chan and Wong 2004). These worries appear due to the climatic change and the increase of the population. The idea of sustainable development is continuously discussed and present in our quotidian. Some authors considered it as one of the major challenges of our century. One of the possible definitions for sustainable development is the capacity to consume natural resources without putting at risk future generations (Bruntland 1988). However, it is possible to observe in Figure 1 that the reality is different. Taking into account this definition, the consumption and the productivity must be equilibrate. Observing Figure 1it is possible to see that the global consumption of oil increases faster than the discovery of new wells. If this rhythm continues, it is predicted that in 2040 there will not be enough oil for the global necessities.
Figure 1-Evolution of the consumption and discovery of oil resources (Ehsani et al. 2005)
One of the causes of this consumption is the emission of greenhouse gases. These emissions cause global warming and climatic changes. Dioxide Carbone (CO2) is the main cause responsible for this effect. By dividing the levels of emissions per sector, it is possible to verify in Figure 2, that the transportation sector is one of the largest sector responsible for the emission of these gases. In Figure 2 it is also possible to observe that the road transport is the largest responsible for the emission of CO2.
1
Figure 2-Emission of CO2 in transportation per sector (International Energy Agency 2014)
Thus, the road transport is a sector where changings can allow important results in the final emissions levels of CO2 (Eurelectric 2007). One solution to solve this problem is the utilization of a new generation of vehicles. For example, electrical vehicles (EV) (Messagie, Macharis, and Van Mierlo 2013) (Eurelectric 2007) or hybrid electric vehicles (HEV). These types of vehicles have been in development in recent years due to the possibility of decreasing the impact in the environment for this sector.
However, this solution can have some drawbacks. The concept that an EV does not emit CO2 is not always true. It depends on what is considered in the study. If we consider the consumption of energy of the well of oil to the tank of the car, this emission can be different from zero. The
supply of EV’s demands an important quantity of electric energy in order to recharge the battery. This energy can be produced using different methods. Depending on the plant used for the production of electricity, the emission of CO2 can be very different (Messagie, Macharis, and Van Mierlo 2013). In some cases the production of CO2 can be more important in the EV circumstance, than in a conventional car (Messagie, Macharis, and Van Mierlo 2013). The optimal solution would be the utilization of renewable energy plants. This solution bring us to levels of emission practically null.
Another drawback of EVs is the cost of some components. The main source of energy for a EV is the battery (Karangia et al. 2013) due to their high energy density, compact size and reliability (Khaligh and Li 2010). However, this choice brings some drawbacks. The expensive cost of batteries and their short lifetime are a real problem. This has been the motivation for the development of other types of storage systems in order to improve these drawbacks.
2 diesel (Eurelectric 2007). Even with these low values of efficiency, it is enough to obtain higher range levels than in EVs. So the main disadvantages of EVs are the range and charging time (Chan and Wong 2004).
Thus, to face these drawbacks, one solution has been developed. This solution consists of creating a Hybrid Energy Storage System (H-ESS). These systems consist in joining more than one source of energy for the storage system. The main advantage is the possibility of splitting the power flow between the sources and optimize each one (Khaligh and Li 2010). There are several works regarding the application of association of different energy sources; batteries associated with thermal engine, batteries with fuel cells (Depature, Bouscayrol, and Boulon 2013) and supercapacitors (Castaings et al. 2014b)(Karangia et al. 2013) (Trovao et al. 2013) .
1.2 Subject
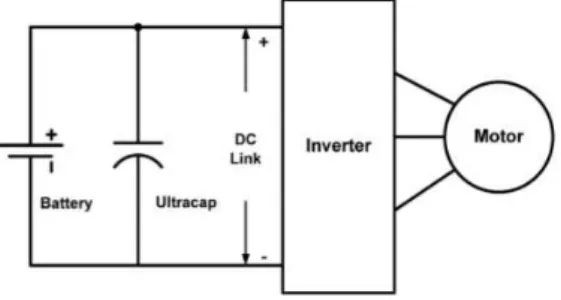
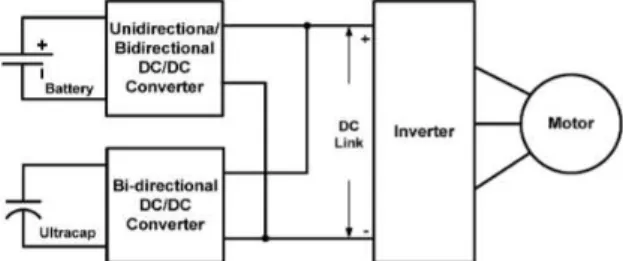
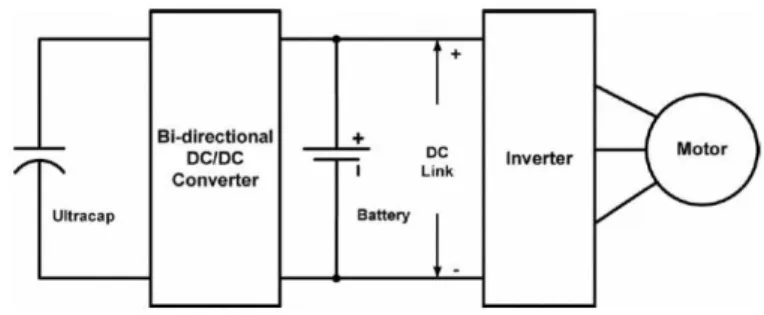
This study consists on elaborating the control of an on board H-ESS for an EV represented in Figure 3. The selected topology is shown in Figure 3.1 and is composed of batteries and supercapacitors. This subsystem is constituted by a bi-directional DC/DC converter. This converter has to be bi-directional for the recovery of energy during the deceleration or breaking moments. The storage system feeds a traction system of 15 kW, composed by an inverter, an electrical machine, a differential and wheels as shown in Figure 3.2.
Figure 3.1-H-ESS Figure 3.2-Traction System
To represent these two subsystems, a description tool is used, which was created by professors and researchers of “Laboratory of Electrical Engineering and Power Electronics, L2EP”. This tool allows to decide the model that is used, to represent it and to finally perform the simulations. This tool is a formalism that represents complex systems, Energetic Macroscopic
3 Representation, EMR (Roboam 2012) (EMRwebsite - Home n.d.). This formalism is based on the principle of causality. The main goal of this tool is to systematically deduce the control structure of the system.
The main goal of this study is to create a current strategy to control the battery current. The strategy used for this task is a frequency strategy. This strategy divides the current in high frequency and low frequency components with a low pass filter (Allegre, Bouscayrol, and Trigui 2009). The current is constituted by two components, the high frequency and the low frequency component. The high frequency part has a high level of power and the low frequency a high level of energy. Batteries have a high energy density, so they will supply this part, and supercapacitors have a high power density, so they will supply the high frequency part.
For these kinds of systems different topologies exist, passive and active topologies. The different topologies depends on the way that they are connected. This topic will be better explained in the next section.
For this study, the topology is an active one, a converter cascade topology. This topology (Figure 3.1) was chosen due to its different advantages. The advantages of this topology are:
To be able to control the power flow between the two sources;
To have a constant DC Link, due to the constant battery voltage;
More efficient utilization of supercapacitors;
The drawback of this topology is the necessity to design the converter in order to support the high peak current of supercapacitors (Cao and Emadi 2012).
1.3 State of art
In order to evaluate the EVs, there are some aspects to take into account. These aspects are mainly related with the Energy Storage System (ESS), and they are (Khaligh and Li 2010):
Energy density
Power density
Lifetime
Costs
Maintenance
4
referência não encontrada. shows the results of this hybridization. Another advantage of the
hybridization technique is the performance improvement of the vehicle in terms of (Karangia et al. 2013) (Xiaoliang, Tosiyoki, and Yoichi 2014a):
Acceleration
Increasing the range of the EV’s
Reducing the life cycle costs by extending the life of the batteries
Reducing the costs associated to the batteries
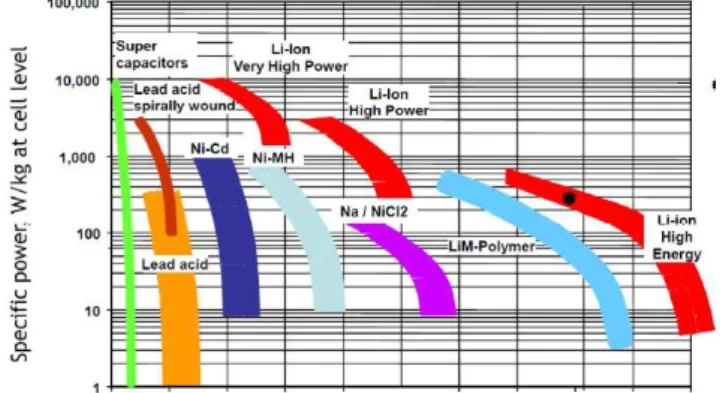
To follow a specific drive cycle, a high quantity of energy is necessary. This energy is supplied by the batteries. However, during the cycle there are moments where the current values reach important peaks, for example during accelerations or braking moments. These peaks are very prejudicial to the lifetime of batteries (Cao and Emadi 2012) (Cao, Schofield, and Emadi 2008) (Hung, Hopkins, and Mosling 1993), so, to save their lifetime, the installation of the Supercapacitors is very important. Supercapacitors possess a high power. This characteristic allows to recover the power during the braking moments and to supply peak power during the acceleration, without damaging batteries (Behjati and Davoudi 2012). Erro! Fonte de
referência não encontrada.4 shows the different values of power density and energy density
between the two sources. Another advantage of the supercapacitors is the fast recharging time. This hybridization allows to supply the vehicle in energy and power demand and recover for recharging the source of energy during the braking moments (Khaligh and Li 2010)(Karangia et al. 2013) (Xiaoliang, Tosiyoki, and Yoichi 2014b) Erro! Fonte de referência não
encontrada. shows the results of the junction of the aspects referred before.
5
Figure 5- Results of association between batteries and SC (ALLEGRE 2010)
With this system, it will be possible to supply the vehicle with power and energy without damaging the sources.
1.3.1 Hybrid Storage System (H-ESS)
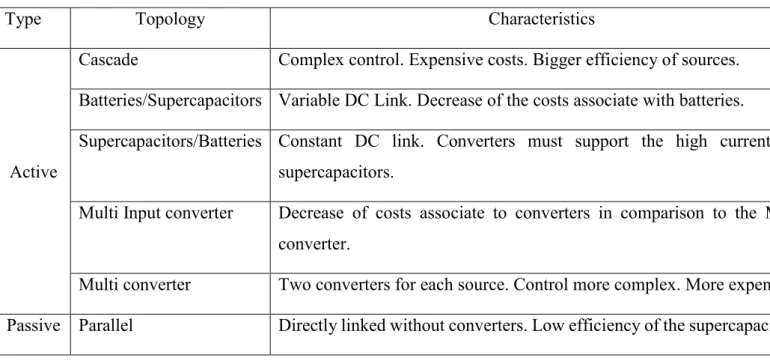
6 Table 1-Topologies of H-ESS
Type Topology Characteristics
Active
Cascade Complex control. Expensive costs. Bigger efficiency of sources. Batteries/Supercapacitors Variable DC Link. Decrease of the costs associate with batteries.
Supercapacitors/Batteries Constant DC link. Converters must support the high currents of supercapacitors.
Multi Input converter Decrease of costs associate to converters in comparison to the Multi converter.
Multi converter Two converters for each source. Control more complex. More expensive. Passive Parallel Directly linked without converters. Low efficiency of the supercapacitors.
Passive system
Figure 6 demonstrates a passive system. It has the two sources directly connected in parallel (Cao and Emadi 2012) (Lukic et al. 2006).
This topology has the advantage of being simple of implementation, due to the absence of power electronics converters (Cao and Emadi 2012) (Behjati and Davoudi 2012). Its drawback is the impossibility to control the power flow between the two sources. In these topologies, the supercapacitors do not deliver all the stored energy. This is due to the fact that the batteries voltage is higher than the supercapacitors voltage. The capacitors in this topology have a low efficiency. The efficiency of supercapacitors is related with the quantity of energy they can deliver. In this topology, this quantity is never the total stored. This happens because supercapacitors are connected directly with the battery.
The energy delivered by supercapacitors is given by equation (1):
Where c is the capacitance of the supercapacitor This value, given in Faraday (F), is the difference between the final voltage and the initial voltage. Since these two sources are directly connected in parallel, the voltage is the same. Consequently, the energy delivered by supercapacitors will never be the nominal. In these topologies, the supercapacitor is used as a
v c sc
2
2 1
7 low pass filter (Blanes et al. 2013). This application is not usually used for industrial applications (Behjati and Davoudi 2012).
Figure 6-Passive system (Cao and Emadi 2012)
Active systems
An active system is an improvement of the passive system. That improvement is accomplished with the placement of a power electronic converter. This converter will enable the control of the power flux between the sources. With the addition of this converter, the following advantages are obtained (Gao, Dougal, and Liu 2005):
Higher flexibility in the capacity of the batteries and the supercapacitors; More power capacity;
DC link more constant;
The weight of the power source can be smaller ;
The converter can also serve as a regulator for the charging of the batteries.
There are different topologies of active systems. The different topologies are chosen depending on the strategies used, the voltage or on the application that will be used.
The active systems can have different topologies: One converter:
o Battery/Supercapacitors; o Supercapacitors/Batteries;
Multiple converter configuration;
Multiple input-converter configuration;
8
One converter topology Batteries/Ultracapacitors
With this topology, it is possible to have a smaller battery voltage. It is used for batteries where the battery capacity is smaller. With this topology it is possible to decrease the weight of batteries and associated costs. The supercapacitor will be used as a low pass filter and will supply the DC Bus voltage between voltage values that the supercapacitors allow (Cao and Emadi 2012). In Figure 7 it is possible to verify the connection between the batteries and supercapacitors.
Figure 7-Batteries/Supercapacitors (Cao and Emadi 2012)
Cascaded configuration
This topology is the same as the previous one, however, for a better control of the supercapacitors, a second converter is added, as Figure 8 demonstrates, (Cao and Emadi 2012). With this topology it is possible to control separately the state of charge of the sources and to control the DC bus with the second converter (Behjati and Davoudi 2012).
Figure 8-Cascaded configuration (Cao and Emadi 2012)
Multiple converter configuration
9
Figure 9-Multiple converter configuration (Cao and Emadi 2012)
Multiple input converter configuration
With the configuration of Figure 9 one of the drawbacks is the cost associated to the two converters. In order to reduce these costs the topology of Figure 10 is proposed (Cao and Emadi 2012). Other advantages are the reduction of the complexity and the size of the H-ESS (Behjati and Davoudi 2012).
Figure 10-Multiple input converter configuration
1.3.2 Strategies of Energy Managment
For optimizing the distribution of power flow between the sources, a strategy management is created to decide the quantity of power that each source will supply in function of the subsystem traction demands. These strategies can be more or less complex depending of the concerning HESS. The strategy is an important factor in the efficiency of the H-ESS, so it is important to define it correctly.
10 These strategies are easy to implement and the computation time is smaller in comparison with the optimization strategies, however they do not ensure the optimal result.
The strategies based on optimization can be divided in two different sub categories, global optimization or real-time sub-optimal solutions. These strategies based on optimization are defined by the physical limitations of the system and allow an optimal solution.
Other strategies are based in rule strategies. The choice of this kind of strategies was made by the simplicty of the implementation and due to the smaller calculation time. Some of these strategies are presented below:
Resistance Strategy
Some works developed a strategy based in the internal resistance of the energy sources (ALLEGRE 2010). The aim of this strategy is to reduce losses of the ESS. As we know, the losses are equal to PlossesRI2 so, to decrease these losses, the source that will provide the demand of current will be the source with the smaller resistance. In this case, between supercapacitors and batteries the supercapacitors contain a smaller resistance.
Switching Strategy
These strategies consist on the utilization, at the same time, of just one source to supply the traction system. The choice is made in function of the State of Charge (SOC) and of the power losses of each of them. As the supercapacitors possess a higher efficiency than batteries, the supercapacitors are more used. However, when the supercapacitors voltage becomes too small it makes a smooth transition to batteries, the smooth transition is realized to avoid peak current (Allègre, Bouscayrol, and Trigui 2013).
Frequency strategy
11 reasons, the high frequency is supplied by supercapacitors and the low frequency by batteries (Xiaoliang, Hiramatsu, and Yoichi 2013). Therefore, battery stress will be lower due to the peak power necessary for the traction subsystem been supplied by supercapacitors. In consequence, it is expected that the batteries lifetime increase.
Variable saturation strategy (ALLEGRE 2010)
The goal of this strategy is to limit the power received and supplied by the batteries. The batteries supply the system until this value is equal or smaller than their saturation current. If the current is higher, the supercapacitors will supply the rest of the current necessary.
Acceleration strategy
This strategy was tested in some studies as shown in (ALLEGRE 2010).
For the movement of the vehicle it is necessary to apply a force to the vehicle. This force, Ftract
can be decomposed in in two different forces, acceleration forcesFacc, and the resistive forces
to the movement,Fres. In the acceleration moments more power is necessary, so it will be
supplied by the supercapacitors.
Equation (4) results from equation (2) expressed in power where Pacc is acceleration power and
Pres is resistive power. Normally the demand of power is higher in the Pacc than in Pres so the
supercapacitors supply the acceleration and batteries supply the constant power.
1.4 Laboratory of Electrical Engineering and Power Electronics (L2EP)
This work was developed in collaboration with the control team of the “Laboratory of Electrical Engineering and Power Electronics of Lille”. The control team of L2EP is specialized in the control of electromechanical systems (Bouscayrol et al. 2009). They are specialized in new generation transports (Letrouve et al. 2012)
(Verhille et al. 2006), like subways, hybrid trains (Mayet et al. 2013), marine propulsion (Zahr, Semail, and Scuiller 2014) and energy system storage for electrical and hybrid vehicles. They
F
F
F
tract
acc
res (2)Ma
F
acc
(3)P
P
acc restract
12 work with industrial partners like Alstom, PSA Peugeot Citroën, Siemens, SNCF, Valeo. They also have collaborations with laboratories around the world for example, Canada, Argentina, China and Switzerland. These collaborations allow the realization of common projects.
1.5 Outline of the work
The structure of this work is divided in three essential parts.
1. Presentation of EMR formalism.
In this part, the goal is to present the tool which was used in order to understand all the construction processes for the representation of the system. For the correct use of the tool, it is necessary to know how to work with it. For this, rules and principles of good uses will be presented. In addition, this tool contains some techniques to solve conflicts that can appear during the construction of the representation system. All these characteristics are present in chapter 2 section.
2. Modelling part.
All models used for the realization of the system will be presented in chapter 2. An accurate model is important in order to obtain good results and a good accuracy for the global system. These models can be different depending of the phenomena to be studied. The modelled subsystems are the traction subsystem and the Hybrid Energy Storage System, “H-EES”. The traction subsystem is modelled based on the vehicle “Tazzari” (commercial EV of “L2EP”). The mass of the vehicle is 542 kg and it is constituted by an induction machine of 15 kW, a gear box, a differential and mechanical braking. Batteries, supercapacitors, and a bi-directional converter constitute the H-ESS system. The batteries pack impose a voltage of 78 V and the supercapacitors bank, 60V.
During the construction of a system, it is possible to find some conflicts of association. For these conflicts there are EMR rules to solve them. These conflicts will be identified.
3. Control part and results.
14
2
Energetic Macroscopic Representation (EMR)
As it was previously referred, to represent the studied system the tool used is EMR. In this chapter, this tool will be presented and all the characteristics will be explained.
EMR is a graphic tool that allows the representation of complex system for control purpose. The principle used by EMR is the principle of a interaction between the different connected systems (BOUSCAYROL, HAUTIER, and LEMAIRE-SEMAIL 2012). It is put in evidence the energetic characteristics of each subsystem. These different subsystems can be source, accumulation, distribution and conversion of energy. These four subsystems are represented by four different pictogram shown in ANNEX A. EMR can be described as follows:
Energetic- exchange of energy between subsystems considering to the causality principle
related to energy;
Macroscopic- exchange of energy between subsystems considering to the interaction principle
without focusing on internal relations;
Representation- allowing the organization of the mathematic models or other kind of models;
2.1 Representation of pictograms
2.1.1 Source element
The source element is the subsystem that describes the external environment of the system. These pictograms are always in the extremities of the system. They represent the environment where systems are localized. They can be a generator or a receptor and have an input vector and output vector. In EMR the sources are represented by oval green pictograms (BOUSCAYROL, HAUTIER, and LEMAIRE-SEMAIL 2012). One example can be the traction system of the studied system which will be explained in the next section shown in (Figure 11).
ubatt
Batt
ibatt
15 2.1.2 Accumulation element
This element exhibits an accumulation of energy. Its inputs and outputs are already defined because of the causality. This pictogram is described by a crossed orange rectangle. The oblique bar imposes a delay between the input and output. This subsystem has one input and output in the downstream and one input and output in the upstream. These outputs and inputs can be vector or scalar (BOUSCAYROL, HAUTIER, and LEMAIRE-SEMAIL 2012). One example of an accumulation element is shown in Figure 12.
Tdif Tmach
Ωshaft
Ωshaft
Figure 12- Accumulation element
2.1.3 Mono-Physical/Multi-Physical Conversion Element-
The mono-physical conversion element allows the transformation without changing the domain Figure 13(a). The multi-physical conversion element allows the transformation of energy between different domains Figure 13(b). These elements do not have energy storage. They can have losses or not. For the conversion of energy, it is possible to use a third input. It possess two pairs of inputs and outputs, one in the upstream and other in the downstream. It can also have a tuning input; this input can be a vector or a scalar. This allows the management and the conversion of the energy (BOUSCAYROL, HAUTIER, and LEMAIRE-SEMAIL 2012)
Ωwheels
Tmach
Ωmach
Twheels
(a)
Ωmach udc
itrac
Tmach
(b)
Figure 13- Figure (a) Mono-Physical Figure (b) Multi-Physical
16 This pictogram is represented by overlapped squares when it represents mono-physical coupling, for example the distribution of forces in Figure 24, or by overlapped squares when the coupling is multi-physical. This coupling does not have accumulation of energy and can or not have losses. It can have m inputs and outputs in the downstream and n inputs and outputs vector in the upstream. There are three possibilities for characterizing this element (BOUSCAYROL, HAUTIER, and LEMAIRE-SEMAIL 2012):
Downstream, when m>n, the function is to collect energy
Upstream, when n>m, the function is to divide the energy and to provide more flows
Neutral, m=n, the function is to reorganize the energy flow
vvehi
Fwheels
vvehi
Ftot
(23)
Fbreak
vvehi
Figure 14- Coupling element
2.2 Associations rules
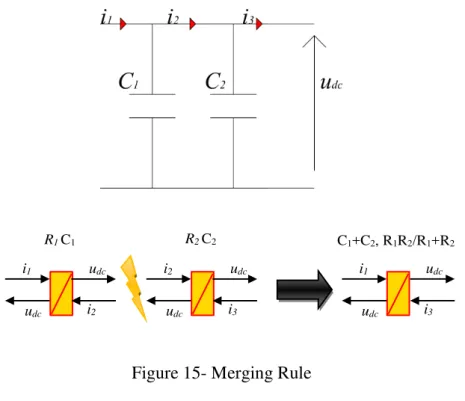
2.2.1 Merging rule
17
i2
i1
udc
udc
i3
i2
udc
udc
i3
i1
udc
udc
R1 C1 R2 C2 C1+C2, R1R2/R1+R2
Figure 15- Merging Rule
2.2.2 Permutation rule
The permutation rule consists in doing the permutation of two elements maintaining the same global input and output. This allows verifying the virtual subsystem necessary to obtain the same output. Figure 12 demonstrated a case of permutation. This happens because the shaft imposes that the output must be the angular velocity, and the input of the chassis must be the force that will be applied. This happens due to the characteristics of these elements that will be explained further on.
Ωmach
Tmach
Ind. Machine
inv
udc
Tdiff
Ωmach
Shaft
Twheels
Ωwheel
Differential
Fwheels
vvehi
Wheels
Fres
vvehi
Chassi
vvehi
Ftot
Tmach_ref
(21) (16) (5) (6) (18)
H-ESS Env
Figure 16- Conflict of association
To solve this problem the differential and the wheels are merged in one unique element creating a new factor conversion. For the calculus of the new relation, it is necessary to find the relation between the rotation speed of the shaft mach and the velocity of the vehicle vvehi and also to
18
Tdiff. Equation (5) and (6) represent the differential and the wheels. These elements are
represented by two equations:
The new relation between Tmach and F’ is equal to:
With: Ftot F’ vvehi vvehi Ωmach Tmach Wheels + Differential Chassis (7) (17)
Figure 17- Equivalent virtual element
After implementing the permutation it is possible to merge the two accumulation elements in just one because they have the same output variable.
19
2.3 Traction subsystem
In this section the EMR and the control of the traction subsystem is represented. All the subsystems by which it is composed are also explained. For the development of the H-ESS, it is necessary to understand the behaviour of the vehicle and all of these subsystems and it is fundamental to know which model to use for each subsystem.
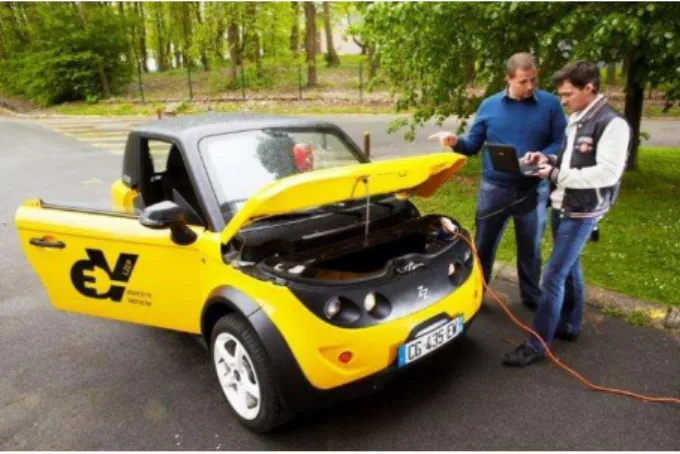
For the traction subsystem the parameters of the electrical vehicle, “Tazzari” were used. This vehicle belongs to L2EP and it is usually used in the laboratory for the development of projects and research.
Figure 18-Tazzari EV
The EV has a mass of 542 kg and its traction subsystem is constituted of one gearbox ratio, one differential and an electrical induction machine of 15 kW supplied by a voltage source inverter (Depature et al. 2014).
20
Table 2- Dynamics parameters
Name Symbol Value Units
Mass M 542 kg
Gravity force g 9.8 m/s2
Rolling coefficient fr 0.02 -
Aerodynamic
coefficient caero 0.7 -
Air density � 1.2223 kg/m2
Surface contact A 2 m
2.3.1 Traction subsystem model
Environment
The environment is a source of force, Fres,, as represented in Figure 21. This source is composed
by all the resistive forces to the vehicle movement. Three different forces are considered, the rolling resistance, aerodynamic forces and the grading resistance (Ehsani et al. 2005)
.
The input is the velocity of the vehicle and consequently the output is the resistive force. The EMR pictogram of this subsystem is described in Figure 21.Rolling Resistance
Frol represents the forces between the road and the wheels. These forces are influenced by the
characteristics of the tire. The torque produced by this interaction ,Tr, is equal to:
) ( ) ( ) ( )
(t F rol t F drag t F slop t
F res (9)
21 Where pis the weight and ais the acceleration.
To pass this torque in horizontal force it is necessary to divide equation (11) by the radius of the tire resulting in:
The interaction between the tire and the road can be translated by a horizontal force in the center of the tire in opposition to the movement, where p is the normal force and fr the rolling resistance
coefficient. This coefficient depends on the temperatures, material, structure, tire inflation geometry, road roughness, road material, and the presence or not of liquid in the road (Ehsani et al. 2005).
The studied system possesses a rolling resistance of 0.02.
Aerodynamic forces
With a certain speed, the forces caused by the air start to have an important impact in the effort made by the traction system. These forces result of two aspects, the shape of the vehicle and skin friction. This force is equal to:
In order to simplify the calculus and problem of form, the vwind was considered equal to zero.
The surface in contact with the air is represented by the variable A, and the density of the air by the variable �. The caero represents the impact of the shape in this force. The smaller this
coefficient is the better the aerodynamics behaviour will be. In ANNEX B it is possible to observe the different coefficients and the aspect of the vehicle.
pa
Tr (11)
f
p
r
pa
r
T
F
rd d
r
(12)
v v
v c A tFdrag wind vehi aero
2
2 1 )
22
Slope forces
During the climbing of a slope, the vehicle is submitted to natural forces caused by the inclination of this slope.as represented in Figure 20:
Figure 20-Climb forces
The slope force represents the force in opposite to the movement during the climbing. This force is influenced by the mass of the vehicle, Mvehi, and the angle of the inclination,
. Theequation is equal to:
Fres
Env
vvehi
(9)
Figure 21- Environment pictogram
Mechanical brake- The mechanical brake is represented by a source of force as shown in Figure 22. The effect of this is just the application of an opposite force to the movement. The force reference is delivered by the control. In the next chapter, it will be explained, what is considered in the calculus of that force and how it is calculated.
gp M gp
M t
23
Fbreak
Env
vvehi
(15)
Fbreak_ref
Figure 22- Mechanical Break pictogram
Machine shaft- The shaft is represented by an accumulation element as shown in Figure 23. This part allows the connection of the electrical machine to the wheels and consequently causes the movement of the vehicle. The output is the torque due to the principle of causality. Equation (16) represents the shaft equation with J equal to the inertia of the shaft and flossesequal to the losses by friction. Trr is the torque applied in the shaft, this torque is the same that Tmach.
Tdif Tmach
Ωshaft
Ωshaft (16)
Figure 23-Shaft pictogram
Applying the Laplace transformation to (16) result in:
Chassis of the vehicle- The chassis represents all the rigid components of the vehicle. In EMR, it is represented by an accumulation element, where the output is the velocity and the input, the
F
F
breake_ref
break (15)
t f
tdt d J t T t
Tmach rr shaft lossesshaft (16)
losses dif mach
shaft
f Js
s T s T t
24 force that will be actuating in the vehicle. In this subsystem all the inertias are represented (Bouscayrol 2003). The subsystem is represented in Figure 24.
Fres Ftot
vvehi
vvehi (18)
Figure 24- Chassis pictogram
Applying the Laplace transformation to (18) result in:
Differential:The differential splits the torque produced by the Electrical Machine between the two wheels. Tdiff has to be always higher than Tmach. For this study, it is considered that the two
traction wheels of the vehicle are in the same type of surface and always in strength trajectory, therefore, the torque is equally divided between the two wheels. The equations (20) and Figure 25 describe this subsystem.
Ωwheels
Tmach
Ωmach
Twheels
(20)
Figure 25 - Differential Pictogram
v
tdt d m t F t
Ftot res vehi (18)
ms s F s F svvehi tot res
25
Wheels: the effect of wheels in the system is to transform the torque into a linear force and the radius speed into a linear speed. For this, it is just necessary to introduce a gain. This gain, in fact, is the radius of the wheel. These relations are demonstrated in equation (21) and the pictogram is demonstrated in Figure 26.
vvehi
Twheels
Ωwheels
Fwheel
(21)
Figure 26- Wheel pictogram
Asynchronous Machine- It is represented by a multi-domain converter as shown in Figure 27. The electric power received by the storage subsystem is transformed into a mechanical power Tmach.
The model given by the L2EP is a static-model. The efficiency map was obtained with dynamic simulations. The efficiency map is expressed in function of the velocity and the torque. The model represents the inverter of the electrical machine and the Induction Machine, (IM). The torque reference is given in order to know the traction current, which will be necessary to supply. This current, itrac, is obtained with the equation (22).
Table 3 shows the advantages and drawbacks of the utilization of this type of model.
r v
r T F
wheel vehi wheels
wheel wheels wheel
1 1
26
Table 3- Characteristics of Static Model (Letrouvé et al. 2010)
Advantages Drawbacks Used
-Simulation time -No dynamic is taken into account
- Modelling simplicity,
- Needs a high precision losses table
Study of power and energy during steady states Ωmach udc itrac Tmach (22) Tmach_ref
Figure 27- Asynchronous Machine
Brake system- This subsystem is represented by a coupling element. In this subsystem there are two different forces actuating. One is the force caused by the electrical machine and the other is the mechanical brake.
27 vvehi Fwheels vvehi Ftot (23) Fbreak vvehi
Figure 28- Chassis pictogram
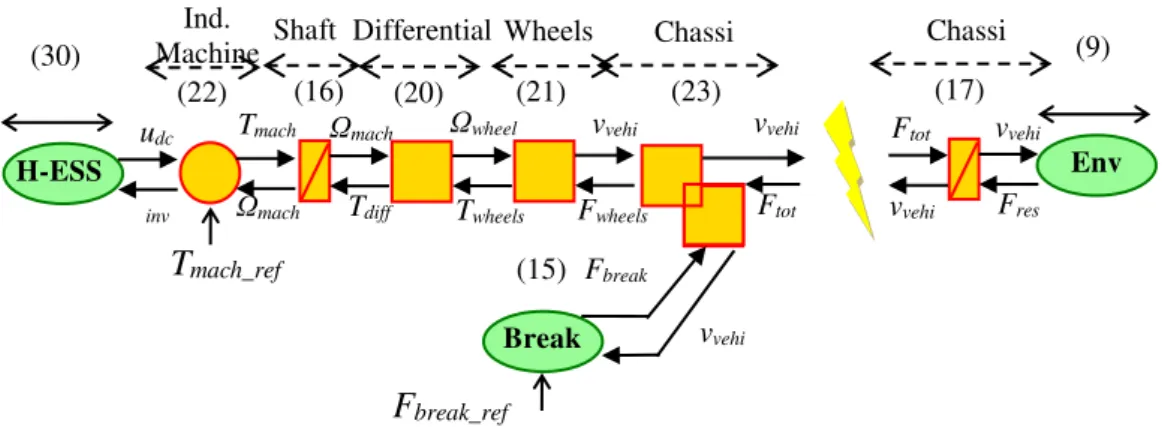
2.3.2 Conflict of associations
During the construction of the EMR it is possible to observe that there is a conflict of association between the wheels and the chassis. This conflict can be observed in Figure 29. The wheels have the velocity, vvehi as output but the chassis requires the force as input, Ftot
.
This happensdue to the principle of causality used in the accumulation elements. These elements impose their outputs and inputs. So, it is necessary to respect them. To solve this problem it will be necessary to apply some rules.
Ωmach Tmach (22) Ind. Machine H-ESS (30) inv udc Tdiff Ωmach (16) Shaft Twheels Ωwheel Differential (20) Fwheels vvehi Wheels (21) Fres vvehi (17) Chassi vvehi Ftot Env (9) Tmach_ref Ftot vvehi (23) Chassi Fbreak vvehi Break (15) Fbreak_ref
Figure 29-Conflict of association
Permutation rules:
The shaft is permutated with the differential and the wheels. However, it is necessary that the final inputs and outputs of the resulting system remain the same.
28 Tdif Tmach Ωmach Ωmach (24)
Figure 30- Shaft pictogram
For the simplification of the resolution of the problem, the differential and the wheels are considered as a gain K’ as shown in Figure 31.
T wheels Ωmach Tdif Ωwheel Ftot vvehi K’
Figure 31- Association of the two blocks
The result of the permutation of the equation (24) is given by the equation (25). By changing the variable on the equation (24) the new relation is:
The result of the junction of this two components result in the equation (25). The permutation of this new block K’ with the shaft results in Figure 28. This permutation result in the. equation shaft (26).
t f
tdt d J t T t
Tmach dif mach lossesmach (24)
29 Ftot F’ vvehi vvehi Ωmach Tmach (27) (17) Wheels + Differential Shaft
Figure 32- Permutation
Merging rules:
After the permutation, the shaft and the chassis possess the same state variable so it is possible to merge these two elements in just an equivalent one. Therefore, the new values of the friction losses and the new mass are given by the equation (28):
The changes effectuated leadto the EMR model represented in Figure 33.
Ωmach Tmach H-ESS itrac udc Ωwheels Twheel
Differential Wheels
Fres vvehi Chassis vvehi Fwhell Env Tmach_ref vvehi Ftot I.M Break Fbreak vvehi
(22) (20) (21) (23) (17)
(9) (30)
(15)
Figure 33-EMR of Traction Subsystem
2.4 Hybrid Energy Storage System (H-ESS)
K t v dt d J t F tFtot tot vehi 2
1
' (27)
m K
J
mequ 2 vehi
K f
f losses
equi
losses 2
(28)
' ( )' 1
' 2 f K v t
K t v dt d m t F t
30 In this chapter, the EMR and the model used for each parts of the H-ESS will be presented. Figure 30 represents the topology used. This subsystem is already referred as being composed by batteries, supercapacitors and a bidirectional DC/DC Converter.
Figure 34- Schematic of H-ESS
2.4.1 Model of H-ESS
Sources of energy
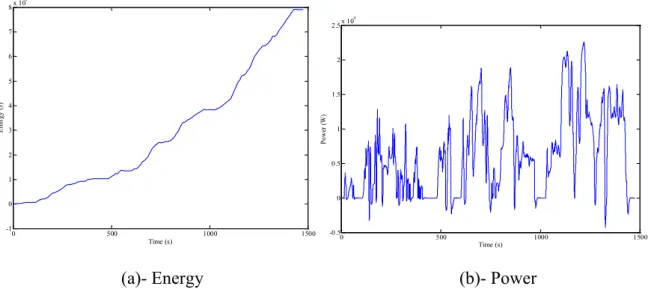
31 (a)- Energy (b)- Power
Figure 35- Energy and Power demand
Batteries- This battery bank is the battery bank of the Tazzari vehicle.
The battery bank is considered as a voltage source, imposing the DC voltage. The batteries model used is a static-model. This model was developed by L2EP. It is an OCV with a series resistance as shown in Figure 36. The map was obtained with dynamical simulations. In ANNEX C the characteristics of the type of batteries are given. The EMR pictogram represented in Figure 33 is a source of voltage. Equation (30) represents the equation of the voltage in function of the current battery, with the constant time.
Figure 36- Schematic of the Battery model
0 500 1000 1500
-1 0 1 2 3 4 5 6 7
8x 10
6 Time (s) E n er g y ( J)
0 500 1000 1500
-0.5 0 0.5 1 1.5 2 2.5x 10
4 Time (s) P o w er ( W ) s i
ubatt batt
32
ubatt
Batt
ibatt
(30)
Figure 37- Pictogram of batteries
Sizing of battery bank
As it was already explained, the batteries possess a high energy density, so, it is that source that will insure the energy necessary for the vehicle during the trajectory. For this, it is necessary to size the bank battery in energy. However the bank used in this study is the bank of the “Tazzari” vehicle. This model was realize by the “L2EP”. The characteristics are presented in Table 4 and ANNEX D.
Table 4- Characteristics of the battery
Battery used Energy density (Wh/kg) Capacity (Ah)
Li-On 80 160
Supercapacitors
The model used for the supercapacitors is a RC series model. The value of the series resistance is given by the manufacturer. The convention considered is the generator convention, represented in equation (31), with usc the supercapacitors voltage, Rs the internal resistance, isc
the supercapacitos current and C the capacity . In ANNEX D the information about the chosen superacapacitors are presented. The voltage of the supercapacitors voltage is 60 V.
33
Figure 38- Supercapacitors model
usc
SC
isc
(32)
Figure 39- Pictogram Supercapacitors
Sizing of Supercapacitors
The design of the supercapacitors was done considering power. The equation used for calculating the power of one supercapacitors given by, Psc, is demonstrated in equation (33).
With usc the nominal voltage of the supercapacitors, Rs is the resistance series. In order to know
the quantity of supercapacitors, Nsctot, necessary to supply the demand of power of the traction
system, Ptractot,the next equation must be done:
After calculating the power of each supercapacitors, it is necessary to decide the voltage of the supercapacitors bank, uscbank, depending on the voltage of one supercapacitor, usc. This voltage
will decide the number of supercapacitors in series, Nscs.
R u P
s sc sc
2 12 . 0
(33)
P
P
N
sc tractot
34 To reach the necessary power it is necessary to increase the capacity, for this it is also necessary to calculate the quantity of supercapacitors to put in parallel, this value is given Nscp, and the
equation is equal to equation (36):
Sizing of supercapacitors for the studied case
The power of supercapacitors was calculated with a security margin of 10%. This value reaches 24 kW. Therefore, the supercapacitors must be sized in a way to be able to supply the system demand. For this it is necessary to apply the equations previously explained.
For calculating the power of supercapacitors equation (33) is used. With usc and Rs, equal to
three miliohms
Afterwards, to calculate the power of each supercapacitor, it is necessary to calculate the quantity that will be necessary. For this, the following equation (35) is used
To have an exact value, 103 are selected. After knowing the quantity necessary, it is necessary to decide the voltage of the supercapacitors bank to calculate the number of supercapacitors that to have to be put in series.
u
u
N
sc scbank
scs
(35)N
N
N
scs sctot
scp
(36)W
Psc 234
10 . 2 . 3
5 122 . 0
3
2
(37)
5 . 102 234
10 . 4 ,
2 3
35
Inductance-The inductance imposes an accumulation of energy. This accumulation will cause a delay between the input and the output. So this element is used to represent an accumulation element. The equation of this subsystem is given by equation (39). This inductance is used to smooth the current of the supercapacitor.
Applying the Laplace transformation to equation (39) result in:
uchop
usc
isc
i
sc(40)
Figure 40- Pictogram of inductance
Chopper- The chopper is a bidirectional DC/DC converter. For this type of application, it has to be a buck/boost converter. In this case, this subsystem allows controlling the power flux between the two sources. As explained previously, it has the capacity to recover energy during braking. Thus, the converter has to be able to receive this energy and to transfer it to the supercapacitors. It also must be able to control the power flux when this flux has the direction of supercapacitors to the traction system.
Depending on the signal power traction the converter will work in different ways. When the system works in traction mode, positive power, the converter will work in boost mode. However, when the system is in regenerative mode, negative power, it will work in buck mode (Wangsupphaphol et al. 2014).
i
t Ri (t) dtd L t u t
usc chop sc sc (39)
R Ls
s u s u s
isc sc chop
( ) ( )
)
36 DC Bus
Charge
Figure 41- Configuration of the DC-DC converter
Equations of the chopper are given in equation (41)
ubatt isc uchop ichop (41) mchop
Figure 42- Pictogram of DC/DC Converter
Coupling The coupling element is the junction of two different currents. The equation of this subsystem is given by equation (42).
37
itrac
ichop
ubatt
ubatt
(42)
ubatt
ibatt
Figure 43- Coupling of the current
After presenting all subsystems, the EMR of the H-ESS subsystem is given by Figure 44.
SC
uchop
isc
ubatt
ichop p
Inductance
isc
usc
Couplage
Batt Chopper
T.S (22)
itrac
ubatt
ubatt
ibatt
m
(40) (41) (42) (30) (32)
Figure 44- H-ESS EMR
In Table 5 the characteristics of the main components of the system are demonstrated.
After defining all the models of each components of the system, it necessary to know how the control will be organized, where will the controllers be installed and which variables are necessary to control.
Table 5- Main characteristics of the system
Batteries voltage 78 Volts
Bank Supercapacitors 52 Faradays and 60 Volts
Induction Machine 15 kW
Vehicle 542 kg