Waist circumference and waist circumference to
height ratios of Kaingáng indigenous adolescents
from the State of Rio Grande do Sul, Brazil
Circunferência da cintura e circunferência da
cintura/estatura entre adolescentes indígenas
Kaingáng do Rio Grande do Sul, Brasil
1 Faculdade de Enfermagem, Universidade Federal de Minas Gerais, Belo Horizonte, Brasil.
2 Instituto de Estudos em Saúde Coletiva, Universidade Federal do Rio de Janeiro, Rio de Janeiro, Brasil. 3 Instituto de Nutrição Josué de Castro, Universidade Federal do Rio de Janeiro, Rio de Janeiro, Brasil. 4 Faculdade de Saúde Pública, Universidade de São Paulo, São Paulo, Brasil. 5 Departamento de Nutrição, Universidade Federal de Santa Catarina, Florianópolis, Brasil. 6 Faculdade de Medicina, Universidade Federal do Rio Grande do Sul, Porto Alegre, Brasil.
Correspondence T. G. Castro Departamento de Enfermagem Materno-Infantil e Saúde Pública, Faculdade de Enfermagem, Universidade Federal de Minas Gerais. Av. Alfredo Balena 190, Belo Horizonte, MG 30130-100, Brasil. [email protected]
Teresa Gontijo de Castro 1
Laura A. Barufaldi 2
Michael Maia Schlüssel 3
Wolney Lisboa Conde 4
Maurício Soares Leite 5
Ilaine Schuch 6
Abstract
The aim of this study was to describe the distri-bution of waist circumference ( WC) and WC to height ( WCTH) values among Kaingáng indig-enous adolescents in order to estimate the preva-lence of high WCTH values and evaluate the cor-relation between WC and WCTH and body mass index (BMI)-for-age. A total of 1,803 indigenous adolescents were evaluated using a school-based cross-sectional study. WCTH values > 0.5 were considered high. Higher mean WC and WCTH values were observed for girls in all age catego-ries. WCTH values > 0.5 were observed in 25.68% of the overall sample of adolescents. Mean WC and WCTH values were significantly higher for adolescents with BMI/age z-scores > 2 than for those with normal z-scores. The correlation co-efficients of WC and WCTH for BMI/age were r = 0.68 and 0.76, respectively, for boys, and r = 0.79 and 0.80, respectively, for girls. This study high-lights elevated mean WC and WCTH values and high prevalence of abdominal obesity among Kaingáng indigenous adolescents.
Anthropometry; Abdominal Obesity; Indigenous Population; Health of Indigenous Peoples
Introduction
In recent decades, studies have shown a rapid and pronounced increase in the worldwide prev-alence of obesity, including child and adolescent obesity, reaching epidemic proportions 1.
Stud-ies have also shown a high prevalence of obesity in indigenous adolescents from certain ethnic groups 2,3,4,5 and have suggested that socioeco-nomic and cultural transformations resulting from contact with surrounding societies are the main cause 6,7,8.
In a previous publication 4, the population of the present study was characterized by a high prevalence of overweight, according to body mass index (BMI)-for-age, and low height/age index values 9. The prevalence of overweight ob-served among male and female adolescents was 5% and 8.6%, respectively. Z-scores lower than -2 for height/age were observed in 21.2% of male adolescents and in 18.5% of all adolescents 4.
The literature indicates that obesity in adoles-cence may persist into adulthood, increasing the risk of cardiovascular and metabolic problems; however, consensus remains elusive about the most valid method of identifying overweight/obe-sity in these individuals 10. BMI is the most widely used anthropometric method for assessing nutri-tional status in epidemiological studies due to its simplicity and low cost 11,12. BMI has shown good
diag-nosis of overweight and obesity 13 and in assessing
the risk of cardiovascular disease 14. Despite these advantages, the various BMI cut-off points used for diagnosis in empirical studies 9,15,16,17 have made it difficult to determine a baseline refer-ence, and thus a consistent estimate of the mag-nitude and evolution of obesity.
Abdominal obesity, defined as the excessive accumulation of central subcutaneous and vis-ceral fat, has emerged as an important predictor of metabolic complications and adverse health ef-fects. It has been associated with metabolic syn-drome, type 2 diabetes and cardiovascular disease in adults 18,19, as well as with increased cardiovas-cular and metabolic risks in children and adoles-cents 20,21,22. Furthermore, the association be-tween abdominal obesity and cardiovascular risk appears to hold true regardless of body weight status 23.
In line with these findings, waist circumfer-ence (WC) and waist circumfercircumfer-ence to height (WCTH) have been proposed as measures of obesity and central adiposity 23. Studies have shown that these parameters are better predic-tors of cardiovascular risk than an assessment using BMI alone 19,24. For example, one study of an Australian indigenous population described improvement of cardiovascular risk prediction using measurements of WC and WCTH 25.
Us-ing WCTH has a specific advantage over usUs-ing WC alone, because the height adjustment allows the establishment of a single cut-off point ap-plicable to the general population, regardless of gender, age and ethnicity 22.
Few studies have evaluated patterns of ab-dominal obesity in Brazilian indigenous popula-tions or indigenous populapopula-tions of other coun-tries. Notably, the few available studies have shown that obesity is an increasingly common outcome affecting indigenous adults, adoles-cents and children 4,26,27. The lack of research on
this topic combined with alarming results from existing studies highlights the relevance of the present research in building a broad epidemio-logical scenario for indigenous populations. The objective of this study therefore was to describe the distribution of WC and WCTH measure-ments among Kaingáng indigenous adolescents attending schools in the State of Rio Grande do Sul, Brazil in order to determine the prevalence of high WCTH values among adolescents and evaluate the correlation between WC and WCTH and BMI-for-age.
Methods
This study used a school-based, cross-sectional approach and was conducted in all 35 schools in the Kaingáng Indigenous Territories (ITs) in the State of Rio Grande do Sul whose land tenure had been recognised by the National Indian Founda-tion (Fundação Nacional do Índio – FUNAI) at the time of data collection. The study population consisted of all adolescents aged between 10 and 19 years 28 enrolled in the schools involved in the project. The Kaingáng people belong to the Mac-ro-Jê linguistic trunk and have been in continu-ous contact with the non-indigencontinu-ous population since the eighteenth century. They are one of the largest indigenous populations in the country, with approximately 30,000 individuals distrib-uted throughout 30 ITs in the states of São Paulo, Paraná, Santa Catarina and Rio Grande do Sul 29
recognized by the FUNAI in 2008, of which 12 are located in the State of Rio Grande do Sul. The 35 schools studied are distributed among these 12 ITs: Guarita, Iraí, Monte Caseros, Carreteiro, Ventarra, Nonoai, Cacique Doble, Carreteiro, Inhacorá, Ligeiro, Rio da Várzea and Serrinha.
A team was trained in the indigenous commu-nities prior to data collection between July and De-cember 2008. Information about students’ sex and date of birth were obtained directly from school enrolment records. Data collection was conducted at the schools during a period of one to four days (situation observed in seven schools in one of the ITs) depending on the number of students enrolled at the school.
Anthropometric measurements were taken in duplicate, as recommended by the World Health Organization 30, and mean values were used in the
analysis. Weight was assessed in kilograms (kg) us-ing a portable electronic digital scale (Mars; Marte Balanças e Aparelhos de Precisão Ltda., Santa Rita do Sapucaí, Minas Gerais, Brazil, model PP200) with a capacity of 150kg and precision of 0.05kg. Height was measured in centimetres (cm) using an Alturexata stadiometer (Alturexata Ltda., Belo Horizonte, Brazil) with an accuracy of 1mm and capacity of 213cm. WC was assessed using anthro-pometric inelastic tape (Cardiomed; Cardiomed Ltda., Curitiba, Brazil) with a length of 2m and an accuracy of 1mm. Measurements were taken at the midpoint between the last rib and the iliac crest 31. BMI was calculated using the following formula: weight/(height)² 30.
only one individual was underweight (BMI-for-age z-score < -2) this category was excluded from the analysis. WCTH values > 0.5 were considered high 32,33.
Double data entry was performed using Epi Info software, version 6.04 (Centers for Disease Control and Prevention, Atlanta, USA). Data was analysed using Stata 10.0 (Stata Corp., College Station, USA). Frequencies were calculated for categorical variables and percentile or mean and standard deviation (SD) for continuous variables. The Student’s t-test for Independent Samples and Analysis of Variance (ANOVA) were used to explore the differences between means and pro-portions were compared using the Chi-square test. Correlations between WC, WCTH and BMI-for-age values were evaluated using Pearson’s correlation coefficient. A significance level of p < 0.05 was adopted for all tests.
This study was approved by the following or-ganisations at all required levels for research with indigenous individuals 34: the Ethics Committee of the Federal University of Rio Grande do Sul (Universidade Federal do Rio Grande do Sul; case nº. 2007726), the National Research Ethics Com-mittee (case nº. 14,449), the Brazilian National Research Council (Conselho Nacional de Desen-volvimento Científico e Tecnológico – CNPq) and the FUNAI (case nº. CGEP/08 1141/08). Only in-dividuals presenting a written or digital Informed and Free Consent Form signed by a parent or guardian were evaluated by this study.
Results
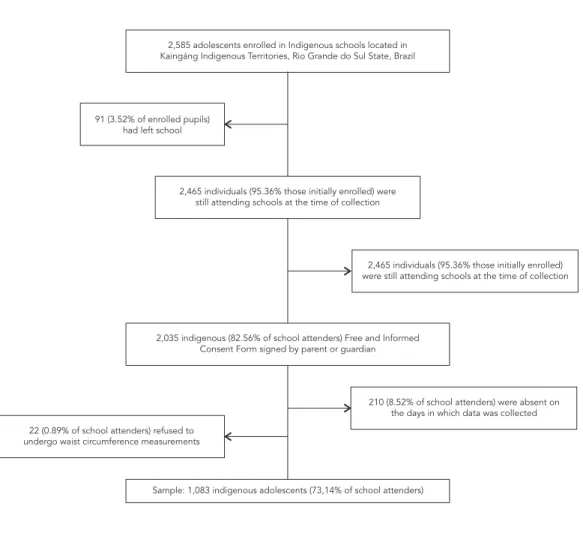
Figure 1 shows the total number of adolescents enrolled in schools at the time of the study, the
Figure 1
Description of the study sample.
2,585 adolescents enrolled in Indigenous schools located in Kaingáng Indigenous Territories, Rio Grande do Sul State, Brazil
Sample: 1,083 indigenous adolescents (73,14% of school attenders) 2,035 indigenous (82.56% of school attenders) Free and Informed
Consent Form signed by parent or guardian 91 (3.52% of enrolled pupils)
had left school
22 (0.89% of school attenders) refused to undergo waist circumference measurements
2,465 individuals (95.36% those initially enrolled) were still attending schools at the time of collection
2,465 individuals (95.36% those initially enrolled) were still attending schools at the time of collection
total number of assessed adolescents and also the number of losses, refusals and absences. A total of 1,803 indigenous adolescents were evalu-ated (73.14% of the students enrolled at the time of data collection), of which 931 (51.64%) were boys. The mean age of the adolescents studied was 12.45 years (±2.10) and the mean age of boys and girls was 12.58 years (±2.21) and 12.32 years (±1.97), respectively. A comparison between eval-uated indigenous adolescents and those enrolled
in a school but not evaluated yielded no statis-tically significant difference for sex ratio (χ2 = 0.060, p = 0.807); however, the average age was lower (t = -9.148, p < 0.0001) for evaluated indi-viduals (data not shown).
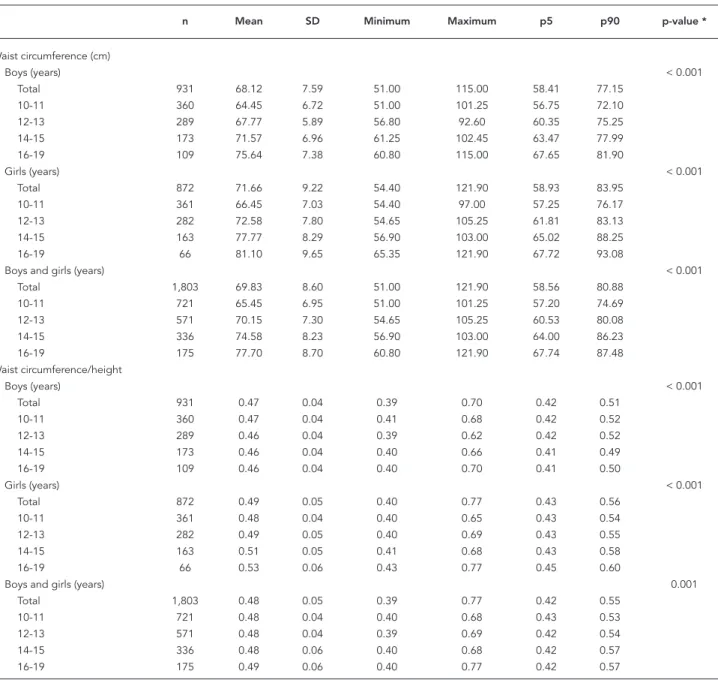
Table 1 presents the mean, SD, minimum and maximum values, and percentiles 5 (p5) and 90 (p90) for WC and WCTH by sex and age. Mean WC and WCTH values were higher for girls than for boys in all age categories (p < 0.05). Mean WCTH
Table 1
Mean values, standard deviation (SD), minimum and maximum values and percentiles 5 (p5) and 90 (p90) of waist circumference and waist circumference/ height by sex and age among adolescents from the Kaingáng Indigenous Territories, Rio Grande do Sul State, Brazil, 2008.
n Mean SD Minimum Maximum p5 p90 p-value *
Waist circumference (cm)
Boys (years) < 0.001
Total 931 68.12 7.59 51.00 115.00 58.41 77.15
10-11 360 64.45 6.72 51.00 101.25 56.75 72.10
12-13 289 67.77 5.89 56.80 92.60 60.35 75.25
14-15 173 71.57 6.96 61.25 102.45 63.47 77.99
16-19 109 75.64 7.38 60.80 115.00 67.65 81.90
Girls (years) < 0.001
Total 872 71.66 9.22 54.40 121.90 58.93 83.95
10-11 361 66.45 7.03 54.40 97.00 57.25 76.17
12-13 282 72.58 7.80 54.65 105.25 61.81 83.13
14-15 163 77.77 8.29 56.90 103.00 65.02 88.25
16-19 66 81.10 9.65 65.35 121.90 67.72 93.08
Boys and girls (years) < 0.001
Total 1,803 69.83 8.60 51.00 121.90 58.56 80.88
10-11 721 65.45 6.95 51.00 101.25 57.20 74.69
12-13 571 70.15 7.30 54.65 105.25 60.53 80.08
14-15 336 74.58 8.23 56.90 103.00 64.00 86.23
16-19 175 77.70 8.70 60.80 121.90 67.74 87.48
Waist circumference/height
Boys (years) < 0.001
Total 931 0.47 0.04 0.39 0.70 0.42 0.51
10-11 360 0.47 0.04 0.41 0.68 0.42 0.52
12-13 289 0.46 0.04 0.39 0.62 0.42 0.52
14-15 173 0.46 0.04 0.40 0.66 0.41 0.49
16-19 109 0.46 0.04 0.40 0.70 0.41 0.50
Girls (years) < 0.001
Total 872 0.49 0.05 0.40 0.77 0.43 0.56
10-11 361 0.48 0.04 0.40 0.65 0.43 0.54
12-13 282 0.49 0.05 0.40 0.69 0.43 0.55
14-15 163 0.51 0.05 0.41 0.68 0.43 0.58
16-19 66 0.53 0.06 0.43 0.77 0.45 0.60
Boys and girls (years) 0.001
Total 1,803 0.48 0.05 0.39 0.77 0.42 0.55
10-11 721 0.48 0.04 0.40 0.68 0.43 0.53
12-13 571 0.48 0.04 0.39 0.69 0.42 0.54
14-15 336 0.48 0.06 0.40 0.68 0.42 0.57
16-19 175 0.49 0.06 0.40 0.77 0.42 0.57
increased with age for girls (p < 0.001), with val-ues above 0.5 in the age categories 14-15 and 16-19 years. Conversely, WCTH tended to decrease with age among boys.
As expected, mean WC and WCTH values were significantly higher among adolescentes presenting BMI-for-age > 2 z-scores when com-pared to normal-weight ones. Normal-weight girls showed higher WC and WCTH mean val-ues than normal-weight boys throughout all age categories. Furthermore, in normal-weight girls aged 16-19 years the WCTH ratio was greater than 0.5, in contrast to normal-weight boys where the WCTH ratio was less than 0.5 in all age catego-ries. Finally, in boys and girls with BMI-for-age > 2 z-scores, WCTH values were greater than 0.5 throughout all age categories, reaching 0.62 in boys and 0.68 in girls in the 16-19 years age cat-egory (Table 2).
The proportion of WCTH values > 0.5 was significantly different between all age categories. In girls, the prevalence of WCTH > 0.5 almost tripled between the 10-11 and 16-19 years age categories, increasing from 24.93% to 72.73%, re-spectively. Overall, the prevalence of high WCTH values was lower among boys, regardless of age category (Table 3).
With respect to WC and BMI-for-age values, a moderate positive correlation (r = 0.75, p < 0.001) was observed for the entire study population. A similar correlation was observed for WCTH and BMI-for-age values (r = 0.79, p < 0.001). When the data was stratified by sex, a stronger positive cor-relation was observed between WC and BMI-for-age, and WCTH and BMI-for-age in girls (r = 0.79 and 0.80, respectively; p < 0.001 for both). Among boys, this correlation was weaker, but was also statistically significant (r = 0.68 for WC and BMI-for-age, and r = 0.76 for WCTH and BMI-for-age; p < 0.001 for both) (data not shown).
Discussion
For indigenous adolescents enrolled in schools in Kaingáng ITs in the State of Rio Grande do Sul, mean WC and WCTH values were greater among female adolescents than in their male counter-parts. The prevalence of WCTH values > 0.5 was also high. For all age categories, the prevalence of WCTH values > 0.5 was higher in female ad-olescents. As expected, mean WC and WCTH values were significantly higher for adolescents with BMI-for-age > 2 z-scores when compared to adolescents with normal weight. Moreover, a positive correlation between WC and BMI-for-age and WCTH and BMI-for-age was observed among both sexes.
Few studies have evaluated the nutritional status of indigenous adolescents and even fewer have evaluated WC, limiting comparative analyses with studies conducted with non-in-digenous populations. This lack of health and nutrition information for indigenous peoples in Brazil affects broader planning, implementation and evaluation of health interventions targeted at this segment of the population 35. A clear
ex-ample of this neglect is the fact that Brazilian in-digenous individuals have not been included in national surveys on health and nutrition, while the rest of the population has been evaluated in such surveys since the 1970s 2. In fact, it was only in 2008 that a specific study of the health and nu-trition status of the Brazilian indigenous popula-tion was conducted through the First National Survey on Nutrition and Health of Indigenous Peoples36.
Nevertheless, specific national studies with different ethnic groups provide evidence that overweight and obesity are emerging problems among indigenous population and show that di-etary and nutritional patterns are in transition and that these changes may be happening even more rapidly than among the non-indigenous population 4,37,38,39,40. Data from the First Nation-al Survey on HeNation-alth and Nutrition of Indigenous Peoples show that when the prevalence of child malnutrition and anaemia becomes alarming, chronic non-communicable diseases are already a reality 36. The survey also revealed a worrying scenario in which obesity, hypertension and changes in glucose levels have occurred with high frequencies amongst women of reproduc-tive age. However, the national survey assessed indigenous children aged zero to five years and women aged 14 to 49 years 36, as opposed to the current study that evaluated adolescents of both sexes aged 10 through 19 years. Comparisons of the results of the present study with the national survey are therefore very limited.
Studies indicate that the Kaingáng people face serious health care problems. Research also highlights a complex epidemiological profile for this population, in which health problems as di-verse as respiratory and parasitic infections coex-ist at relevant magnitudes 41,42 with chronic non-communicable diseases, such as type 2 diabetes, hypertension 43 and even alcoholism 44. A critical factor that may partially explain the results ob-tained in the present study are dietary changes in the Kaingáng population over time. The tradi-tional dietary patterns of the Kaingáng, based on hunting and gathering, fishing and agriculture 45
bas-Table 2
Mean values and standard deviation (SD) of waist circumference and waist circumference/height according to sex, age and nutritional status among adolescents from the Kaingáng Indigenous Territories, Rio Grande do Sul State, Brazil, 2008.
BMI/age -2/2 z-scores BMI/age > 2 z-scores p-value *
n Mean SD p-value ** n Mean SD p-value **
Waist circumference (cm)
Boys (years) < 0.001 < 0.001
Total 873 67.06 5.99 46 86.07 9.55 < 0.001 ***
10-11 332 63.07 4.44 27 81.49 6.86 < 0.001 #
12-13 280 67.19 4.92 9 85.72 5.63 < 0.001 #
14-15 165 70.55 4.67 7 96.61 4.96 < 0.001 ***
16-19 96 74.41 4.57 3 103.78 9.89 0.017 ***
Girls (years) < 0.001 < 0.001
Total 792 70.26 * 7.87 75 86.23 9.16 < 0.001 ***
10-11 329 65.13 * 5.57 31 80.53 5.55 < 0.001 #
12-13 257 71.20 * 6.41 25 86.76 6.66 < 0.001 #
14-15 146 76.33 * 6.67 15 92.30 6.64 < 0.001 #
16-19 60 79.52 * 6.47 4 104.40 15.48 0.024 ***
Boys and girls (years) < 0.001 < 0.001
Total 1,665 68.58 7.13 121 86.17 9.27 < 0.001 ***
10-11 661 64.10 5.13 58 80.97 6.16 < 0.001 ***
12-13 537 69.11 6.02 34 86.48 6.34 < 0.001 #
14-15 311 73.26 6.38 22 93.67 6.37 < 0.001 #
16-19 156 76.38 5.91 7 104.14 12.35 < 0.001 ***
Waist circumference/height
Boys (years) < 0.001 0.048
Total 873 0.46 0.03 46 0.58 0.05 < 0.001 ***
10-11 332 0.46 0.03 27 0.57 0.05 < 0.001 #
12-13 280 0.46 0.03 9 0.57 0.04 < 0.001 #
14-15 165 0.45 0.03 7 0.62 0.03 < 0.001 ***
16-19 96 0.46 0.03 3 0.62 0.07 0.032 ***
Girls (years) < 0.001 < 0.001
Total 792 0.49 ## 0.04 75 0.59 0.05 < 0.001 ***
10-11 329 0.47 ## 0.03 31 0.57 0.03 < 0.001 #
12-13 257 0.48 ## 0.04 25 0.58 0.04 < 0.001 #
14-15 146 0.50 ## 0.04 15 0.61 0.04 < 0.001 #
16-19 60 0.52 ## 0.04 4 0.68 0.10 0.024 ***
Boys and girls (years) < 0.001 < 0.001
Total 1,665 0.47 0.04 121 0.59 0.05 < 0.001 ***
10-11 661 0.47 0.03 58 0.57 0.04 < 0.001 ***
12-13 537 0.47 0.04 34 0.58 0.04 < 0.001 #
14-15 311 0.48 0.05 22 0.61 0.04 < 0.001 #
16-19 156 0.48 0.05 7 0.65 0.09 0.001 ***
BMI: body mass index.
* p-value for comparison of means between BMI/age categories (Student’s t-test); ** p-value for comparison of means among different age categories (ANOVA); *** Student’s t-test for unequal variances between sexes;
# Student’s t-test for equal variances between sexes;
## Mean statistically signifi cant values higher for girls when compared to boys from the same age category.
kets”. Furthermore, available data points to a fat and carbohydrate-rich diet 37,40.
The mean WC values for both sexes described in this study were lower than those found in a study conducted between 1999 and 2004 among non-indigenous adolescents aged 12 to 17 years
study in the State of Pernambuco 46 of adoles-cents aged 14 to 19 years and in a study which investigated adolescents from three Brazilian cit-ies 47. In a study of adolescents aged between 10 and 17 years in the city of Londrina in the State of Paraná, mean WC values for male adolescents were higher (72.4cm) than the present study, while among female adolescents they were lower (67.5cm) 48.
Mean WCTH values identified in the present study are consistent with those observed in the above mentioned study of North American adoles-cents (0.47 among boys and 0.49 for girls) 33. Work conducted by Ribeiro et al. 47 among adolescents in three Brazilian state capitals, showed lower (0.45) mean WCTH values than those observed for Kaingáng adolescents. The prevalence of WCTH values > 0.5 in male adolescents was lower than the percentage indicated by Li et al. 33 from a study of North American adolescents of the same sex (28.8%). However, for female adolescents, the percentages were similar in both studies. In Rec-ife, Brazil, the prevalence of WCTH values > 0.5 among adolescents aged 10 to 14 years was lower (12.6%) than in the present study 49.
Strong positive correlations between the an-thropometric indicators measured in this study (BMI-for-age, WC and WCTH) have also been de-scribed by other authors 13,49. The use of more than one indicator gives additional information, especially regarding the risk of co-morbidities re-lated to excessive weight and particularly the as-sociation with central adiposity. In line with this idea, a study by Jansen et al. 50 showed that for adolescents diagnosed as overweight using BMI-for-age, those with a concomitant high WC value were twice as likely to have high levels of triglyc-erides and insulin and metabolic syndrome when compared with the overweight group without ab-dominal obesity 50. Given this evidence, the use of WC together with BMI to diagnose obesity in adolescents and to screen patients at risk for co-morbidities, particularly cardiovascular disease, has been recommended 50.
Our study design made it possible to evalu-ate more than 70% of the adolescents enrolled in schools in the Kaingáng ITs of Rio Grande do Sul. However, care should still be taken when ex-trapolating these results to all Kaingáng children and adolescents from Rio Grande do Sul, as the
Table 3
Prevalence of elevated values of waist circumference/height by sex and age among adolescents in the Kaingáng Indigenous Territories, Rio Grande do Sul State, Brazil, 2008.
N Waist circumference/height (> 0,5)
n % p-value *
Boys (years) 0.009
Total 931 133 14.29
10-11 360 68 18.89
12-13 289 38 13.15
14-15 173 16 9.25
16-19 109 11 10.09
Girls (years) < 0.001
Total 872 330 37.84
10-11 361 90 24.93
12-13 282 101 35.82
14-15 163 91 55.83
16-19 66 48 72.73
Boys and girls (years) < 0.001
Total 1,803 463 25.68
10-11 721 158 21.91
12-13 571 139 24.34
14-15 336 107 31.85
16-19 175 59 33.71
Note: All differences in prevalence were statistically signifi cant (p < 0.05) between sexes for all age categories (two-sample test of proportion).
study included only individuals enrolled in the IT schools and is therefore representative of only this fraction of the Kaingáng population. Furthermore, the low height values presented by this population may have led to an overestimation of prevalence of high WCTH and should therefore be interpreted with caution. For adolescents, height may not de-pend exclusively on the nutritional status, living conditions or environment that may differ between populations 2. It should be noted that the lack of comparative WCTH data on indigenous adoles-cents hinders further comparisons and conclu-sions. Another important limitation of this study is the lack of information on the sexual matura-tion stage of the adolescents studied, which also restricts the interpretation of the results. Further-more, due the lack of data on specific metabolic diseases, it was not possible to perform correla-tion analysis between WC and WCTH and
meta-bolic diseases as suggested in previous studies in the area 51,52,53.
The anthropometric nutritional assessment of adolescents can also be a challenging task due to the issues regarding the cut-off points and refer-ence standards used. To the authors’ best knowl-edge, the present study is the largest to assess the distribution of WC and WCTH values among stu-dents of a single indigenous ethnic group in Bra-zil. Considering the importance of WC and WCTH values in a more sensitive diagnosis of obesity, ad-ditional studies assessing these indicators in differ-ent indigenous populations are sorely needed. The anthropometric profile of WC and WCTH among Kaingáng adolescents in the schools of Rio Grande do Sul presented in this study may be result of di-etary and nutritional transitions among these indi-viduals, revealing worrying prospects for the devel-opment of chronic non-communicable diseases.
Resumo
Os objetivos do estudo foram descrever a distribuição das medidas de circunferência de cintura (CC) e CC/ estatura (CC/E) para adolescentes indígenas Kaingáng; estimar a prevalência de valores elevados para CC/E; e avaliar a correlação entre CC e CC/E com o IMC/idade. Um total de 1.803 adolescentes indígenas foi avaliado no estudo seccional de base escolar. Foram considerados elevados valores de CC/E superiores a 0,5. Observaram-se maiores valores médios de CC e CC/E para meninas, em todas as faixas etárias. Valores de CC/E > 0,5 foram encontrados em 25,6% dos adolescentes. Valores médios de CC e CC/E foram significativamente maiores para os adolescentes com IMC/idade > 2 z-scores, em compara-ção aos eutróficos. Os coeficientes de correlações entre CC e CC/E com o IMC/idade foram: meninos: r = 0,68 e 0,76, respectivamente, e meninas: r = 0,79 e 0,80, respec-tivamente. Destaca-se proeminência de valores médios elevados de CC e CC/E e prevalências expressivas de obe-sidade abdominal.
Antropometria; Obesidade Abdominal; População Indí-gena; Saúde de Populações Indígenas
Contributors
T. G. Castro participated in drafting the study, data collec-tion, analysis and writing of the manuscript. L. A. Barufaldi contributed to gathering and recording information, ana-lyzing data and writing the manuscript. M. M. Schlüssel, W. L. Conde, M. S. Leite and I. Schuch participated in study design and writing of the manuscript.
Acknowledgements
References
1. Wang Y, Monteiro CA, Popkin BM. Trends of obe-sity and underweight in older children and ado-lescents in the United States, Brazil, China, and Russia. Am J Clin Nutr 2002; 75:971-7.
2. Leite MS, Santos RV, Gugelmim SA, Coimbra Jr. CEA. Crescimento físico e perfil nutricional da po-pulação indígena Xavánte de Sangradouro-Volta Grande, Mato Grosso, Brasil. Cad Saúde Pública 2006; 22:265-76.
3. Sampei MA, Cano EN, Fagundes U, Lima EES, Ro-drigues D, Sigulem DM, et al. Avaliação antropo-métrica de adolescentes Kamayurá, povo indígena do Alto Xingu, Brasil Central (2000-2001). Cad Saú-de Pública 2007; 23:1443-53.
4. Castro TG, Schuch I, Conde WL, Veiga J, Leite MS, Dutra CLC, et al. Estado nutricional dos indígenas Kaingáng matriculados em escolas indígenas do estado do Rio Grande do Sul, Brasil. Cad Saúde Pú-blica 2010; 26:1766-76.
5. Carmona-Fonseca J, Correa AMB, Alcaraz GLM. Población, alimentación y estado nutricional en-tre los tules (kunas) del resguardo Caimán Nuevo (Turbo y Necoclí; Antioquia, Colombia), 2003-2004. Iatreia 2005; 18:259-78.
6. Santos RV, Coimbra Jr. CEA. Socioeconomic dif-ferentiation and body morphology in the Surui of Southwestern Amazonia. Curr Anthropol 1996; 37:851-6.
7. Menegolla IA, Drachler ML, Rodrigues IH, Schwin-gel LR, Scapinello E, Pedroso MB, et al. Estado nu-tricional e fatores associados à estatura de crianças da Terra Indígena Guarita, Sul do Brasil. Cad Saúde Pública 2006; 22:395-406.
8. Ferreira AA, Welch JR, Santos RV, Gugelmin AS, Coimbra Jr. CEA. Nutritional status and growth of indigenous Xavante children, Central Brazil. Nutr J 2012; 11:3.
9. De Onis M, Onyango AW, Borghi E, Siyam A, Nishi-da C, Siekmanna J. Development of a WHO growth reference for school-aged children and adoles-cents. Bull World Health Organ 2007; 85:660-7. 10. Tomkins A. Measuring obesity in children: what
standards to use? J Pediatr 2006; 82:246-8. 11. Gomes FS, Anjos LA, Vasconcellos MTL.
Antropo-metria como ferramenta de avaliação do estado nutricional coletivo de adolescentes. Rev Nutr 2010; 23:591-605.
12. Gugelmin SA, Santos RV. Uso do índice de mas-sa corporal na avaliação do estado nutricional de adultos indígenas Xavánte, Terra Indígena Sangra-douro-Volta Grande, Mato Grosso, Brasil. Cad Saú-de Pública 2006; 22:1865-72.
13. Giugliano R, Melo ALP. Diagnóstico de sobrepeso e obesidade em escolares: utilização do índice de massa corporal segundo padrão internacional. J Pediatr (Rio J.) 2004; 80:129-34.
14. Garnett SP, Baur LA, Srinivasan S, Lee JW, Cowell CT. Body mass index and waist circumference in midchilhood and adverse cardiovascular disease risk clustering in adolescence. Am J Clin Nutr 2007; 86:549-55.
15. Must A, Dallal GE, Dietz WH. Reference data for obesity: 85th and 95th percentiles of body mass index (wt/ht2) and tríceps skinfold thickness. Am J Clin Nutr 1991; 53:839-46.
16. Cole TJ, Bellizzi MC, Flegal KM, Dietz WH. Estab-lishing a standard definition for child overweight and obesity worldwide: international survey. BMJ 2000; 320:1240-2.
17. Conde WL, Monteiro CA. Body mass index cutoff points for evaluation of nutritional status in Bra-zilian children and adolescents. J Pediatr 2006; 82:266-72.
18. Despres JP, Moorjani S, Lupien PJ, Tremblay A, Na-deau A, Bouchard C. Regional distribution of body fat, plasma lipoproteins, and cardiovascular dis-ease. Arteriosclerosis 1990; 10:497-511.
19. Lee CMY, Huxley RR, Wildman RP, Woodward M. Indices of abdominal obesity are better discrimi-nators of cardiovascular risk factors than BMI: a meta-analysis. J Clin Epidemiol 2008; 61:646-53. 20. Maffeis C, Pietrobelli A, Grezzani A, Provera S, Tato
L. Waist circumference and cardiovascular risk factors in prepubertal children. Obes Res 2001; 9: 179-87.
21. Esmaillzadeh A, Mirmiran P, Azizi F. Clustering of metabolic abnormalities in adolescents with the hypertriglyceridemic waist phenotype. Am J Clin Nutr 2006; 83:36-46.
22. Maffeis C, Banzato C, Talamin G; Obesity Study Group of the Italian Society of Pediatric Endo-crinology and Diabetology. Waist-to-height ratio, a useful index to identify high metabolic risk in overweight children. J Pediatr 2008; 152:207-13. 23. Must A, Hollander SA, Economos CD. Childhood
obesity: a growing public health concern. Expert Rev Endocrinol Metab 2006; 1:233-54.
24. Haun DR, Pitanga FJG, Lessa I. Waist/height ratio compared with other anthropometric indicators of obesity as a predictor of high coronary risk. Rev Assoc Med Bras (1992) 2009; 55:705-11.
25. Li M, McDermot RA. Using anthropometric indi-ces to predict cardio-metabolic risk factors in Aus-tralian indigenous populations. Diabetes Res Clin Pract 2010; 87:401-6.
26. Cardoso AM, Mattos IE, Koifman RJ. Prevalência de fatores de risco para doenças cardiovasculares na população Guaraní-Mbyá do Estado do Rio de Janeiro. Cad Saúde Pública 2001; 17:345-54. 27. Gimeno SG, Rodrigues D, Pagliaro H, Cano EM,
Lima EES, Baruzzi RG. Perfil metabólico e antro-pométrico de índios Aruák: Mehináku, Waurá e Yawalapití, Alto Xingu, Brasil Central, 2000/2002. Cad Saúde Pública 2007; 23:1946-54.
28. World Health Organization. Necesidades de la sa-lud de los adolescentes. Geneva: World Health Or-ganization; 1977. (WHO Technical Report Series, 609).
30. World Health Organization. Physical status: the use and interpretation of anthropometry. Geneva: World Health Organization; 1995 (WHO Technical Report Series, 854).
31. World Health Organization. Measuring obesity: classification and description of anthropometric data. Copenhagen: World Health Organization; 1989.
32. McCarthy HD, Ashwell M. A study of central fat-ness using waist-to-height ratios in UK children and adolescents over two decades supports the simple message – “keep your waist circumference to less than half your height”. Int J Obes Relat Me-tab Disord 2006; 30:988-92.
33. Li C, Ford ES, Mokdad AH, Cook S. Recent trends in waist circumference and waist-height ratio among US children and adolescents. Pediatrics 2006; 118:1390-8.
34. Fundação Nacional do Índio. Instrução normativa no. 01/PRESI de 29 de novembro de 1995. Brasília: Fundação Nacional do Índio; 1995.
35. Coimbra Jr. CEA, Santos RV. Saúde, minorias e desigualdade:algumas teias de inter-relações, com ênfase nos povos indígenas no Brasil. Ciênc Saúde Coletiva 2000; 5:125-32.
36. Associação Brasileira de Pós-graduação em Saúde Coletiva. Boletim ABRASCO 105 2010; Ano XXVII. 37. Schuch I. Perfil socioeconômico e alimentar das
famílias indígenas Kaingang do Guarita RS [Dis-sertação de Mestrado]. Campinas: Faculdade de Engenharia de Alimentos, Universidade Estadual de Campinas; 2001.
38. Gugelmin AS, Santos RV. Ecologia humana e an-tropometria nutricional de adultos Xavánte, Mato Grosso, Brasil. Cad Saúde Pública 2001; 17:313-22. 39. Leite MS, Santos RV, Coimbra Jr. CEA.
Sazonalida-de e estado nutricional Sazonalida-de populações indígenas: o caso Wari’, Rondônia, Brasil. Cad Saúde Pública 2007; 23:2631-42.
40. Kühl AM, Corso ACT, Leite MS, Bastos JL. Perfil nutricional e fatores associados à ocorrência de desnutrição entre crianças indígenas Kaingáng da Terra Indígena de Mangueirinha, Paraná, Brasil. Cad Saúde Pública 2009; 25:409-20.
41. Hökerberg YHM, Duchiade MP, Barcellos CC. Or-ganização e qualidade da assistência à saúde dos índios Kaingáng do Rio Grande do Sul, Brasil. Cad Saúde Pública 2001; 17:261-72.
42. Gilio J, Mioranza SL, Takizawa MGMH. Parasitis-mo intestinal em índios da reserva indígena de Rio das Cobras. Rev Bras Anal Clin 2006; 38:193-5. 43. Portela-García S. Diabetes e hipertensão arterial
entre os indígenas Kaingang da Aldeia Sede, Terra Indigena Xapecó (SC): práticas de autoatenção em um contexto de intermedicalidade [Dissertação de Mestrado]. Florianópolis: Programa de Pós-Gradu-ação em Antropologia Social, Universidade Fede-ral de Santa Catarina; 2010.
44. Ghiggi Jr. A. Estudo etnográfico sobre alcoolização entre os índios Kaingang da Terra Indígena Xa-pecó: das dimensões construtivas à perturbação [Dissertação de Mestrado]. Florianópolis: Progra-ma de Pós-Graduação em Antropologia Social, Universidade Federal de Santa Catarina, 2010. 45. Veiga J. Aspectos fundamentais da cultura
Kain-gáng. São Paulo: Editora Curt Nimuendajú; 2006. 46. Cavalcanti CBS, Barros MVG, Meneses AL, Santos
CM, Azevedo AMP, Guimarães FJSP. Obesidade ab-dominal em adolescentes: prevalência e associa-ção com atividade física e hábitos alimentares. Arq Bras Cardiol 2010; 94:371-7.
47. Ribeiro RC, Coutinho M, Bramorski MA, Giuliano IC, Pavan J. Association of the waist-to-height ratio with cardiovascular risk factors in children and ad-olescents: The Three Cities Heart Study. Int J Prev Med 2010; 1:39-49.
48. Christofaro DGD, Ritti-Dias RM, Fernandes RA, Po-lito MD, Andrade SM, Cardoso JR, et al. Detecção de hipertensão arterial em adolescentes através de marcadores gerais e adiposidade abdominal. Arq Bras Cardiol 2011; 96:465-70.
49. Pinto ICS, Arruda IKG, Diniz AS, Cavalcanti AMTS. Prevalência de excesso de peso e obesidade abdo-minal, segundo parâmetros antropométricos, e as-sociação com maturação sexual em adolescentes escolares. Cad Saúde Pública 2010; 26:1727-37. 50. Janssen I, Katzmarzyk PT, Srinivasan SR, Chen W,
Malina RM, Bouchard C, et al. Combined influ-ence of body mass index and waist circumferinflu-ence on coronary artery risk factors among children and adolescents. Pediatrics 2005; 115:1623-30. 51. Picon PX, Leitão CB, Gerchman F, Azevedo MJ,
Sil-veiro SP, Gross JL, et al. Medida da cintura e ra-zão cintura/quadril e identificação de situações de risco cardiovascular: estudo multicêntrico em pacientes com diabetes melito tipo 2. Arq Bras En-docrinol Metab 2007; 51:443-9.
52. Lunardi CC, Petroski EL. Índice de massa corporal, circunferência da cintura e dobra cutânea tricip-tal na predição de alterações lipídicas em crianças com 11 anos de idade. Arq Bras Endocrinol Metab 2008; 52:1009-14.
53. Matos LN, Giorelli GV, Dias CB. Correlation of anthropometric indicators for identifying insulin sensitivity and resistance. São Paulo Med J 2011; 129:30-5.
Submitted 06/Feb/2012