Luis Gustavo Barrotte Albino(a) José Augusto Rodrigues(b) Yoshio Kawano(c)
Alessandra Cassoni(b)
(a) Department of Restorative Dentistry, Graduate Division, Guarulhos University, Guarulhos, SP, Brazil.
(b) Department of Restorative Dentistry, Dental Research Division, Guarulhos University, Guarulhos, SP, Brazil.
(c) Department of Fundamental Chemistry, Chemistry Institute, Universidade de São Paulo - USP, São Paulo, SP, Brazil.
Corresponding author:
Alessandra Cassoni Guarulhos University - UnG Pós-graduação em Odontologia Praça Teresa Cristina, 229 - Centro CEP: 07023-070
Guarulhos - SP - Brazil E-mail: [email protected]
Received for publication on Dec 08, 2010 Accepted for publication on Mar 04, 2011
Knoop microhardness and FT-Raman
evaluation of composite resins:
influence of opacity and photoactivation
source
Abstract: The aim of this study was to evaluate the degree of conversion by Knoop microhardness (KHN) and FT-Raman spectroscopy (FTIR) of one nanoilled (Filtek Supreme-3M-ESPE [FS]) and one microhybrid com-posite (Charisma-Heraeus-Kulzer [CH]), each with different opacities, namely enamel, dentin, and translucent, which were photo-activated by a quartz-tungsten-halogen lamp (QTH) and a light-emitting diode (LED). Resin was bulk inserted into a disc-shaped mold that was 2.0 mm thick and 4 mm in diameter, obtaining 10 samples per group. KHN and FTIR values were analyzed by two-way ANOVA and Tukey’s tests (α = 0.05). Nanoilled resin activated by a LED presented higher microhardness val-ues than samples activated by a QTH for dentin opacity (p < 0.05). The microhybrid resin showed no differences in KHN or FTIR values with different activation sources or opacity. The nanoilled dentin and enamel resins showed lower FTIR values than the translucent resin. The KHN values of the translucent resins were not inluenced by the light source.
Descriptors: Composite Resins; Hardness; Spectrum Analysis; Light.
Introduction
The clinical performance of composite resin restorations depends on several factors, which may alter the physical-chemical properties of the resin; such properties include the concentration of monomer and ill-ing particles and those related to the clinician’s manipulation.1 Also, the
quality of the light emitted by the curing units may affect monomer con-versionand improved mechanical properties.2
Curing units activate the camphoroquinone, which is the photo-initi-ator most commonly present in resin composites that is sensitive to blue light in the wavelengths between 400 and 515 nm.1,3-5 Commonly, curing
units are composed of a halogen lamp that provides a white light spec-trum iltered to produce a spectral output between 400 and 500 nm.6
However, a wide spectrum of light is still emitted when this energy is spent. The light emitting diode (LED) curing units provide a narrow bandwidth of light with a wavelength of 470-490 nm, which is capa-ble of polymerizing the composite resin with less energy than the halo-gen lamp because LED light is close to the camphoroquinone excitation wavelength.4
The polymerization eficiency of a composite resin is inluenced by the irradiation intensity, ex-posure time, and the light source.7 Concerns about
these variables have led to several studies recently to determine the degree of conversion (DC) of dental composites.7-15 The sensitivity of molecular
vibra-tional methods, such as infrared spectroscopy (FTIR) and Raman spectroscopy (FT-Raman), offers a direct approach to quantify the ratio of monomers’ con-version into polymers; this quantiication is accom-plished by assessing the speciic band positions and by comparing the residual unpolymerized aliphatic C=C stretching band at 1640 cm−1 to the aromatic
C=C stretching band at 1610 cm−1.8,9,16 Thus, the
ra-tio of double carbon bonds that are converted into single bonds determines the DC of the resin compos-ite.8,11-13,15 On the other hand, the hardness achieved
by the polymerized composite is widely used as an indirect method of determining the quality of the light-initiated polymerization process.17
The light that initiates the polymerization may be absorbed or scattered through the body of the resin, jeopardizing the polymerization process. The lower transmittance of the light results in a low DC18 and consequently low microhardness,19 which
is strongly inluenced by the resin’s opacity and its iller contents.6,18,20 It has been speculated that
dark-er resins, which are more saturated in croma, need a higher density of light energy to reach an acceptable monomer conversion than do lighter colored res-ins.20 However, there is little information regarding
the opacity and light inluence in the conversion be-cause translucent resins are frequently used to repro-duce enamel, and opaque resins are frequently used to reproduce dentin with the same croma.21
The aim of this study was to evaluate the degree
of conversion by Knoop microhardness (KHN) and FT-Raman spectroscopy (DC) of one nanoilled and one microhybrid composite, each with different opacities (enamel, dentin, and translucent), which were photo-activated by a QTH or a LED.
Methodology
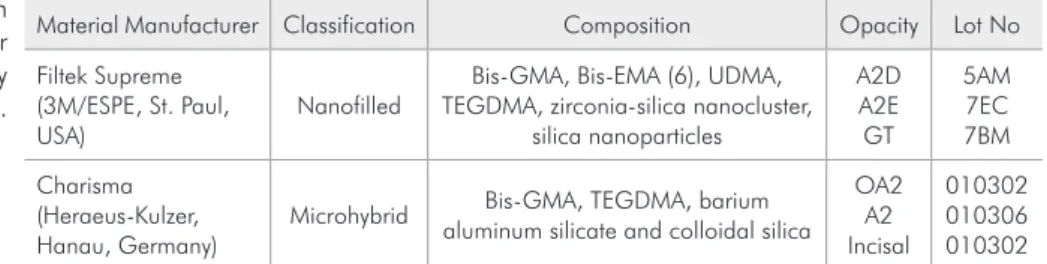
One nanoilled and one microhybrid commercial composite resin, each with three different opacities related to their translucence, were selected for this study (Table 1).
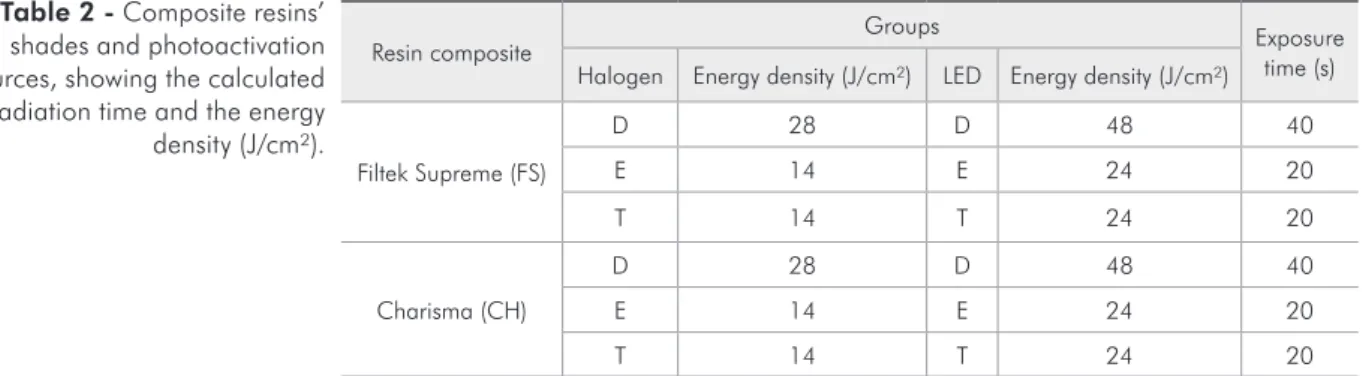
Two light curing units with different light sources – a halogen source with a light intensity of 700 mW/cm² (Optilux 501 - Demetron/Kerr, Dan-bury, USA) and a LED source with an intensity of 1200 mW/cm² (Radii - SDI Limited, Victoria, Aus-tralia) – were used. The power density was mea-sured with a radiometer (Demetron/Kerr, Danbury, USA). Table 2 presents the energy density calculated after multiplying the power density by the exposure time recommended by the manufacturers.22
Specimen preparation
A total of 120 specimens were prepared accord-ing to the twelve groups (n = 10; Table 2).
A two-part white polytetraluoroethylene mold with a cylindrical window (4 mm in diameter and 2 mm high) was placed on a 10 x 120 x 0.05-mm Mylar strip (Polidental, Cotia, Brazil) on a matte black background and was kept stable with a metal ring. The composite was inserted in a single incre-ment, and a second strip was placed on top of the unpolymerized material. A glass slide was put on top of the Mylar strip, and a 500 g load was applied for 30 s on the top of the mold to provide a smooth surface. The glass slide was removed before
expos-Material Manufacturer Classification Composition Opacity Lot No
Filtek Supreme (3M/ESPE, St. Paul, USA)
Nanofilled
Bis-GMA, Bis-EMA (6), UDMA, TEGDMA, zirconia-silica nanocluster,
silica nanoparticles
A2D A2E GT
5AM 7EC 7BM
Charisma (Heraeus-Kulzer, Hanau, Germany)
Microhybrid Bis-GMA, TEGDMA, barium aluminum silicate and colloidal silica
OA2 A2 Incisal
010302 010306 010302
Bis-GMA = bisphenol glycidyl methacrylate; Bis-EMA = bisphenol A polyethylene glycol diether dimethacrylate; UDMA = urethane dimethacrylate; TEGMA = triethylene glycol dimethacrylate.
ing the composite resin to light, and the light tip of each curing unit was centered on the specimen with no intervening space.8,19
Degree of Conversion
Five prepared specimens were evaluated immedi-ately after light activation for each group. As a con-trol, the spectra of i ve unpolymerized composites were analyzed for each group.
The DC of the side opposite to the irradiated surface of the specimens was determined by an RFS 100/S FT-Raman spectrometer (Bruker Optics, Bil-lerica, USA) equipped with a liquid nitrogen-cooled germanium detector. The 1064-nm line of an air-cooled Nd:YAG near-infra-red laser was used to excite the samples.8,10 The Raman spectra were
obtained using 64 scans at a spectral resolution of 4 cm−1 and were analyzed by selecting a spectral
region of 1000-2000 cm−1. The Raman spectrum
obtained from the uncured (translucent) FS is repre-sented in Figure 1.
The DC of each sample was determined by com-paring the aliphatic carbon double bond peak with the aromatic component for the unpolymerized and polymerized states.9 The ratio between the aliphatic
(1640 cm−1) and the aromatic (1610 cm−1) carbon
double bond peaks was used to calculate the DC ac-cording to the following formula:8,11-13
DC = [1 − (polymerized/unpolymerized)] × 100
Knoop microhardness profile
After polymerization, each specimen was
re-moved from the mold and was stored in deionized water in light-proof containers for 24 h at a constant temperature of 37ºC. A Knoop diamond indenter was used to make i ve indentations in the center of the surface opposite to the light-irradiated surface of the specimen with a 25 g load for 20 s.8,19 The
mean of the i ve microhardness evaluations of each specimen was used as the specimen’s microhardness value.
Statistical analysis
For each composite, a two-way analysis of vari-ance was carried out, and the means of the Knoop microhardness values (KHN) and the degree of con-version were compared by a Tukey’s interval calcu-lated at a 95% coni dence level.
Resin composite
Groups Exposure
time (s) Halogen Energy density (J/cm²) LED Energy density (J/cm²)
Filtek Supreme (FS)
D 28 D 48 40
E 14 E 24 20
T 14 T 24 20
Charisma (CH)
D 28 D 48 40
E 14 E 24 20
T 14 T 24 20
D = Dentin; E = Enamel; T = Translucent.
Table 2 - Composite resins’ shades and photoactivation sources, showing the calculated irradiation time and the energy density (J/cm²).
Figure 1 - FT-Raman spectrum of nanofilled compos-ite (translucent) cured by halogen light (14 J/cm²) with the main vibrational modes assigned: C=O stretching mode
at 1730 cm−1; the methacrylate C=C stretching mode at
1640 cm−1; the C=C stretching of the aromatic group at
1610 and 1452 cm−1.
R
aman
Intens
ity
Wavenumber cm−1
0
.0
0
0
0
.0
0
2
0
.0
0
4
0
.0
0
6
0
.0
0
8
2000 1800 1600 1400 1200 1000
C
=O
C
=C
C
Results
Knoop microhardness
The data were submitted to a two-way ANOVA and to a Tukey’s test (α = 0.05) considering the fac-tors of photoactivation source and resin opacity and their interaction.
There were statistically signiicant differences for the photoactivation source (p = 0.001; Table 3) for the FS. There were no statistically signiicant differ-ences for the resin opacity (p = 0.982). Statistically signiicant differences were found in the interac-tion of the photoactivainterac-tion source * resin opacity (p = 0.003, Table 3) with a higher KHN for the den-tin resin activated with the LED than that activated with the QTH.
No statistically signiicant differences were ob-served for photoactivation source (p = 0.14), resin opacity (p = 0.52), or for the interaction of the pho-toactivation source * resin opacity (p = 0.51, Table 4) for the microhybrid resin.
Degree of Conversion
Figure 1 shows the representative FT-Raman spectra of the FS (translucent) cured by a halogen light (14 J/cm²). Data were submitted to two-way ANOVA and to Tukey’s test (α = 0.05) considering the factors of photoactivation source and resin opac-ity and their interactions. The data obtained for the
DC and for the standard deviation for each experi-mental group are shown in Tables 5 and 6.
There were statistically signiicant differences for resin opacity (p < 0.001, Table 5). The dentin and enamel resins showed a lower DC than did the translucent resin (FS). There were no statistically signiicant differences for photoactivation source (p = 0.65) or for the interaction of the photoactiva-tion source * resin opacity (p = 0.17).
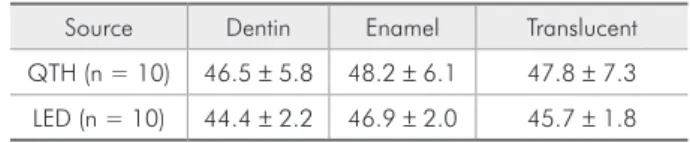
There were no statistical differences for the res-in opacity (p = 0.52), the photoactivation source (p = 0.18), or for the interaction of the photoactiva-tion source * resin opacity (p = 0.88) for the CH; the results are presented in Table 6.
Discussion
The advancement in LED technology is com-parable with the advancement in computer tech-nology.4 The quality of the polymerization process
can inluence the performance of composite resins and plays an important role in the success of dental restorations.7 This process may be predicted by the
proportion of monomers effectively converted into polymers. This proportion is described as the degree of conversion and is usually evaluated by several methods, including the non-destructive technique Raman spectroscopy.8,16 The most important
vibra-tional bands have been previously reported,9 and the
Table 4 - Mean Knoop microhardness values (KHN) and standard deviations for each experimental group of micro-hybrid composites (CH).
Source Dentin Enamel Translucent
QTH (n = 10) 22.8 ± 2.9 19.1 ± 1.7 19.6 ± 3.30
LED (n = 10) 24.1 ± 3.6 26.4 ± 4.9 21.9 ± 3.8
Table 5 - Mean DC (%) of the nanofilled resin (FS) after activation and standard deviations, and the results of Tukey’s test for the opacity factor.
Source Dentin Enamel Translucent
QTH 50.8 ± 2.4 55.3 ± 4.6 64.8 ± 1.8
LED 55.7 ± 4.3 55.2 ± 2.8 63.8 ± 5.6
Opacity Factor (n = 10) 53.4 ± 3.0b 55.2 ± 3.7b 64.3 ± 4.0a Means followed by the same lower case letters in the row are not statistically different (p < 0.05); n = number of samples.
Table 6 - Mean DC (%) of the microhybrid resin (CH) and standard deviations.
Source Dentin Enamel Translucent
QTH (n = 10) 46.5 ± 5.8 48.2 ± 6.1 47.8 ± 7.3
LED (n = 10) 44.4 ± 2.2 46.9 ± 2.0 45.7 ± 1.8 Table 3 - Mean Knoop microhardness values (KHN) and
standard deviations for each experimental group of nano-filled resin (FS) and a Tukey’s post-hoc test.
Source Dentin Enamel Translucent
QTH (n = 10) 39.6 ± 6.5bA 46.0 ± 6.3aA 46.2 ± 5.1aA
LED (n = 10) 56.0 ± 5.6aA 50.1 ± 8.9aA 49.1 ± 6.2aA
Raman spectrum of the uncured FS, with the main vibrational modes assigned, is shown in Figure 1.
The nanoilled resin selected for the present study was Filtek Supreme. It is classiied as a particulate, reinforced, polymer-based resin.23 Filtek Supreme
has been described as having a 46.6% conversion at surface but only 38% DC at a 2-mm thickness with the same nanoilled dentin resin; these data empha-size the decrease in light transmission that occurs throughout the composite resin.23 The DC of the
nanoilled resin was inluenced by its translucence in the present study. Thus, in this study, the translu-cent resin showed a higher DC than did the dentin or the enamel opacities. Presumably, there was high light scattering though the translucent resin because a higher transmittance of the light results in a higher DC,18 which is strongly inluenced by the resin
opac-ity and iller contents.6,18 For these reasons,
compos-ite resin with the dentin opacity needs to receive a higher exposure time to reach a similar DC of com-posite resin with enamel opacity (Table 5).
Because the radiant exposure is calculated as the product of irradiance and time of irradiation pro-vided by the light unit,10 the results obtained using
the LED light source are probably due to the gen-eration of a high irradiance of this unit associated with the maximum absorption wavelength of the camphoroquinone.
Moreover, the absence of statistical differences in the degree of conversion in the microhybrid resin in function of opacity and photo-activation factors may be explained by the theory that above a certain energy density threshold, the power density does not inluence the polymerization kinetics of the resin polymerization process.22 Moreover, above an
irra-diance of 10 J/cm²,there is a tendency for the DC to stabilize.24 However, higher DCs lead to concerns
because they promote higher shrinkage stress dur-ing polymerization, and there might be an increased risk of adhesive failures.13,24
The nanoilled resin (FS) showed an interaction of the studied factors. The dentin resin showed a statistically lower KHN when activated by the QTH (39.6 KHN) as compared to the group activated by the LED (56 KHN). An increase in irradiance leads to a higher hardness in the composite resin,10 and
polymerization depends not only on the intensity of the light, but also on the total amount transmitted throughout the polymer.22 Thus, one possible reason
for this difference may be related to the energy den-sity of the LED associated with the pigments of the resin composite that were able to scatter the light emitted from the QTH.
It has been reported that the KHN of the A1 shade of a nanoilled composite (FS) was higher (52.3 KHN) than that of the A3 shade (42.7 KHN) after activation by a QTH lamp, showing that the degree of conversion may be impaired by croma saturation.19 In another study, a 37.4 KHN and a
48.6% degree of conversion were reported for the Filtek Supreme-A3 activated with a QTH lamp; these values were considerably lower than the val-ues observed in the present study due to the satura-tion of the nanoilled resin chosen.8 The translucent
resin (shade YT) showed no statistical differences between QTH or LED activation, and these results are similar to those of the present study, which showed similar KHN values independently of the light source.25
Higher KHN values at a 2-mm depth have been reportedfor Charisma samples activated by LED26
rather than by QTH. Nevertheless, these values are not in agreement with the values achieved in the present study; one probable explanation for this dif-ference is the lower irradiance values in the prior study.26 In the present study, no differences related
to opacity or photo-activation factors were observed for the microhybrid resin in the microhardness pro-iles or in the DC evaluation. One possible reason for this result is the presence of colloidal silica par-ticles in the composite resin, which could cause dis-persion of the incident light, thus decreasing the po-lymerization depth of the composite.13
Although the results were not statistically com-parable, it was observed that the nanoilled resin showed the highest mean microhardness values of those tested. Furthermore, the present study high-lights the inluence of the amount of energy deliv-ered on the degree of composite polymerization.
Conclusions
translucent color of the nanoilled composite resin were not inluenced by the light activation source. Further, the activation of the dentin shade by the LED resulted in higher microhardness values than did the QTH activation. The dentin and enamel shades of the nanoilled composite showed lower DCs than did the translucent shade. The
microhy-brid composite showed no differences in microhard-ness values or in the degree of conversion for all of the experimental groups.
Acknowledgements
The authors would like to thank the 3M ESPE company for material support.
References
1. Price RB, Ehrnford L, Andreou P, Felix CA. Comparison of quartz-tungsten-halogen, light-emitting diode, and plasma arc curing lights. J Adhes Dent. 2003 Fall;5(3):193-207. 2. St-Georges AJ, Swift EJ, Thompson JY, Heymann HO.
Irradi-ance effects on the mechanical properties of universal hybrid and flowable hybrid resin. Dent Mater. 2003 Jul;19(5):406-13. 3. Wiggins KM, Hartung M, Althoff O, Christine W, Mitra SB.
Curing performance of new-generation light-emitting diode dental curing unit. J Am Dent Assoc. 2004 Oct;135(10):1471-9.
4. Kramer N, Lohbauer U, García-Godoy F, Frankenberger R. Light-curing units of resin-based composites in the LED era. Am J Dent. 2008 Jun;21(3):135-42.
5. Ramp LC, Broome JC, Merrie HR. Hardness and wear resis-tance of two composte cured with equivalent radiant exposure from low irradiance LED and QTH light-curing units. Am J Dent. 2006 Feb;19(1):31-6.
6. Rueggeberg FA, Ergle JW, Mettenburg DJ. Polymerization depths of contemporary light-curing units using microhard-ness. J Esthet Dent. 2000;12(6):340-9.
7. Lohbauer U, Rahiotis C, Krämer N, Petschelt A, Eliades G. The effect of different light-curing units on fatigue behavior and degree of conversion of a resin composite. Dent Mater. 2005 Jul;21(7):608-15.
8. Cassoni A, Ferla J de O, Shibli JA, Kawano Y. Knoop micro-hardness and FT-Raman spectroscopic evaluation of a resin-based dental material light-cured by an argon ion laser and halogen lamp: an in vitro study. Photomed Laser Surg. 2008 Dec;26(6):531-9.
9. Tsuda H, Arends J. Raman spectroscopy in dental re-search: a short review of recent studies. Adv Dent Res. 1997 Nov;11(4):539-47.
10. Silva EM, Poskus LT, Guimarães JGA. Influence of light-polymerization modes on the degree of conversion and me-chanical properties of resin composites: a comparative analysis between a hybrid and a nanofilled composite. Oper Dent. 2008 May-Jun;33(3):287-93.
11. Ferracane JL. Correlation between hardness and degree of conversion during the setting reaction of unfilled dental re-storative resins. Dent Mater. 1985 Feb;1(1):11-4.
12. Gonçalves F, Calheiros FC, Witzel MF, Kawano Y, Braga RR. Effect of photoactivation protocol and radiant exposure
on monomer conversion and flexural strength of a resin com-posite after water and ethanol storage. J Biomed Mater Res B Appl Biomater. 2007 Jul;82(1):89-92.
13. Calheiros FC, Braga RR, Kawano Y, Ballester RY. Relation-ship between contraction stress and degree of conversion in restorative composites. Dent Mater. 2004 Dec;20(10):939-46. 14. Emami N, Söderholm KJM. How light irradiance and curing
time affect monomer conversion in light-cured resin compos-ites. Eur J Oral Sci. 2003 Dec;111(6):536-42.
15. Schneider LFJ, Pfeifer CSC, Consani S, Prahl SA, Ferracane JL. Influence of photoinitiator type on the rate of polymeriza-tion, degree of conversion, hardness and yellowing of dental resin composites. Dent Mater. 2008 Sep;24(9):1169-77. 16. Soh MS,Yap AU, Yu T, Shen ZX. Analysis of the degree of
conversion of LED and Halogen lights using micro-Raman Spectroscopy. Oper Dent. 2004 Sep-Oct;29(5):571-7. 17. Yap AU, Soh MS, Han TT, Siow KS. Influence of curing lights
and modes on cross-link density of dental composites. Oper Dent. 2004 Jul-Aug;29(4):410-5.
18. Leloup G, Holvoet PE, Bebelman S, Devaux J. Raman scat-tering determination of the depth of cure of light-activated composites: influence of different clinically relevant param-eters. J Oral Rehabil. 2002 Jun;29(6):510-5.
19. Cassoni A, Ferla J de O, Albino LG, Youssef MN, Shibli JA, Rodrigues JA. Argon ion laser and halogen lamp activation of a dark and light resin composite: microhardness after long-term storage. Lasers Med Sci. 2010 Nov;25(6):829-34. 20. Aguiar FH, Lazzari CR, Lima DA, Ambrosano GM,
Lovadi-no JR. Effect of light curing tip distance and resin shade on microhardness of a hybrid resin composite. Braz Oral Res. 2005 Oct-Dec;19(4):302-6.
21. Yu B, Lee YK. Translucency of varied brand and shade of resin composite. Am J Dent. 2008 Aug;21(4):229-32.
22. Gritsch K, Souvannasot S, Schembri C, Farge P, Grosgogeat B. Influence of light energy and power density on the micro-hardness of two nanohybrid composites. Eur J Oral Sci. 2008 Feb;116(1):77-82.
24. Calheiros FC, Daronch M, Rueggeberg FA, Braga RR. Influ-ence of irradiant energy on degree of conversion, polymer-ization rate and shrinkage stress in an experimental resin composite system. Dent Mater. 2008 Sep;24(9):1164-8. 25. Gomes GM, Calixto AL, Santos FA, Gomes OM, D’alpino
PH, Gomes JC. Hardness of a bleaching-shade resin composite
polymerized with different light-curing sources. Braz Oral Res. 2006 Oct-Dec;20(4):337-41.