Health assessment of children in daycare centers in a city of
Southern Brazil
Avaliação da saúde de crianças em creches de cidade do sul do Brasil
Evaluación de la salud en niños en guarderías de ciudad del sur de Brasil
Doroteia Aparecida Höfelmann1, Ayama Dallabona2
Instituição: Universidade do Vale do Itajaí (Univali), Centro de Ciências da Saúde, Curso de Nutrição, Itajaí, SC, Brasil
1Doutoranda em Saúde Coletiva pela Universidade Federal de Santa Catarina (UFSC); Docente do Curso de Nutrição da Univali, Itajaí, SC, Brasil 2Nutricionista pela Univali, Itajaí, SC, Brasil
ABSTRACT
Objective: To analyze the health of children assisted at public and private daycare centers of a city to the South of Brazil, and to assess its association with socioeconomic, demographic, and health-related conditions.
Methods: Cross-sectional study with dual-stage sampling (n=589). Data collection included anthropometric measures and a questionnaire with variables related to children and their guardians. Guardian’s ratings of children’s health were classified as very good, good, fair, poor, or very poor. The first two categories were grouped, and the three last ones indicated poor health. Crude and adjusted prevalence ratios (PR) with 95% confidence intervals (95%CI) were calculated using Poisson’s regression, with adjustment for complex designs.
Results: 531 children (90.2%) aged between 1.5 months and 7.5 years were evaluated, most of whom were assisted in public day care centers (75.9%). Only 8.1% (95%CI 5.8–10.4) of the guardians rated children’s health as fair. Children who were hospitalized in the past year, those clas-sified as black, Asiatic or native Americans, those who spent more than 20 hours per week in the daycare center, and those whose food intake was considered ‘not sufficient’ by their parents had a higher prevalence of health classified as regular. Parents who reported alcohol consumption assessed their children’s health as poor.
Conclusions: Most caregivers had a positive evaluation of their children’s health. Skin color, previous hospitalizations,
and children’s food consumption were variables indepen-dently associated with a non-optimal evaluation of children’s health by their parents.
Key-words: child; preschool child; parents; child day care centers; hospitalization.
RESUMO
Objetivo: Analisar a avaliação da saúde de crianças de creches públicas e privadas de uma cidade do Sul do Brasil feita por seus responsáveis e investigar sua associação com fatores socioeconômicos, demográficos e aqueles relacionados ao estado de saúde.
Métodos: Estudo transversal com amostragem em du-plo estágio (n=589). A coleta de dados incluiu medidas antropométricas e questionário com variáveis infantis e do responsável. A avaliação do responsável sobre a saúde infantil foi coletada como muito boa, boa, regular, ruim ou muito ruim. Para a análise, as duas primeiras categorias foram agrupadas e as três últimas indicaram saúde negativa. As razões de prevalência brutas e ajustadas e seus respectivos intervalos de confiança de 95% (IC95%) foram calculadas por meio da regressão de Poisson, com ajuste para delinea-mentos complexos.
Resultados: Foram avaliadas 531 crianças (90,2%) com idades de 1,5 meses a 7,5 anos, a maioria de creches públicas (75,9%). Apenas 8,1% (IC95% 5,8–10,4) tiveram sua saúde classificada como regular. Crianças hospitalizadas no ano
ante-Endereço para correspondência: Doroteia Aparecida Höfelmann Rua Uruguai, 458 – Centro CEP 88302-202 – Itajaí/SC E-mail: [email protected] Conflito de interesse: nada a declarar Recebido em: 1/9/2011
rior, as de raça negra, amarela ou indígenas, que ficavam mais de 20 horas por semana na creche e com consumo alimentar con-siderado “pequeno” pelos pais apresentaram maior prevalência de saúde classificada como regular. Pais que relataram consumir bebidas alcoólicas avaliaram como pior a saúde de seus filhos.
Conclusões: A maioria dos responsáveis avaliou positiva-mente a saúde de seus filhos. Cor da pele, hospitalizações e consumo alimentar foram variáveis independentemente as-sociadas à pior avaliação de saúde infantil pelos responsáveis.
Palavras-chave: crianças; pré-escolar; pais; creches; hospitalização.
RESUMEN
Objetivos: Analizar la evaluación de la salud de niños en guarderías públicas y privadas de una ciudad del Sur de Brasil por sus responsables e investigar su asociación con factores so-cioeconómicos, demográficos y relacionados al estado de salud.
Métodos: Estudio transversal, con muestreo en doble etapa (n=589). La recolección de datos incluyó medidas antropomé-tricas y cuestionario con variables infantiles y del responsable. La evaluación del responsable sobre la salud infantil fue cla-sificada como muy buena, buena, regular, mala o muy mala. Para el análisis, las dos primeras categorías fueron agrupadas y las tres últimas indicaron salud negativa. Las razones de prevalencia brutas y ajustadas y sus respectivos intervalos de confianza de 95% (IC95%) fueron calculados por medio de la regresión de Poisson, con ajuste para delineaciones complejas.
Resultados: Se evaluaron a 531 niños (90,2%), con edades de 1,5 meses a 7,5 años, la mayoría era de guarderías públicas (75,9%). Solamente el 8,1% (IC95% 5,8–10,4%) tuvieron su salud clasificada como regular. Niños que fueron hospi-talizados el último año, con color de la piel negra, amarilla o india, que quedaban más de 20 horas por semana en la guardería y con consumo alimentar considerado «pequeño» por los padres presentaron mayor prevalencia de salud cla-sificada como regular. Padres que relataron consumir bebidas alcohólicas evaluaron como peor la salud de sus hijos.
Conclusiones: La mayoría de los responsables evaluó positivamente la salud de sus hijos. Color de la piel, hospi-talizaciones y consumo alimentar fueron variables indepen-dientemente asociadas a peor evaluación de salud infantil por los responsables.
Palabras clave: niños; pre-escolar; padres; guarderías; hospitalización.
Introduction
The evaluation of child health is an important indica-tor of the level of development in different populations. Monitoring the evolution of maternal and child health indicators is essential to assess the impact of social and eco-nomic changes, as well as any advances or setbacks on the availability and quality of health services(1).
Self-rated health has been used in recent decades as a meas-ure capable of synthesizing various aspects related to health and to predict morbimortality over the years, even after the adjustment for some variables, such as sex, age and other measures of physical health, including medical diagnosis(2).
It includes underlying psychological aspects to the concept of health. Knowledge about self-rated health within the population contributes to guide political and social decisions that seek quality of life and not merely physical health(3).
The perception of each individual about his health is considered as standard, nevertheless, there are some circum-stances, such as absence of the resident, extremes of age, and cognitive impairment, which impair or prevent the direct participation of respondents in surveys; in such situations, the use of a substitutive respondent, a proxy, has been fre-quent(4). Children and/or adolescents represent the groups
with higher percentage of use of substitute respondents in the National Survey by Household Sampling (Pesquisa Nacional por Amostragem de Domicílio – PNAD)(5).
Studies regarding the perception of parents about issues related to child health, such as body weight, eating habits(6),
oral health(7), quality of life related to health(8), among other
outcomes, have become more frequent. Parents’ opinions about such aspects may inluence the use of health services(8),
as well as the adoption of health-promotion actions. Therefore, knowing the parents and/or guardians evalu-ations about health of children who attended public and private daycare centers in the municipality of Balneário Camboriú, state of Santa Catarina, and investigating the as-sociation of socioeconomic and demographic factors as well as factors regarding the state of health of children and their parents, were the main purposes of this study.
Methods
Santa Catarina and had an estimated population of 94,344 inhabitants in an area of 46.49km2, with a per capita gross
domestic product (GDP) of R$ 4,827.41(9) and human
de-velopment index (HDI) of 0.867(10).
In 2007, the Municipal Education Secretariat of Camboriú had 2,987 (62.2%) children enrolled in 20 municipal day-cares and 1,814, in 25 private dayday-cares (37.8%), totaling 4,801 children.
The sample size was initially calculated to assess the preva-lence of overweight among children in the daycares evalu-ated, through the Epi-Info program version 6.04 (Center for Disease Control, Atlanta, EUA). We considered the expected prevalence of overweight/obesity of 8.6%, found by Corso
et al(11), in children younger than 6 years old enrolled in
public daycares in the municipality of Florianópolis, Santa Catarina. Considering the conidence level of 95% and a margin of error of 3%, the number of children amounted to 314. The sampling procedure was performed in two stages; the design effect was estimated as 1.5, producing a sample of 471 children. Then, 25% was added to the result, assum-ing a non-response rate of 10%, and extra 15% to control confounding factors, totaling 589 children. At the end of the research, 531 children were actually evaluated (response rate of 90.2%). As the prevalence of ‘regular’ ratings in the child health assessments obtained in this study (8.1%) was very close to that for the calculation of overweight prevalence, the parameters used to estimate the initial sample remained.
The sample selection was conducted in two stages. In the irst, we randomly selected 20 daycare centers(12), among
the existing 45. In the second stage, we selected children to be included in the study, among the ones enrolled in the selected daycares. Children were numbered and then, a sys-tematic selection was performed by a fraction of the sample (k), obtained by the division of the total number of children enrolled by the sample size. Children who, after three visits to the daycare, were not present, or the ones that, for some reason, did not have their anthropometric data collected, were considered losses.
Data collection occurred from October 2007 to September 2008, and included a questionnaire developed by the authors based on literature review and anthropometric measure-ments. Prior to the ieldwork, we performed a pre-test of the questionnaire and researchers were trained to obtain measures of weight and height.
The questionnaire was sent to parents/guardians by the children evaluated, with instructions to be preferably com-pleted by the child’s mother and delivered in the nursery.
The instrument included data about the child and the parent. Data on identiication of the child were collected: sex; age (up to 2 years or over 2 years old); type of daycare (public or private); overweight; skin color (white or not white (yellow, black, and native American); maternal rating regarding the child’s weight (underweight, normal weight or overweight); maternal assessment on the child’s quantitative dietary intake (little, normal, or plenty); hospitalization in the last year; duration of breastfeeding (≥6 months, <6 months, no) and low birth weight (yes – ≤2500g, no).
The evaluation of the mother and/or guardian regarding child health has been asked through a single question: “How do you rate your child’s health?” The response options were: very good, good, fair, poor and very poor. For analysis, the irst two categories were grouped and indicated the evalu-ation of good health, and the last three showed negative health.
We also included variables regarding the caretaker, such as: type of bond with the child (mother, father, relative or other), sex, marital status (with or without a stable relation-ship), skin color self-assessed as: white or not white (black/ mulatto, yellow – Asian– or Native American), education (until 8, from 8 to 11 years and more than 11 years), current weight and height, excess weight(13), health self-assessment
in comparison with previous years (better, same or worse) and presence of chronic disease (none, one, and two or more).
For the measurement of weight in children under 2 years old, we used a pediatric scale of 15kg (Toledo®, São Bernardo
do Campo, state of São Paulo). Children were weighed with a minimum of clothing, barefoot, and were placed in the center of the scale, seated or lying down, so that the weight stayed evenly distributed. Length was obtained through a wooden handmade, 99cm long, anthropometer, with the child lying supine, the head secured by an assistant, the knees straight, and feet forming a 90º angle, supported by the wooden base of the ruler. With children older than 2 years, we used a Plenna® (São Paulo) digital scale, with a maximum capacity
of 150kg and 100g scale. Children were weighed only once, barefoot, with little clothing. To measure height, we used a Soehnle® (Germany) digital stadiometer. Children were
barefoot, standing, leaning against a lat vertical surface, with arms down and hands leaning on thighs.
Classiication of the child nutritional status was based on the distribution of body mass index (BMI)(14) Z scores.
to +2(15) were considered overweight. Individual Z scores of
children younger than 5 years old were calculated with the aid of the Anthro® application (WHO, Geneva) and for older
children, were calculated manually.
Data were tabulated in the Epidata® software (Epidata
Association, Odense, Denmark), in which protections for data entry were created. In addition, questionnaires were reviewed and coded by the researchers, double entered, and then checked on Epi-Info, version 6.04. The descriptive analysis of the variables allowed the veriication of extreme and/or abnormal values.
Associations between child health evaluation and the variables investigated were analyzed through the Wald’s test. For crude and adjusted analysis, we calculated the preva-lence ratios (PR) and their respective conidence intervals of 95% (95%CI), by means of Poisson regression, adjusted for complex designs. The inclusion of the variables in the adjusted analysis followed a hierarchical model(12). First, we
included the socioeconomic and demographic variables for children, followed by the remaining variables for children. Subsequently, the socioeconomic and demographic variables
of the parents/guardians were included and, inally, those related to parents health status. Variables with p≤0.25 were added in the multivariate analysis and remained when the value was p≤0.05.
Prior to data collection, the research project was subjected and approved by the Research Ethics Committee of the in-stitution, under registration number 403/07. Participants were only children whose parents signed the informed consent form.
Results
Among the 589 questionnaires handed out among the parents of the selected children, 531 (90.2%) were returned completed. The rate of completion by question ranged from 92.8 (income) to 100% (child’s sex and type of daycare). Characteristics of children and their parents, as well as the inferential analysis, are available in Tables 1 to 4.
Most children were from public daycare centers (75.9%) and there was an even distribution of boys (n=261, 49%) and girls (n=270, 51%). Age ranged from 1.5 months to
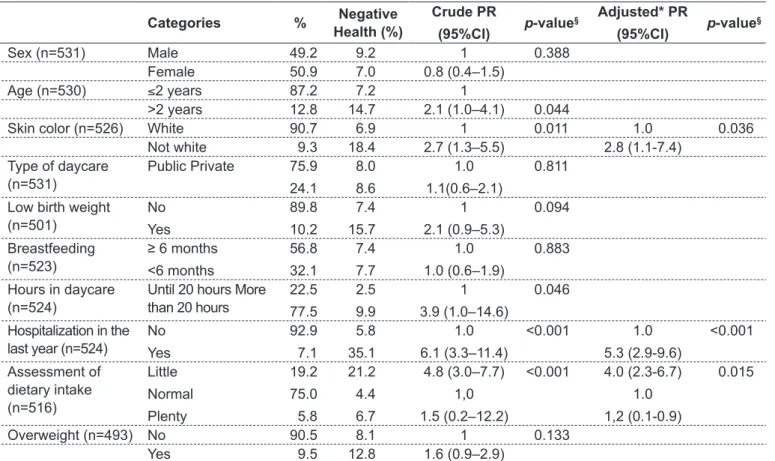
Table 1 - Characteristics of children attending daycares and their association with negative health evaluation
Categories % Negative Health (%)
Crude PR
(95%CI) p-value
§ Adjusted* PR
(95%CI) p-value
§
Sex (n=531) Male 49.2 9.2 1 0.388
Female 50.9 7.0 0.8 (0.4–1.5) Age (n=530) ≤2 years 87.2 7.2 1
>2 years 12.8 14.7 2.1 (1.0–4.1) 0.044
Skin color (n=526) White 90.7 6.9 1 0.011 1.0 0.036
Not white 9.3 18.4 2.7 (1.3–5.5) 2.8 (1.1-7.4) Type of daycare
(n=531)
Public Private 75.9
24.1
8.0
8.6
1.0
1.1(0.6–2.1)
0.811
Low birth weight (n=501)
No
Yes
89.8
10.2
7.4
15.7
1
2.1 (0.9–5.3)
0.094
Breastfeeding (n=523)
≥ 6 months <6 months
56.8
32.1
7.4
7.7
1.0
1.0 (0.6–1.9)
0.883
Hours in daycare (n=524)
Until 20 hours More than 20 hours
22.5
77.5
2.5
9.9
1
3.9 (1.0–14.6)
0.046
Hospitalization in the last year (n=524)
No
Yes
92.9
7.1
5.8
35.1
1.0
6.1 (3.3–11.4)
<0.001 1.0
5.3 (2.9-9.6)
<0.001
Assessment of dietary intake (n=516)
Little
Normal
Plenty
19.2
75.0
5.8
21.2
4.4
6.7
4.8 (3.0–7.7)
1,0
1.5 (0.2–12.2)
<0.001 4.0 (2.3-6.7)
1.0
1,2 (0.1-0.9)
0.015
Overweight (n=493) No 90.5 8.1 1 0.133
Yes 9.5 12.8 1.6 (0.9–2.9)
7.5 years, and the median age was 4.3 years. Most of the children were older than 2 years (87.2%). Skin color was predominantly white, for both: studied children (90.8%), and for their mothers and/or guardians (85.3%). Out of the group of interviewees, mothers represented 95.7% and fathers, relatives, and others represented the rest.
A major share of the children had their health rated as very good (50.6%), or good (41.3%), while 8.1% (95%CI 5.8–10.4%) of parents rated the health of their children as regular. None of the children had their health rated as poor or very poor.
Children hospitalized in the previous year, with black, yellow or native American skin color, who remained more than 20 hours per week in daycare and with food intake considered quantitatively ‘little’ by parents presented higher prevalence of health rated as regular. Overweight among children showed a trend towards statistical association with the outcome. Children of parents who reported drinking
alcohol were twice as likely to have their health evaluated negatively.
The reference of hospitalizations in the 12 months prior to data collection was the variable with the greatest magnitude of association in the crude analysis, adjusted and stratiied by type of daycare. Children hospitalized in the 12 months prior to data collection presented 5-fold higher chances of having their health classiied as regular by parents.
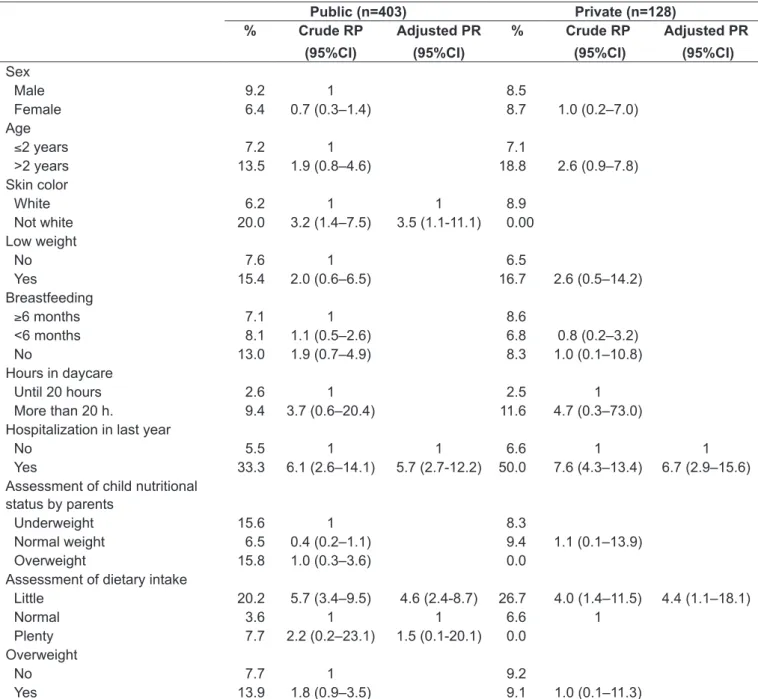
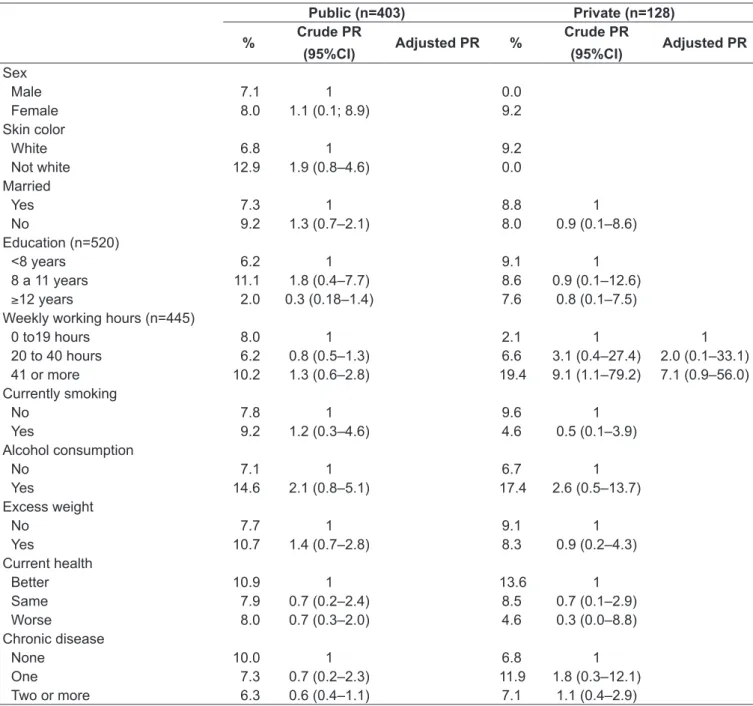
Analyses stratiied according to type of daycare (public or private) indicated differences in factors associated with negative health assessment in the population studied. Preschoolers with black, yellow, or indigenous skin color had their health rated as regular more frequently in public nurseries. Among children in private daycare centers, there was a trend in the action of parents’ education as a protective factor. The working hours of parents who worked more than 40 hours weekly was associated with a worse child health assessment only in private schools (Table 2).
Table 2 - Characteristics of parents of children attending daycares and their association with negative health evaluation
Categories % Negative Health (%)
Crude PR
(95%CI) p-value
§ Adjusted* PR
(95%CI) p-value
§
Sex (n=529) Male 4.2 4.6 1 0.543
Female 95.8 8.3 1.8 (0.2–14.0)
Skin color (n=521) White 85.2 7.4 1 0.207 Not white 14.8 11.7 1.6 (0.8–3.3)
Education (n=520) <8 years
8 to 11 yrs.
≥12 years
30.2
45.0
24.8
6.4
10.7
5.4
1.0
1.7 (0.5–5.7)
0.9 (0.3–2.4)
0.382
Weekly working hours (n=531)
0 to19 hours
20 to 40 hours
41 or more
35.0
36.0
29.0
6.5
6.3
12.3
1
1.0 (0.5–1.8)
1.9 (0.9–4.2)
0.919
0.104 Currently Smoking
(n=525)
No 81.3 8.2 1 0.990
Yes 18.7 8.2 1.0 (0.3–3.0) Alcohol consumption
(n=523)
No
Yes
85.1
14.9
7.0
15.4
1
2.2 (1.1–4.5)
0.033 1
2.1 (1.0-4.5)
0.065
Overweight (n=500) No
Yes
72.0
28.0
8.1
10.1
1
1.3 (0.7–2.2)
0.423
Current health (n=511)
Better
Same
Worse
15.16
5.8
19.2
11.7
8.0
7.2
1
1.0 (0.6–1.6)
0.5 (0.1–2.0)
0.928
0.278 Chronic disease
(n=531)
None
One
Two or more
36.5
28.8
34.7
9.3
8.6
6.5
1.0
0.9 (0.4–2.5)
0.7 (0.5–1.1)
0.863
0.106
Discussion
The prevalence of negative assessments by parents was of 8.1% among the children evaluated. PNAD data from 1998 indicated that the percentage of children under 1 year old with evaluation of very good health was 40.4%, and, in the group from 1-4 years old, it was 38.5%(5), while in the
present study incidences were a little higher for the category ‘very good’ and similar to ‘good’ (50.6 and 41.3%, respec-tively). The comparability of prevalence of negative ratings
of child health by parents with the prevalence observed in other studies is limited, since few studies question directly the perception of parents about children’s health.
In some studies, the evaluation was performed using the Child Health Questionnaire – a multidimensional instru-ment that represents the generic measure of health status and well being of the child and allows us to measure, by scores, the evaluation of children’s health. In general, the authors chose to analyze the scores of the different dimensions of the questionnaire, using as a cutoff point the 15th percentile in Table 3 - Prevalence (%) and crude and adjusted prevalence ratios (PR) and conidence intervals of 95% (95%CI), of negative health assessments in children from public and private daycares: child variables
Public (n=403) Private (n=128) % Crude RP
(95%CI)
Adjusted PR (95%CI)
% Crude RP (95%CI)
Adjusted PR (95%CI)
Sex
Male 9.2 1 8.5
Female 6.4 0.7 (0.3–1.4) 8.7 1.0 (0.2–7.0)
Age
≤2 years 7.2 1 7.1
>2 years 13.5 1.9 (0.8–4.6) 18.8 2.6 (0.9–7.8) Skin color
White 6.2 1 1 8.9
Not white 20.0 3.2 (1.4–7.5) 3.5 (1.1-11.1) 0.00 Low weight
No 7.6 1 6.5
Yes 15.4 2.0 (0.6–6.5) 16.7 2.6 (0.5–14.2)
Breastfeeding
≥6 months 7.1 1 8.6
<6 months 8.1 1.1 (0.5–2.6) 6.8 0.8 (0.2–3.2)
No 13.0 1.9 (0.7–4.9) 8.3 1.0 (0.1–10.8)
Hours in daycare
Until 20 hours 2.6 1 2.5 1
More than 20 h. 9.4 3.7 (0.6–20.4) 11.6 4.7 (0.3–73.0) Hospitalization in last year
No 5.5 1 1 6.6 1 1
Yes 33.3 6.1 (2.6–14.1) 5.7 (2.7-12.2) 50.0 7.6 (4.3–13.4) 6.7 (2.9–15.6) Assessment of child nutritional
status by parents
Underweight 15.6 1 8.3
Normal weight 6.5 0.4 (0.2–1.1) 9.4 1.1 (0.1–13.9)
Overweight 15.8 1.0 (0.3–3.6) 0.0
Assessment of dietary intake
Little 20.2 5.7 (3.4–9.5) 4.6 (2.4-8.7) 26.7 4.0 (1.4–11.5) 4.4 (1.1–18.1)
Normal 3.6 1 1 6.6 1
Plenty 7.7 2.2 (0.2–23.1) 1.5 (0.1-20.1) 0.0 Overweight
No 7.7 1 9.2
the distribution of the population of the study itself, i.e., the 15% with the worst scores for dimensions of overall health(16).
Some factors related to the use of proxy respondents for the evaluation of health have been highlighted in the lit-erature(5,17). In elderly participants of the Bambuí Project(17),
when authors analyzed differences in the pattern of responses in health interview surveys, and the respondent was the interviewee himself or someone who assessed him, it was observed that the evaluation of the interviewee included factors beyond physical health, such as education, while
for the proxy respondents, only the number of illnesses and hospitalizations were associated(17). In the 1998 PNAD, in
the group of children and adolescents under 15 years old, more than 90% of the health evaluations were performed by other people(5).
A qualitative research(18) sough to evaluate the
differ-ences in the understanding of parents and children about issues related to health and quality of life, and the authors observed that children and parents interpreted the mean-ings of the items in a very similar way. However, children Table 4 - Prevalence (%) and crude and adjusted prevalence ratios (PR) and conidence intervals of 95% (95%CI), of negative health assessments in children attending public and private daycares: parents variables
Public (n=403) Private (n=128) % Crude PR
(95%CI) Adjusted PR %
Crude PR
(95%CI) Adjusted PR
Sex
Male 7.1 1 0.0
Female 8.0 1.1 (0.1; 8.9) 9.2
Skin color
White 6.8 1 9.2
Not white 12.9 1.9 (0.8–4.6) 0.0
Married
Yes 7.3 1 8.8 1
No 9.2 1.3 (0.7–2.1) 8.0 0.9 (0.1–8.6)
Education (n=520)
<8 years 6.2 1 9.1 1
8 a 11 years 11.1 1.8 (0.4–7.7) 8.6 0.9 (0.1–12.6)
≥12 years 2.0 0.3 (0.18–1.4) 7.6 0.8 (0.1–7.5) Weekly working hours (n=445)
0 to19 hours 8.0 1 2.1 1 1
20 to 40 hours 6.2 0.8 (0.5–1.3) 6.6 3.1 (0.4–27.4) 2.0 (0.1–33.1) 41 or more 10.2 1.3 (0.6–2.8) 19.4 9.1 (1.1–79.2) 7.1 (0.9–56.0) Currently smoking
No 7.8 1 9.6 1
Yes 9.2 1.2 (0.3–4.6) 4.6 0.5 (0.1–3.9)
Alcohol consumption
No 7.1 1 6.7 1
Yes 14.6 2.1 (0.8–5.1) 17.4 2.6 (0.5–13.7)
Excess weight
No 7.7 1 9.1 1
Yes 10.7 1.4 (0.7–2.8) 8.3 0.9 (0.2–4.3)
Current health
Better 10.9 1 13.6 1
Same 7.9 0.7 (0.2–2.4) 8.5 0.7 (0.1–2.9)
Worse 8.0 0.7 (0.3–2.0) 4.6 0.3 (0.0–8.8)
Chronic disease
None 10.0 1 6.8 1
One 7.3 0.7 (0.2–2.3) 11.9 1.8 (0.3–12.1)
tended to chose more extreme scores with greater ease than their parents(18).
Another factor that can inluence health assessments by a third party is the gender of the evaluator(19). Some authors
chose to stratify the analysis according to sex of respon-dent or used it as a control variable(16). Among children
in daycare centers from Camboriú, which represented the population in this study, questionnaires were distributed to the guardians with instructions to be illed preferably by mothers, so less than 5% of the questionnaires were answered by other caretakers.
Socioeconomic, psychological, and environmental factors associated with parents have been described as determinants of child health. This process begins before birth and may last until the end of existence of the individual, inluencing the process of health and illness(20,21). However, among the
children assessed, in the analysis without stratiication by type of daycare, the only variable from parents that remained associated even after adjustment was alcohol consumption. Parents who reported alcohol consumption rated their chil-dren’s health more negatively. Parents of children with poorer health may use alcohol to relieve stress. Reasons given by parents for alcohol consumption in the family environment in detriment of other places are related mainly to conve-nience, which includes lower cost, security, celebration of social occasions and the need to take care of the children(22).
Among preschool children in private institutions, the working hours of the mother and/or guardian were associ-ated with worse health assessments of the child. Studies, that evaluated the association between time and child health, presented different results, modulated by the social and cultural contexts of the sites of research(23,24). In a study
with Californian children, authors found that the perception about the role of maternal employment on health and on children’s behavior was considered more important by the father and teachers than by the mothers(23).
In overweight children, we found a trend towards poorer health assessments. In a study(16) that estimated the
associa-tion between overweight and health related to quality of life, the only area that remained associated with negative evaluation of health for obese children of both genders was overall health. Overweight boys had 3.5-fold higher chances of having their health assessed negatively, and overweight girls had 2.1-fold higher chances. The magnitude of dif-ferences for the other domains was generally low and there was no evidence of signiicant impact on many dimensions. Most children with excess weight were rated as being
as healthy as those with adequate weight(16). In general,
parents’ evaluations of overweight/obese children differ little from those of parents of healthy weight children(16).
As health is a normatively deined concept, the still very popular view that children excess weight is beneicial may reduce parents’concern about their children weight gain. Stereotypes of overweight children portrayed in the media tend to be, at the extreme spectrum, serious, and may also distort the lay perception of overweight(25). Overweight
children can be isolated in social life, suffer discrimination and other problems during childhood(26).
In the present study, reduced food consumption was as-sociated with negative health assessments by the parents. In a study performed with children, to assess parents’ percep-tions of their children excess weight, authors observed that only the perception regarding the amount of food intake of their children was signiicantly related to the child’s body weight(27). Furthermore, the amount of food consumed by the
child may be linked to acute or chronic diseases, in which the reduction of child appetite is common. In preschoolers, physiological lack of appetite represents a common com-plaint among parents. Changes in growth rate and more interest in the environment are common causes of reduced dietary intake in preschoolers(28).
Children who were hospitalized in the 12 months preced-ing the study had poorer rated health. A study that sought to identify, in oficial data, the causes of hospitalization in chil-dren aged 0 to 4 years showed a heterogeneous distribution of morbidity in the various regions of the country. Authors found that the respiratory diseases represented the main cause of hospitalization, followed by infectious and parasitic diseases(29). Hospitalization is a stressful experience,
involv-ing profound adaptation of the child and the family, to the various changes that happen in their daily life(30). The family
shows fear of losing the afiliation that unites its members, goes through changes in family roles, and siblings may feel abandoned. Such situation may also cause family disputes, marital problems, besides economic imbalance, which may be linked to the job loss of one or both spouses(31).
the costal region of the state. However, the precaution taken by the authors in the study design and data analysis, such as increasing the sample size, the use of speciic commands in the analyses that considered the design effect, among others, indicated that the results can be extrapolated with caution in daycares in the municipality of Camboriú.
Finally, it was found that most parents evaluated the health of their children positively. Children with black, brown or indigenous skin colors; with dietary intake rated
as little by parents or who were hospitalized in the previous year presented higher chances of having their health rated as regular. It is suggested that further studies evaluate the different dimensions of health in preschool children, since the search for health care services depends on the degree of severity perceived by the mother and/or guardian. Thus, understanding the aspects considered by caregivers in the evaluation of child health represents an important object of investigation.
References
1. World Health Organization [homepage on the Internet]. Child Health [cited 2011 Oct 17]. Available from: http://www.who.int/topics/child_health/en/ 2. Idler EL, Benyamini Y. Self-rated health and mortality: a review of twenty-seven
community studies. J Health Soc Behav 1997;38:21-37.
3. Martins AM, Barreto SM, Pordeus IA. Objective and subjective factors related to self-rated oral health among the elderly. Cad Saude Publica 2009; 25:421-35.
4. Jardim R, Barreto SM, Gonçalves LG. Coniabilidade do informante secundário em inquéritos de saúde. R Bras Est Pop 2009;26:141-4.
5. Dachs JN. Factors determining inequalities in the health condition self-assessment in Brazil: analysis of data of PNAD/1998. Cienc Saude Colet 2002;7:641-57.
6. Perrin EM, Jacobson Vann JC, Benjamin JT, Skinner AC, Wegner S, Ammerman AS. Use of a pediatrician toolkit to address parental perception of children’s weight status, nutrition, and activity behaviors. Acad Pediatr 2010;10:274-81.
7. Butani Y, Gansky SA, Weintraub JA. Parental perception of oral health status of children in mainstream and special education classrooms. Spec Care Dentist 2009;29:156-62.
8. Varni JW, Limbers CA, Burwinkle TM. Impaired health-related quality of life in children and adolescents with choronic conditions: a comparative analysis of 10 disease clusters and 33 disease categories/severities utilizing the PedsQL 4.0 Generic Core Scales. Health Qual Life Outcomes 2007;5:43.
9. Instituto Brasileiro de Geograia e Estatística [homepage on the Internet]. O Brasil: município por município [cited 2008 Oct 13]. Available from: http://www. ibge.gov.br
10. Programa das Nações Unidas para o Desenvolvimento [homepage on the Internet]. Índice de Desenvolvimento Humano - Municipal, 1991 e 2000 [cited Oct 13, 2008]. Available from: http://www.pnud.org.br/atlas/ranking/IDH-M%20 91%2000%20Ranking%20decrescente%20(pelos%20dados%20de%20 2000).htm
11. Corso AC, Viteritte PL, Peres MA. Prevalence of overweight and its association with the area of residence among 6-year-old children enrolled in public childcare centers in Florianópolis, Brazil. Rev Bras Epidemiol 2004;7:201-9.
12. Victora CG, Barros FC. Epidemiologia da saúde infantil: um manual para diagnósticos comunitários. São Paulo: Hucitec-Unicef; 1991.
13. World Health Organization. Obesity: preventing and managing the global epidemic: report of the Who Consultation of Obesity. Geneva: WHO; 1997. 14. World Health Organization. The WHO child growth standards. Geneva:
WHO; 2006.
15. World Health Organization. Physical Status: The use and interpretation of antropometry. Report of a WHO Expert Committee [Technical Report Series, N° 854]. Geneva: WHO; 1995.
16. Wake M, Salmon L, Waters E, Wright M, Hesketh K. Parent-reported health status of overweight and obese Australian primary school children: a cross-sectional population survey. Int J Obes 2002;26:717-24.
17. Lima-Costa MF, Peixoto SV, Matos DL, Firmo JO, Uchôa E. The inluence of proxy respondents on health perception among older adults: a study based on the Brazilian National Household Survey (1998, 2003) and the cohort study in Bambuí, Minas Gerais State, Brazil. Cad Saude Publica 2007;23:1893-902.
18. Davis E, Nicolas C, Waters E, Cook K, Gibbs L, Gosch A et al. Parent-proxy and child self-reported health-related quality of life: using qualitative methods to explain the discordance. Qual Life Res 2007;16:863-71.
19. Waters E, Doyle J, Wolfe R, Wright M, Wake M, Salmon L. Inluence of parental gender and self-reported health, and illness on parent-reported child health. Pediatrics 2000;106:1422-8.
20. Maggi S, Irwin LJ, Siddiqi AA, Hertzman C. The social determinants of early child development: an overview. J Paediatr Child Health 2010;46:627-35. 21. Boney CM, Verma A, Tucker R, Vohr BR. Metabolic syndrome in childhood:
association with birth weight, maternal obesity, and gestational diabetes mellitus. Pediatrics 2005;115:e290-6.
22. Foster J, Read D, Karunanithi S, Woodward V. Why do people drink at home? J Public Health 2010;32:512-8.
23. Greenberger E, O’Neil R. Maternal employment and perceptions of young children: Bronfenbrenner et al. Revisited. Child Dev 1992;63:431-48. 24. Mindlin M, Jenkins R, Law C. Maternal employment and indicators of child
health: a systematic review in pre-school children in OECD countries. J Epidemiol Community Health 2009;63:340-50.
25. Campbell MW, Williams J, Hampton A, Wake M. Maternal concern and perceptions of overweight in Australian preschool- aged children. Med J Aust 2006;184:274-7.
26. Stunkard AJ, Wadden TA. Psychological aspects of severe obesity. Am J Clin Nutr 1992;55:524S-32.
27. Bossink-Tuna HN, L’Hoir MP, Beltman M, Boere-Boonekamp MM. Parental perception of weight and weight-related behaviour in 2-to 4-year-old children in the eastern part of the Netherlands. Eur J Pediatr 2009;168:333-9. 28. Vitolo MR. Nutrição - da gestação ao envelhecimento. Rio de Janeiro:
Rubio; 2008.
29. Oliveira BR, Vieira CS, Collet N, Lima RA. Causes of hospitalization in the National Healthcare System of children aged zero to four in Brazil. Rev Bras Epidemiol 2010;13:268-77.
30. Milanesi K, Collet N, de Oliveira BR, Vieira CS. Psychological suffering of the families of hospitalized children. Rev Bras Enferm 2006;59:769-74. 31. Crepaldi MA. Famílias de crianças hospitalizadas: os efeitos da doença e da