Abstract
Objective: To analyze the relation between nutritional status, food habits and physical activity level in schoolchildren.
Methods: A cross-sectional study was carried out with 661 schoolchildren, from 6 to 14 years old, enrolled in public and private schools located in the urban area of Ouro Preto, state of Minas Gerais, Brazil. A semi-structured questionnaire was applied to collect data on demographic, socio-economic, anthropometric and level of physical activity variables. Schoolchildren were classiied according to criteria for body mass index by age, body fat percentage and physical activity level, respectively. Dietary data were collected through a validated food frequency questionnaire speciic for children and adolescents. Food consumption was evaluated according to an adaptation of the Recommended Foods Score, whose objective is the assessment of overall diet quality with a focus on healthy food consumption.
Results: We observed high frequency of overweight according to body mass index per age (20.1%) and body fat percentage (22.8%), as well as physical inactivity (80.3%) among schoolchildren. We also found low scores on the Recommended Foods Score in 77.2% of students. There was no signiicant relation between overweight and physical inactivity or food consumption (p > 0.05).
Conclusion: Schoolchildren had a high frequency of overweight, which, alone, was not associated with the high physical inactivity and the low quality diet observed. Therefore, more studies should be performed to identify other factors besides those already described, which may be inluencing overweight in this population.
J Pediatr (Rio J). 2012;88(5):406-12: Overweight, obesity, food habits, physical activity, child, adolescent.
Original article
Copyright © by Sociedade Brasileira de Pediatria406
Introduction
The early development of overweight and obesity has increased alarmingly among children and adolescents worldwide, representing a public health problem that can cause damage in the short and long term and may be an important predictor of obesity in adulthood.1
The Household Budget Survey, conducted in 2008-09 in Brazil, revealed that 33.5% of children aged 5-9 years are overweight and 21.5% of adolescents are either overweight
or obese.2 The Survey also found a large increase in the prevalence of overweight among young Brazilians in the last 3 decades.
According to some studies, this growing increase of excess weight can be explained by environmental and behavioral factors; among them, the reduction of physical activity and the adoption of inadequate eating habits, increasing the energy supply. Such factors seem to be the
Association between nutritional status, food habits
and physical activity level in schoolchildren
Lorene G. Coelho,1 Ana Paula C. Cândido,2 George L.L. Machado-Coelho,3 Silvia N. de Freitas4
1. MSc, Saúde e Nutrição, Universidade Federal de Ouro Preto (UFOP), Ouro Preto, MG, Brazil. 2. PhD, Ciências Biológicas, UFOP, Ouro Preto, MG, Brazil.
3. PhD, Parasitologia, Universidade Federal de Minas Gerais (UFMG), Belo Horizonte, MG, Brazil. 4. PhD, Saúde Pública, UFMG, Belo Horizonte, MG, Brazil.
No conflicts of interest declared concerning the publication of this article.
Financial support:National Council for Scientific and Technological Development - CNPq (process no. 474965/2004-0; Edital CNPq 19/2004-Universal).
Suggested citation: Coelho LG, Cândido AP, Machado-Coelho GL, de Freitas SN. Association between nutritional status, food habits and physical activity level in schoolchildren. J Pediatr (Rio J). 2012;88(5):406-12.
most related to the scenario of positive energy balance characteristic of obesity.3-5 Nevertheless, in Brazil,5 the different impacts of dietary habits and physical activity on the prevalence of overweight are unknown, especially in children and adolescents.
It is known that these behavioral factors are acquired in childhood and adolescence, so it is essential to study them for the identiication of healthy habits; since, according to Schieri et al.,6 the increased consumption of foods rich in nutrients, i.e., a better quality diet, can be considered as a strategy for prevention, control, and ight against obesity among children and adolescents.
Therefore, this study aimed to analyze the relationship between dietary habits, physical activity levels, and nutritional status of children and adolescents enrolled in public and private schools in the municipality of Ouro Preto, state of Minas Gerais.
Methods
Population and study design
The municipality of Ouro Preto, located in central Minas Gerais, had an average of 5,963 children (6-9 years old) and 4,897 adolescents (10-14 years old) enrolled in all schools located in the urban area in 2006.7
We conducted an epidemiological study and cross-sectional design in such students, which were selected by means of random sampling stratiied by the proportion of students according to age, sex, and school grade in public (n = 14) and private (n = 2) schools. The sample size (n = 850) was calculated according to the premise of 8% overweight prevalence, 3% level of accuracy desired, 20% losses, 90% power and 5% signiicance level.8 Children and adolescents with special needs were not included in the study.
Data collection and analysis
Data were collected by a trained group of researchers in the period of March to December 2006, by applying a semi-structured questionnaire in face-to-face interviews with volunteers and their parents. The following variables were included: demographic (age and sex), socio-economic (family income and parental education), anthropometric (weight, height and body fat), dietary, physical activity and sedentary activity levels.
The socio-economic variable family income was categorized and analyzed based on the Brazilian minimum wage at the time of the study (R$ 350.00). Parental education was categorized into beyond complete high school; complete elementary to incomplete high school; and lower than elementary school or illiteracy.
Regarding anthropometric variables, weight was measured on a Tanita BF542® scale (Tanita Corporation
of America, Arlington Heights, IL, EUA), while height was determined using a WCS® stadiometer. Measurements of weight and height were used to calculate body mass index (BMI). Children were classiied as having excess weight (overweight or obesity) based on BMI/age expressed as z score, calculated with the WHO-Anthro Plus 2007, and following the recommendations proposed by the World Health Organization.9 Schoolchildren with BMI > z score + 1 were considered overweight.
Bioelectrical Impedance (BIA) was performed using the RJL Quantum 101 tetrapolar apparatus (RJL Systems), applying a current of 800 µA at 50 kHz. The analysis was made according to the standard procedure.10 Individuals remained in supine position for 10 minutes before the evaluation, which occurred in room temperature of approximately 25 ºC. Body fat was determined using the software for children and adolescents from the BIA apparatus itself, and body fat percentage (BF%) was calculated with the values of resistance and reactance according to Chumlea et al.11 For the classiication of BF%, the recommendations of Taylor et al.12 were adopted.
Dietary variables were collected through a food frequency questionnaire (FFQ) developed and validated by Slater et al.,13 which is speciic for children and adolescents, and added by food items consumed locally according to Faria.14 The instrument presented a list of foods composed of 120 items, whose frequencies of consumption were categorized in never, less than once a month, once to 3 times per month, once a week, 2 to 4 times a week, once a day and 2 or more times daily. Such data were assessed by means of a healthy diet score, which refers to the Recommended Foods Score (RFS).
This score was initially developed by Kant et al.15 and McCullough et al.16 in order to verify the overall quality of the diet by using a FFQ, being focused on the consumption of fruits/vegetables, lean meats, cereals and low-fat dairy products. In this study, RFS was prepared using the methodology of these authors adapted to the characteristics of the present study and the recommendations of the Brazilian Ministry of Health17 regarding healthy diet for children and adolescents.
Thus, 50 of the 120 items of FFQ were selected to compose the list of recommended foods of the RFS (Table 1), and the score was calculated, adding one point for each item of food recommended and consumed at least once a week, which resulted in a maximum score of 50 points.
Table 1 - Components of the adapted Recommended Foods Score
Groups Foods
Vegetables Tomato, broccolis or caulilower, spinach, mustard or sow thistle, cabbage, carrot, lettuce, swiss chard or round cabbage, watercress or rocket, fern sprouts, ora-pro-nobris, corn or peas, squash, beetroot, chayote, zucchini, okra, cucumber, yam, potato, sweet potato, boiled cassava
Fruit Apple or pear, orange, cantaloupe or watermelon, orange juice or lemonade, other fruit juices, banana, strawberry, pineapple, tangerine, papaya, mango, guava, plum or kiwi, grapes
Cereals Various types of bread, cereal bar, white rice
Dairy Skimmed milk, fermented milk, fruit vitamins, natural yogurt or fruit yogurt, diet yogurt, low-fat cheese
Legumes Beans, soy
Lean meats Cooked, roasted or grilled chicken, baked or broiled ish Maximum score 50 points
Statistical Analysis
The statistical analysis was performed with the PASW Statistics Grad Pack 17.0 software. RFS data were divided into quintiles based on their sample distribution. The association of the nutritional status of the students in each of the four lower quintiles was compared to the highest quintile of consumption.
Data normality was veriied by the Kolmogorov-Smirnov test. For statistical analysis, we used the Student t test or Mann-Whitney test according to the presence of data homoscedasticity.
The association between nutritional status of children, by BF%, and the possible explanatory variables (socio-demographic, dietary and physical activity/inactivity) were analyzed through the Pearson chi-square test or Fisher exact and odds ratio, as well as by univariate logistic regression model.
It was considered as statistically signiicant, the probability of less than 5% in all established tests.
Ethical Issues
This study was approved by the Research Ethics Committee of Universidade Federal de Ouro Preto (report nº 2004/46) in 2006, and informed consent was obtained from each child and adolescent, as well as from parents or legal guardians before the study.
Results
This study had a total of 661 students who participated and a loss percentage of 22% because part of the parents did not answer the FFQ and the collection of data on physical and sedentary activities adequately. However, the sample presented statistical power of 99.7%, considering the frequency of overweight observed in the children and adolescents studied.
Among students, 52.2% were boys and 47.8% girls, with mean age of 10.56±2.44 years. The frequency of excess weight according to BMI/age observed in these students was of 20.1%; and high BF% was veriied in 22.8%.
Regarding BF%, its mean value among students was of 30.28±9.95%. Among children (6-9 years), the mean BF% was 31.22±9.03%; among adolescents (10-14 years), 29.73±10.44%, and there was no signiicant difference between groups (p = 0.15).
Table 2 presents demographic, socio-economic, anthropometric, dietary and physical and sedentary activity levels according to stratiication per age. No signiicant difference was observed between family income, parental education, dietary intake, BMI and BF%. However, the levels of physical activity and sedentary activity were different (p = 0.03 and p = 0.04, respectively) between children and adolescents.
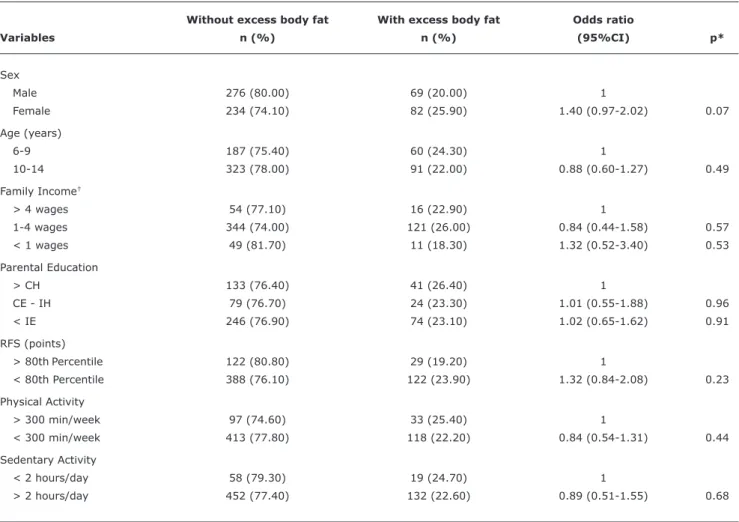
Table 3 presents the comparison between students with and without excess weight by BF% according to demographic, socio-economic, dietary, and physical and sedentary activity characteristics. It is noteworthy that there were no signiicant differences between the groups regarding the variables; however, there was difference regarding physical activity, in which 80.3% of individuals were classiied as inactive, with mean time of 250 minutes of physical exercise per week; 88.4% of students spent 2 hours per day in sedentary activities, with mean time spent watching television, playing videogames and using the computer of 3 hours and 20 minutes, 4 hours and 30 minutes and 4 hours and 10 minutes per week, respectively; and, when considering such activities together, the mean sedentary time was 23 hours/week and 3 hours and 30 minutes/day.
Table 2 - Demographic, socio-economic, physical/sedentary activity, dietary and anthropometric characteristics of children (6-9 years) and adolescents (10-14 years) from Ouro Preto, state of Minas Gerais, 2006
Children (6 to 9 years) Adolescents (10 to 14 years)
Variables n (%) n (%) Total p*
Family income†
> 4 wages 24 (34.30) 46 (65.70) 70
1-4 wages 181 (38.90) 284 (61.10) 465 0.45
< 1 wages 26 (43.34) 34 (56.66) 60 0.29
Parental education
> CH 64 (36.80) 110 (63.20) 174
CE - IH 39 (37.86) 64 (62.13) 103 0.85
< IE 125 (39.06) 195 (60.94) 320 0.62
Physical activity
> 300 min/week 38 (29.23) 92 (70.77) 130
< 300 min/week 209 (39.36) 322 (60.64) 531 0.03
Sedentary activity
< 2 hours/day 37 (48.05) 40 (51.95) 77
> 2 hours/day 210 (36.00) 374 (64.00) 584 0.04
RFS (points)
> 80th Percentile 55 (36.42) 96 (63.58) 151
< 80th Percentile 192 (37.65) 318 (62.35) 510 0.78
BMI/age
Eutrophic 193 (37.40) 323 (62.60) 516
Low BMI/age 3 (25.00) 9 (75.00) 12 0.57
Overweight 31 (37.35) 52 (62.65) 83 0.99
Obese 20 (40.00) 30 (60.00) 50 0.71
Body fat (%)
Normal 187 (36.67) 323 (63.33) 510
High 60 (39.74) 91 (60.26) 151 0.49
BMI = body mass index; CE = complete elementary school; CH = complete high school; IE = incomplete elementary; IH = incomplete high school; RFS = recommended foods score.
*Chi-square Pearson test or Fisher exact.
† Family income based on the minimum wage at the time of the study (R$ 350.00).
mean score between the groups with (15.73±6.81 points) and without (16.08±6.84 points) excess body fat, it was veriied that there was no signiicant difference between them (p = 0.56).
Finally, in univariate logistic regression analysis, we could not demonstrate a signiicant relationship between excess weight by BF% and the exposure factors analyzed.
Discussion
The present study revealed a high frequency of overweight (22.8% by BF%) among students from Ouro Preto, which was not associated with the low diet quality and the high level of physical inactivity. The study also found,
at analyzing the BF% of these young people in relation to age, a trend towards a higher BF% in children; however, no signiicant difference between children and adolescents was found, as already observed by Cândido et al.20 in a previous study conducted with the same population.
Table 3 - Nutritional status of children and adolescents studied, distributed according to demographic, socio-economic, dietary and physical/ sedentary activity variables, Ouro Preto, state of Minas Gerais, 2006
Without excess body fat With excess body fat Odds ratio
Variables n (%) n (%) (95%CI) p*
Sex
Male 276 (80.00) 69 (20.00) 1
Female 234 (74.10) 82 (25.90) 1.40 (0.97-2.02) 0.07
Age (years)
6-9 187 (75.40) 60 (24.30) 1
10-14 323 (78.00) 91 (22.00) 0.88 (0.60-1.27) 0.49
Family Income†
> 4 wages 54 (77.10) 16 (22.90) 1
1-4 wages 344 (74.00) 121 (26.00) 0.84 (0.44-1.58) 0.57
< 1 wages 49 (81.70) 11 (18.30) 1.32 (0.52-3.40) 0.53
Parental Education
> CH 133 (76.40) 41 (26.40) 1
CE - IH 79 (76.70) 24 (23.30) 1.01 (0.55-1.88) 0.96
< IE 246 (76.90) 74 (23.10) 1.02 (0.65-1.62) 0.91
RFS (points)
> 80thPercentile 122 (80.80) 29 (19.20) 1
< 80th Percentile 388 (76.10) 122 (23.90) 1.32 (0.84-2.08) 0.23
Physical Activity
> 300 min/week 97 (74.60) 33 (25.40) 1
< 300 min/week 413 (77.80) 118 (22.20) 0.84 (0.54-1.31) 0.44
Sedentary Activity
< 2 hours/day 58 (79.30) 19 (24.70) 1
> 2 hours/day 452 (77.40) 132 (22.60) 0.89 (0.51-1.55) 0.68
95%CI = 95% confidence interval; CE = complete elementary school; CH = complete high school; IE = incomplete elementary school; IH = incomplete high school; RFS = recommended foods score.
* Chi-square Pearson test.
† Family income based on the minimum wage at the time of the study (R$ 350.00).
Dois Irmãos and Morro Reuter, state of Rio Grande do Sul, according to criteria from the National Health and Nutrition Examination Survey.
These indings show that the nutritional status of children and adolescents is of great interest for public health, once obesity in these age groups is often associated with the early development of other chronic diseases such as hypertension, dyslipidemia and diabetes mellitus.23 Furthermore, the effects of obesity in young people may lead to long term health problems, such as the increased risk of mortality, especially by cardiovascular diseases in adults who were obese during childhood and adolescence.23
It is known that maintaining a healthy lifestyle since childhood is of great importance for the prevention of obesity, once many characteristics of adult life are acquired and/or consolidated in this age group, making it important to evaluate determinant factors such as dietary habits and the practice of physical activities.24 As for the latter,
it is important to emphasize that the practice of physical activities among children and adolescents should be continually stimulated, because although the majority of diseases related to sedentary lifestyle will manifest only in adulthood, it is known that their development can begin in childhood or in adolescence.25
Therefore, some authors have conducted studies in order to investigate the practice of physical activity in these age groups, showing higher frequencies of inactivity among children and adolescents, which is consistent with the indings in the present work. Hallal et al.,25 for instance, showed a high prevalence of physical inactivity among adolescents, since 58.2% of them reported practicing fewer than 300 minutes/week of physical activity.
same authors observed an increased BF% and higher BMI in less active children; and that, activities such as watching television and playing videogames for more than 2 hours/ day are risk factors for overweight and obesity.
Considering the high levels of physical inactivity and sedentary activity presented in such studies,25-26 it is possible to verify that those were even higher among youth from Ouro Preto, which may be partly explained by some particular characteristics of the municipality. It is a historic city whose topography is mountainous, with many slopes and hills; the streets are narrow with an old pavement, there are few paved streets, and there is a shortage of suitable sites for practicing physical exercises, discouraging mainly children and adolescents.
As for food consumption, it is related to excess weight both due to the volume of food intake regarding the composition and quality of the diet and to dietary changes, such as the consumption of sweets (illed cookies, snacks, sweets) and soft drinks, which partly explain the continuous increase in adiposity in children and adolescents.22 In addition, foods such as fruit and vegetables, with lower energy density and that are more nutritious, are increasingly scarce in children’s diet; and an alternative approach to ight excess weight would be to encourage an increased consumption of these food items.4,27
However, few studies evaluate the consumption of fruits and vegetables as a protective factor against obesity,27 which represented a motivation to study the relation between dietary habits and obesity by a healthy diet score.
As for the present study, there was no association between students’ excess weight and food intake assessed by the RFS, corroborating the longitudinal intervention study performed by Epstein et al.28 These authors investigated the relation between healthy food and obesity in children aged 6-11 years and in their parents, and veriied no signiicant reduction in the percentage of overweight in the children who were encouraged to eat more fruit and vegetables over a 1-year follow-up.
In contrast, for Enes & Slater,23 an adequate consumption of fruit and vegetables represents a protective factor for the development of obesity, which was also observed in the study by Oliveira et al.,27 conducted with children aged 5-9 years, in which an inverse association between high frequency (three times per week) of vegetables consumption and overweight was observed.
Regarding the limitations of the study, a cross-sectional study only provides an isolated analysis of the characteristics of the population and does not allow establishing a causal relationship. The quantitative analysis of the students’ diet was not performed, which represents another limitation of this research. However, authors such as Fisberg29 report that the study of the diet, with its various combinations of foods, more than the consumption of individual food items or the
ingestion of nutrients, may be more interesting, since the food items are not consumed alone and relect the choice of each individual for a determined lifestyle. We also know that problems related to differences in the portioning of food and under/overestimation of food intake are often reported in studies of dietary investigation, which meant that the RFS was planned to score the foods selected in the questionnaire that were consumed weekly regardless of portion sizes, making it less affected by inaccurate reports about portioning.15
Another positive and important aspect to be considered in this study was the use of BF% instead of BMI as an indicator of obesity. Cândido et al.30 reported that although BMI is an easy and reproducible measurement of body fat, it is not a perfect measure of obesity, since height is represented as a covariate, and it changes with the result of aging, especially in growth phases like childhood and adolescence. Another problem is that, because BMI does not measure body fat directly, the cutoff points that deine obesity are statistical derivations for these age groups, and there is no consensus about them.
Thus, the present study provided the advantage of using BF% as an obesity indicator and a different approach to food consumption evaluation, which, although it did not show association with obesity in this population, may be used in other populations and/or in the study of other non-communicable chronic diseases.
We may conclude through the present study, that the population studied presented a high frequency of overweight, which, alone, was not associated with the high level of physical inactivity and the low quality diet observed. Therefore, more studies should be conducted to identify the possibility of interaction between these factors and even other factors besides those described that may be inluencing the presence of overweight in this population, to, thereby, support the development of actions and strategies to control and ight obesity among young people.
Acknowledgements
To the National Council for Scientiic and Technological Development for providing inancial support, to the Foundation for Research Support (Fundação de Amparo a Pesquisa) of the state of Minas Gerais for providing the scholarship for master’s degree and to Universidade Federal de Ouro Preto for the logistic support and transportation.
References
Correspondence: Lorene Gonçalves Coelho
Universidade Federal de Ouro Preto, Escola de Nutrição, sala 72 Campus Universitário Morro do Cruzeiro, s/n, Bauxita
CEP 35400-000 - Ouro Preto, MG - Brazil Tel.: +55 (31) 9166.7848
E-mail: [email protected]
18. Centers for Disease Control and Prevention. Physical activity and the health of young people. http://www.cdc.gov/healthyyouth/
physicalactivity/facts.htm. Access: 30/03/2011.
19. Centers for Disease Control and Prevention, Nutrition and Physical Activity Communication Team (NuPAC). Reducing children’s TV time to reduce the risk of childhood overweight: the Children’s Media Use Study: highlights report. March 2007. http://www.cdc. gov/nccdphp/ dnpa/obesity/pdf/TV_Time_Highligts.pdf. Access: 30/03/2011.
20. Cândido AP, Benedetto R, Castro AP, Carmo JS, Nicolato RL, Nascimento-Neto RM, et al. Cardiovascular risk factors in children
and adolescents living in an urban area of Southeast of Brazil: Ouro Preto Study. Eur J Pediatr. 2009;168:1373-82.
21. Mendonça MR, Silva MA, Rivera IR, Moura AA. Prevalence of overweight and obesity in children and adolescents from the city
of Maceió (AL). Rev Assoc Med Bras. 2010;56:192-6.
22. Triches RM, Giugliani ER. Obesity, eating habits and nutritional knowledge among school children. Rev Saude Publica. 2005;39:541-71.
23. Enes CC, Slater B. Obesity in adolescence and its main determinants. Rev Bras Epidemiol. 2010;13:163-71.
24. Mello ED, Luft VC, Meyer F. Obesidade infantil: como podemos ser eicazes? J Pediatr (Rio J). 2004;80:173-82.
25. Hallal PC, Bertoldi AD, Gonçalves H, Victora CG. Prevalence of sedentary lifestyle and associated factors in adolescents 10 to 12 years of age. Cad Saude Publica. 2006;22:1277-87. 26. Baruki SB, Rosado LE, Rosado GP, Ribeiro RC. Association between
nutritional status and physical activity in Municipal Schools in Corumbá – MS. Rev Bras Med Esporte. 2006;12:90-4.
27. Oliveira AM, Cerqueira EM, Souza JS, Oliveira AC. Childhood overweight and obesity: inluence of biological and environmental factors in Feira de Santana, BA. Arq Bras Endocrinol Metab. 2003;47:144-50.
28. Epstein LH, Gordy CC, Raynor HA, Beddome M, Kilanowski CK, Paluch R. Increasing fruit and vegetable intake and decreasing fat and sugar intake in families at risk for childhood obesity. Obes Res. 2001;9:171-8.
29. Fisberg RM. A qualidade da dieta e seus fatores associados em adultos residentes no Estado de São Paulo [tese]. São Paulo: Faculdade de Saúde Pública da USP; 2005.
30. Cándido AP, Alosta JP, Oliveira CT, Freitas RN, Freitas SN, Machado-Coelho GL. Anthropometric methods for obesity screening in schoolchildren: the Ouro Preto Study. Nutr Hosp. 2012;27:146-53.
2. Instituto Brasileiro de Geograia e Estatística (IBGE). Pesquisa de orçamentos familiares 2008 e 2009: antropometria e estado nutricional de crianças, adolescentes e adultos no Brasil. Rio de Janeiro: Ministério do Planejamento, Orçamento e Gestão; 2010. http://www.ibge.gov.br/home/estatistica/populacao/ condicaodevida/pof/2008_2009_encaa/pof_20082009_encaa.
pdf. Access: 06/04/2011.
3. Novaes JF, Franceschini SC, Priore SE. Food habits of well nourished and overweight children in Viçosa, Minas Gerais state, Brazil. Rev Nutr. 2007;20:633-42.
4. Mendonça CP, dos Anjos LA. Dietary and physical activity factors
as determinants of the increase in overweight/obesity in Brazil. Cad Saude Publica. 2004;20:698-709.
5. Nunes MM, Figueiroa JN, Alves JG. Overweight, physical activity and foods habits in adolescents from different economic levels,
Campina Grande (PB). Rev Assoc Med Bras. 2007;53:130-4. 6. Sichieri R, Souza RA. Strategies for obesity prevention in children
and adolescents. Cad Saude Publica. 2008;24:S209-23. 7. Instituto Nacional de Estudos e Pesquisas Educacionais Anísio
Teixeira. Matrícula do ensino fundamental no município de Ouro Preto, Minas Gerais, 2003. http://www.edudatabrasil.inep.gov. br/index.htm. Access: 04/09/2011.
8. Sampaio IB. Estatística aplicada à experimentação animal. 2ª edição. Belo Horizonte: Fundação de Estudo e Pesquisa em Medicina Veterinária e Zootecnia; 2002. 265p.
9. de Onis M, Onyango AW, Borghi E, Siyam A, Nishida C, Siekmann J. Development of a WHO growth reference for school-aged children and adolescents. Bull World Health Organ. 2007;85:660-7.
10. Bioelectrical impedance analysis in body composition measurement:
National Institutes of Health Technology Assessment Conference
Statement. Am J Clin Nutr. 1996;64:524S-32S.
11. Chumlea WC, Guo SS, Kuczmarski RJ, Flegal KM, Johnson CL, Heymsield SB, et al. Body composition estimates from NHANES
III bioelectrical impedance data. Int J Obes Relat Metab Disord. 2002;26:1596-609.
12. Taylor RW, Jones IE, Williams SM, Goulding A. Body fat percentages measured by dual-energy X-ray absorptiometry corresponding to
recently recommended body mass index cutoffs for overweight and obesity in children and adolescents aged 3-18 y. Am J Clin Nutr. 2002;76:1416-21.
13. Slater B, Philippi ST, Fisberg RM, Latorre MR. Validation of a semi-quantitative adolescent food frequency questionnaire applied at a public school in São Paulo, Brazil. Eur J Clin Nutr. 2003;57:629-35.
14. Faria VA. Padrão da dieta habitual e fatores de risco para doenças cardiovasculares em Ouro Preto, Minas Gerais, 2001 [dissertação]. Ouro Preto: Universidade Federal de Ouro Preto; 2007. 15. Kant AK, Schatzkin A, Graubard BI, Schairer C. A prospective study of
diet quality and mortality in women. JAMA. 2000;283:2109-15. 16. McCullough ML, Feskanich D, Stampfer MJ, Giovannucci EL, Rimm
EB, Hu FB, et al. Diet quality and major chronic disease risk in
men and women: moving toward improved dietary guidance. Am J Clin Nutr. 2002;76:1261-71.
17. Brasil. Ministério da Saúde. Portal da saúde: alimentação saudável.