A R C H I V E S
o f
F O U N D R Y E N G I N E E R I N G
Published quarterly as the organ of the Foundry Commission of the Polish Academy of Sciences
ISSN (1897-3310) Volume 12 Issue 2/2012
93 – 96
19/2
A R C H I V E S o f F O U N D R Y E N G I N E E R I N G V o l u m e 1 2 , I s s u e 2 / 2 0 1 2 , 9 3 - 9 6 93
Meta-stable Solidification Created by the
Detonation Method of Coating Formation
W. Wołczyński
a,*, G. Garzeł
a, J. Morgiel
a, C. Senderowski
b,
A. Pawłowski
a aInstitute of Metallurgy and Materials Science, Polish Academy of Sciences, Reymonta 25, 30-059 Kraków, Poland b
Military University of Technology, Kaliskiego 2, 00-908 Warsaw, Poland *Corresponding author. E-mail address: [email protected]
Received 10-05-2012; accepted in revised form 31-05-2012
Abstract
Particles of the Fe-Al type (less than 50 m in diameter) were sprayed onto the 045 steel substrate by means of the detonation method. The TEM, SAED and EDX analyses revealed that the Fe-Al particles have been partially melted in the experiment of coating formation. Particle undergone melting even within about 80% of its volume. Therefore, solidification of the melted part of particles was expected. Solidification differed significantly due to a large range of chemical composition of applied particles (from 15 at.% Al up to 63 at.% Al). A single particle containing63 at.% Al was subjected to the detailed analysis, only. The TEM / SAED techniques revealed in the solidified part of particle three sub-layers: an amorphous phase, A, periodically situated FeAl + Fe2Al5 phases, and a non-equilibrium phase, N.
A hypothesis dealing with the inter-metallic phases formation in such a single particle of the nominal composition N0 0.63 is presented. At first, the solid / liquid system is treated as an interconnection: substrate liquid nonmelted particle part/ / . Therefore, it is suggested that the solidification occurs simultaneously in two directions: towards a substrate and towards a non-melted part of particle. The solidification mechanism is referred to the Fe-Al meta-stable phase diagram. It is shown that the melted part of particle solidifies rapidly according to the phase diagram of meta-stable equilibrium and at a significant deviation from the thermodynamic equilibrium.
Keywords: Theory of Crystallization, Rapid Solidification Process, Fe-Al Coating, Meta-Stable Phase Diagram, Amorphous Phase
1. Introduction
The DGS, HVOF and plasma spraying techniques applied to production of coatings from powders offer practically unlimited abilities in the establishing composition of a coating. A control of the spraying parameters with the objective to obtain coatings with unique exploiting properties like resistance to abrasive wear, erosion, corrosion, high temperature corrosion or thermal shocks, as well as good adhesion and low porosity was the subject of number of works [1-6].
According to some considerations [4], [5], a temperature of particles during the deposition does not exceed the melting point.
However, TEM, SAED and EDX analyses revealed that the particles have been partially melted in the current experiment of coating by the detonation method.
Therefore, a solidification process is to be considered for the melted part of each particle. A solidification differs significantly due to the large range of chemical composition of applied particles (15 at.% - 63 at.% Al). A single particle containing63 at.% Al is subjected to the detailed analysis,N0 0.63.
A R C H I V E S o f F O U N D R Y E N G I N E E R I N G V o l u m e 1 2 , I s s u e 2 / 2 0 1 2 , 9 3 - 9 6 94
2. Experiment
The TEM and SAED techniques revealed three sub-layers of: an amorphous phase, A(A- area); periodically situated FeAl + Fe2Al5 phases, (columnar morphology – CC area) and a non-equilibrium phase, N, (N – area), Fig.1. Additionally, non-melted part of a deposited particle is also marked (OG – area).
Fig. 1. TEM morphology of the analyzed particle with nominal composition N0 0.63 (63 at.% Al) showing different sub-areas
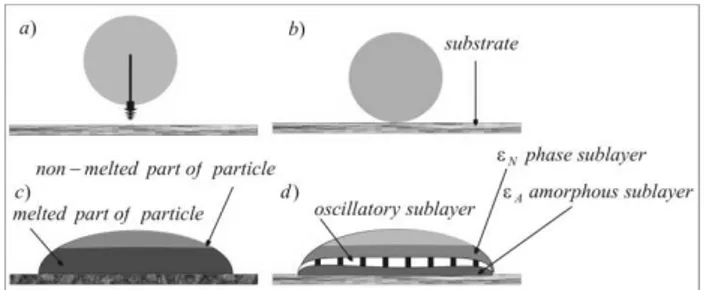
The stages of deposition are analyzed in Fig. 2.
Fig. 2. Stages of the Fe-Al particle deposition; a/ cold particle moves towards the substrate; b/ hot particle is in contact with the
substrate, c/ particle becomes partially melted due to the final temperature (1500 0C) which results from a shock, d/ melted part
of particle is subjected to different types of solidification
It was an oriented solidification in two directions, Fig. 3.
Fig. 3. Solidification of a deposited particle: a/ directions of the s/l interfaces movement and an activity of positive thermal gradients,
b/ particle morphology after solidification
The Al-solute diffusion from the melted part of particle towards the substrate is expected during solidification. It
substantially should improve the adhesion at the substrate/coating boundary.
It is to be concluded that solidification occurs according to the phase diagram of meta-stable equilibrium and in significant deviation from the thermodynamic equilibrium.
3. Thermodynamic explanation
A mechanism of both amorphous (A) and periodical sub-layers (CC) formations (by oscillatory mode) is explained in Fig. 4.
Fig. 4. Hypothetical Fe-Al phase diagram, (in accordance to [7]), developed for meta-stable equilibrium to show formation: A–amorphous phase and oscillatory structure, O = FeAl + Fe2Al5
An addition of the meta-stablesolidus lines (dashed lines) to the Fe-Al phase diagram for stable equilibrium allows for explaining the formation morphology of an oscillatory sub-layer (periodical mode of lamellae growth as shown in Fig. 2, Fig. 3.)
However, the amorphous A sub-layer is formed at the A – point (where solidus and liquidus lines superpose each over other). Thus, the equilibrium partition ratio changes significantly to reach its non-equilibrium value k3 k kA 1, Fig. 4.
The amorphous sub-layer appears first in the sequence at the intersection of shifted (and superposed one on the other solidus / liquidus lines) and the nominal content line, (A – point). The sub-layer with periodic structure is formed as second in the sequence just at the O - point. The oscillatory mode of the periodic structure formation is defined by the - double arrow. The O –point results from the shift of liquidus line to the position required by the A – point localization, Fig. 4.
The vAO - solidification rate, Fig. 3 is connected with the formation of both amorphous sub-layer of the A phase, and oscillatory sub-layer of the FeAl + Fe2Al5 phases. This rate is associated with the positive thermal gradient, GAO 0, which is
also shown schematically in the Fig. 3.
The temperatures of the solid / liquid interface have been defined in the Fig. 5. TA*is the solid / liquid interface temperature for the formation of the amorphous phase sub-layer and *
A R C H I V E S o f F O U N D R Y E N G I N E E R I N G V o l u m e 1 2 , I s s u e 2 / 2 0 1 2 , 9 3 - 9 6 95
Since * *
A O
T T both sub-layers appear in the sequence as discussed above. This criterion has been formulated by Umeda et al. [8]. The criterion has already been applied to the description of a diffusion interconnection formation, [9], during which different times of birth for appearing inter-metallic phases were recorded.
Fig. 5. Hypothetical modification of the Fe-Al phase diagram, which shows the localization of amorphous phase (A – point) and
oscillatory phases formations (O – point) due to the structure observation shown in Fig. 1
Some parameters applied to the description of second part of the discussed interconnection are:
N
v - solidification rate, Fig 3., is connected with the formation the non-equilibrium phase, N, in adequate sub-layer (N - area)
neighboring with the non-melted part of particle. GN is positive
thermal gradient associated with the vN solidification rate. The result of experiment it suggests that the N phase sub-layer was formed at the significant deviation from the thermodynamic equilibrium, Fig. 6.
Fig. 6. Scheme of the Fe-Al phase diagram with the suggested localization of the solidificationpath N0 NK for the
non-equilibrium solidification of the N - phase
The suggested deviation is described by the shift of both
liquidus and solidus lines to the new positions for which the partition ratio satisfies inequality,k kN 1
, [10], Fig. 6. As a result of the suggested shift the N- phase is the winner in competition with the - phase according to the Umeda et al. [8], criterion. Thus, the N phase is formed instead of the phase.
A localization of the end of solidification path, NK, Fig. 5, can be determined by means of the proper equation which results from the theoretical description dealing with segregation accompanying the solidification, [11].
1 1
0 0 0
, , 1; , ,
N
N
k
N N N k
K L
N k N N k N N k (1)
x- amount of solidifying phase, N, dimensionless, - back-diffusion parameter, dimensionless,
L
N - solute concentration in the liquid, shown on liquidus line. All the phase diagrams predicted schematically, Fig. 4-6, can be calculated using a professional program like the Thermocalc Software. Such phase diagram calculated for the meta-stable
equilibrium is shown in Fig. 7.
Fig. 7. Oscillatory mode of the FeAl + Fe2Al5 sub-layer formation explained by Al-Fe phase diagram for meta-stable equilibrium
The Al-Fe phase diagram (shown in Fig. 7). explains the oscillation observed in the CC – area visible in the particle morphology, Fig. 1. The solidification forms Fe2Al5 phase periodically to the FeAl phase as marked by the double arrow.
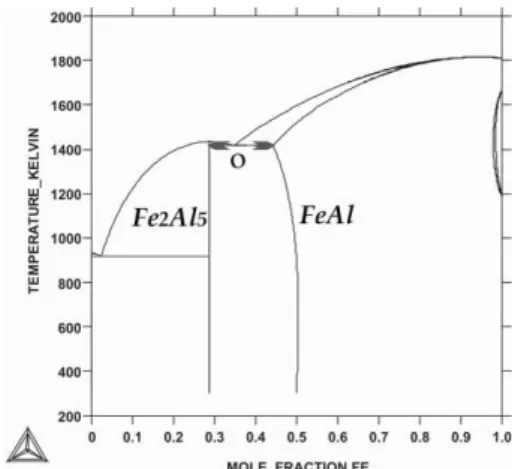
The phase diagram for the meta-stable equilibrium was superposed over the phase diagram for stable equilibrium to show the difference between solidification which can occur under both discussed conditions, Fig. 8. The expected lower localization of the meta-stable eutectic point, O, can be defined precisely. Alas, the calculation of the phase diagram for meta-stable equilibrium did not take into account the high pressure which was imposed in the experiment with detonation method of deposition.
Therefore, the difference (in temperature) between localizations of the stable eutectic point, E, and meta-stable
A R C H I V E S o f F O U N D R Y E N G I N E E R I N G V o l u m e 1 2 , I s s u e 2 / 2 0 1 2 , 9 3 - 9 6 96
Fig. 8. Superposition of the phase diagrams for meta-stable
equilibrium and for stable equilibrium, (dotted lines, [7])
The difference between E – point and O – point is about 17 K. However, the displacement of the O – point (in concentration) is also significant, Fig. 8. The double arrow marks the periodical mode of structure formation observed within the so-called oscillatory sub-layer shown in Fig. 2 as well as observed, Fig. 1.
4. Concluding remarks
The different solidification types observed within the melted part of deposited particle have been described.
The amorphous sub-layer of the A- phase was formed with the presence of the partition ratio which tends to unity due to the rapid solidification imposed by the technology, Fig. 4, Fig. 5.
The sub-layer inside of which the N- phase was formed with the deviation from equilibrium requires the partition ratio higher than its equilibrium value and solidification path shown in Fig. 6, is to be determined by means of equation (1).
The so-called oscillatory mode of the periodical formation of the eutectic lamellae (predicted in Fig. 4, Fig. 5) was confirmed by the thermodynamic calculation of the phase diagram for the
meta-stable equilibrium, Fig. 7, (Thermocalc Software – method). The control of the Fe-Al coating properties is possible by the creation different types of phases and different fractions of each solidified phase.
References
[1] Wang H.T., Li C.J., Yang G.J., Li C.X., Zhang Q.& Li W.Y. (2007). Microstructural characterization of cold-sprayed nano-structured FeAl inter-metallic compound coating and its ball-milled feedstock powders.Journal of Thermal Spray Technology. 16, 669-676. DOI: 10.1007/s11666-008-9225-x. [2] Devi S.C., Sikka V.K., Swindeman C.J. & Seals R.D. (1997). Application of reaction synthesis principles to thermal spray coatings. Journal of Materials Science. 32, 3315-3325. DOI: 10.1023/A:1018691826809.
[3] Kobayashi S. & Yakou T. (2002). Control of inter-metallic compound layers at interface between steel and aluminum by diffusion treatment. Materials Science and Engineering. A338, 44-53. DOI: 10.1016/S0921-5093(02)00053-9. [4] Guilemany J.M., Lima C.R.C. & Cinca N. (2006). Studies of
Fe–40Al coatings obtained by high velocity oxy-fuel.
Journal of Surface & Coating Technology. 201, 2072-2079. DOI: 10.1016/j.surfcoat.2006.04045.
[5] Senderowski C., Bojar Z. & Przetakiewicz W. (2007). Influence of gas detonation spraying conditions on the quality of Fe-Al inter-metallic protective coatings. Archives of Foundry Engineering. 7(1), 147.
[6] Wołczyński W., Okane T., Senderowski C., Kania B.,
Zasada D.& Janczak-Rusch J. (2011). Meta-stable conditions of diffusion brazing, Archives of Metallurgy and Materials. 56, 311-323. DOI: 10.2478/v10172-011-0035-7.
[7] Kubaschewski O. (1982). IRON-Binary Phase Diagrams.
Berlin-Heidelberg-New York: Springer-Verlag.
[8] Umeda T., Okane T. & Kurz W. (1996). Phase selection during solidification of peritectic alloys, Acta Materiallia. 44, 4209-4216. DOI: 10.1016/S1359-6454(96)00038-9.
[9] Wołczyński W., Guzik E., Kopyciński D., Himemiya T.,
Janczak-Rusch J. (2006). Mass transport during diffusion soldering or brazing at the constant temperature. In 13th International Heat Transfer Conference, 13-18 August 2006 (MST-11, 12 pages). Sydney, Australia. Begell House, Inc. Publishers, eds. G.deVahl Davis & E.Leonardi.
[10]Aziz M.J. (1982). Model for solute redistribution during rapid solidification. Journal of Applied Physics. 53(2), 1158-1168. DOI: 10.1063/1.329867.
[11]Wołczyński W. (2003). Theory of solute segregation –
![Fig. 8. Superposition of the phase diagrams for meta-stable equilibrium and for stable equilibrium, (dotted lines, [7]) The difference between E – point and O – point is about 17 K](https://thumb-eu.123doks.com/thumbv2/123dok_br/18203189.333739/4.871.112.370.123.356/superposition-diagrams-stable-equilibrium-stable-equilibrium-dotted-difference.webp)
