* Corresponding author. Tel: +91–9002326123 E-mail: [email protected] (B. Dey) © 2012 Growing Science Ltd. All rights reserved. doi: 10.5267/j.ijiec.2012.03.001
International Journal of Industrial Engineering Computations 3 (2012) 649–662
Contents lists available at GrowingScience
International Journal of Industrial Engineering Computations
homepage: www.GrowingScience.com/ijiec
A MOORA based fuzzy multi-criteria decision making approach for supply chain strategy selection
Balaram Deya*, Bipradas Bairagia, Bijan Sarkarband Subir Sanyalb
a
Department of Production Engineering, Haldia Institute of Technology, Haldia, W. B., India bDepartment of Production Engineering, Jadavpur University, Kolkata, India
A R T I C L E I N F O A B S T R A C T
Article history: Received 25 October 2011 Received in revised form November, 2, 2011 Accepted February, 3 2012 Available online 16 February 2012
To acquire the competitive advantages in order to survive in the global business scenario, modern companies are now facing the problems of selecting key supply chain strategies. Strategy selection becomes difficult as the number of alternatives and conflicting criteria increases. Multi criteria decision making (MCDM) methodologies help the supply chain managers to take a lead in a complex industrial set-up. The present investigation applies fuzzy MCDM technique entailing multi-objective optimization on the basis of ratio analysis (MOORA) in selection of alternatives in a supply chain. The MOORA method is utilized to three suitable numerical examples for the selection of supply chain strategies (warehouse location selection and vendor/supplier selection). The results obtained by using current approach almost match with those of previous research works published in various open journals. The empirical study has demonstrated the simplicity and applicability of this method as a strategic decision making tool in a supply chain.
© 2012 Growing Science Ltd. All rights reserved
Keywords:
Supply chain
Warehouse location selection Vendor selection
Fuzzy multi-criteria decision making
MOORA
1. Introduction
Companies today are often presented with a number of supply chain strategies. Better decision making for aligning the right strategies with its needs results in improving efficiency; reduce costs within a supply chain. Supply chain is a network of organizations involved through upstream (supplier), mid-stream (manufacturer) and downmid-stream (distributor, retailer) linkages in different processes and activities
(Lee & Billington, 1992) which produce value in the form of products and services to satisfy
In a supply chain design, the location of facilities is one of the most critical decisions. To optimize supply chain network, facilities such as factories, warehouses, distribution centers (DCs) and retail outlets must be strategically located (Coyle et al., 2003; Simchi-Levi et al., 2003). Owing to the strategic nature of the warehouse location selection, the decisions are made by a committee comprising of high level managers of the organization along with external consultants. The committee chooses various attributes in order to select possible warehouse locations. Some authors considered availability of labor, closeness to markets and customers, availability of suppliers, and even social issues as the potential attributes for the warehouse location selection (Heizer & Render, 2004; Stevenson, 2005). The selection attributes can be broadly classified into three categories (Liang & Wang, 1991) such as critical, objective and subjective attributes. The subjective attributes are assessed by human experience and perception, which is naturally associated with imprecision, vagueness, ambiguity and deserves the application of fuzzy multiple criteria decision-making (FMCDM).
Vendor/Supplier selection has a strategic dimension on any company’s competitive priorities, such as price, quality, delivery, services, technical capability and improvement. The decision-making process is highly complex and involves imprecise information. A vendor selection problem usually involves more than one criterion and they are generally conflicting to each other. That is why fuzzy multi criteria decision making (FMCDM) has a role to play in order to select the alternative vendors. Supplier selection process is one of the most important components of production and logistics management for many companies. Selection of a wrong supplier could be enough to upset the company’s financial and operational position. Selecting the right suppliers significantly reduces purchasing costs, improves competitiveness in the market and enhances end user satisfaction.
Multiple criteria decision making (MCDM) is the approach of ranking and selection of alternatives from a set of feasible alternatives. MCDM approach is divided into two categories (Wang & Lee, 2007) viz.
classical MCDM(Feng & Wang, 2000), and Fuzzy Multiple Criteria Decision Making (FMCDM) (Wang
et al., 2003). In classical MCDM decisions are made under certainty on the basis of objective criteria (quantitative) (Zeleny, 1982).The MCDM problems are solved using various techniques or tools include the total sum (TS), the simple additive weighting (SAW) method, the AHP, the data development analysis (DEA), the outranking approaches ELECTRE and PROMETHEE and the TOPSIS(techniques
for order preference similarity to ideal solution) method (Hwang & Yoon, 1981). Under many
circumstances where performance ratings and weights cannot be given precisely, the fuzzy set theory is introduced to model the uncertainty of human judgments, perception etc. and such problem is known as fuzzy multiple criteria decision making (FMCDM).
The objective of the present paper is to enhance evaluation and selection methodology and to recommend an alternative approach by applying multi-objective optimization on the basis of ratio analysis (MOORA) method. This paper attempts to explore the applicability of MOORA, an MCDM approach to solve different selection problems in supply chain environment. Three illustrative examples consisting of warehouse location selection and vendor/supplier selection are considered in this paper. The outcome of this algorithm has also been compared with those of some works performed by various earlier researchers on the same problems.
2. Literature review
651
multiple attribute decision-making method to identify the optimal alternative based on ideal and anti-ideal point concepts. Kahraman et al. (2003) tried to solve facility location problems using four different fuzzy multi-attribute group decision-making (FMAGDM) approaches considering both quantitative as well as qualitative criteria. They compared the approaches in terms of computational complexity and found fuzzy AHP as the most complex among all. Chen (2001) developed a new FMADM approach for distribution centre (DC) location selection problem based on a stepwise ranking procedure. Chu (2002) presented a fuzzy technique for order preference by similarity to ideal solution (TOPSIS) model to solve
the facility location selection problem under group decision-making. Guneri et al. (2009) developed a
fuzzy analytical network process (ANP) to shipyard location selection. Li and Kuo (2008) developed an enhanced fuzzy neural network (EFNN) based on decision support system for managing automobile spares inventory in a central warehouse.
Chun and Kun (2009) utilized the dynamic product–process change matrix as a lens/map for helping managers to link the selection criteria with the requirements of operations strategies for facility location selection. Peter and Marco (2009) explored the current literature on the overall methodology of warehouse design together with the literature on tools and techniques used for specific areas of analysis. Bhattacharya et al. (2004) proposed a method for selecting plant location under MCDM environment with certainty. Emanuel et al. (2009) proposed a physical programming (PP) methodology to enable a decision maker to consider multiple criteria (i.e., cost, customer service and intangible benefits). An extensive review was carried out by (Jinxiang et al., 2007) on warehouse operation planning problems which were classified according to the basic warehouse functions, i.e., receiving, storage, order picking, and shipping.
De Boer et al. (2001) provided a comprehensive review of the literature concerning supplier selection. Jian et al. (2008) proposed integrated fuzzy multiple criteria decision making (FMCDM) method addressing the interrelationship among the sub criteria for the vendor selection problem. Kumar et al. (2004) presented a fuzzy goal programming approach to solve the vendor selection problem with three objectives. Shyur and Shih (2006) developed a hybrid MCDM method for strategic vendor selection by
using both the ANP and TOPSIS methods. Chen et al. (2006) developed a hierarchy multiple criteria
decision-making model based on fuzzy set theory to deal with the supplier selection problems. Mikhailov (2002) proposed the fuzzy AHP method to determine the weight of each criterion and to score each alternative for each criterion.
The remainder of this paper is organized as follows. Section 3 presents the fuzzy set theory in brief. This is followed by MOORA algorithm in section 4. In the section 5, suitable examples are- furnished and solved. Section 6 presents some significant concluding remarks on the applied methodology.
3. Fuzzy set theory
Zadeh (1965)pioneered the use of fuzzy set theory to address the problems of tackling the vagueness in information and the fuzziness in human perception. In a universe of discourse X, a fuzzy subset A~ of X is defined with a membership function μA~
( )
x that maps each element x in X to a real number in theinterval [0, 1]. The function value ofμA~
( )
x signifies the grade of membership of x inA~. A triangularfuzzy number (TFN) A~ can be defined as a triplet (a, b, c) and the membership function is defined
(Dubois and Prade 1978, Keufmann and Gupta 1991) as shown by Eq.1.
( )
( )
( )
( )
( )
, ,
,
0 , otherwise
A
x a
a x b
b a
c x
x b x c
c b
μ
⎧ −
≤ ≤ ⎪
− ⎪ ⎪ − ⎪
=⎨ − ≤ ≤
⎪ ⎪ ⎪ ⎪⎩
The concept of combining the fuzzy set theory and MCDM is referred to as fuzzy MCDM. In fuzzy MCDM, performance rating of alternatives and weights of criteria are expressed in linguistic terms (Linguistic variables). Linguistic variables are then transformed into either triangular, trapezoidal fuzzy numbers or range of fuzzy numbers.
4. The MOORA method
Multi-objective optimization on the basis of ratio analysis (MOORA), also known as multi-criteria or multi attribute optimization is the process of simultaneously optimizing two or more conflicting attributes (objectives) subject to certain constraints. This method has wide range of applications to make decisions in conflicting and complex area of supply chain environment. Warehouse location selection, supplier selection, product and process design selection etc. wherever optimal decisions need to be taken, MOORA can be applied. Decision making is the process of defining the decision goals, gathering relevant information and selecting the optimal alternative (Hees & Sicihano, 1996). While decision making in a supply chain environment the attributes (objectives) must be quantified and the fuzziness of linguistic variables of the attributes has to be defuzzified into a crisp value. The outcomes can be measured for every decision alternatives. Objective outcomes provide the basis of comparison of choices and ultimately lead to the selection of best one. Hence, MOORA method can be effectively applied as an appropriate tool for the ranking and selection of the alternatives among various set of available options.
Brauers (2004) first introduced the MOORA method in order to solve various complex and conflicting decision making problems. The MOORA method starts with a decision matrix as shown by Eq. (2). The decision matrix represents the performance measures of alternatives with respect to various criteria (objective). Performance ratings under objective criteria are expressed by crisp (specific) values but performance ratings under subjective criteria are expressed by linguistic variables due to vagueness, imprecision, indistinctness and ambiguity. The words or phrases like ‘good’, ‘very good’, ‘medium’, ‘poor’, ‘very poor’ etc. are called linguistic variables which are measured by human perception, feelings, experience etc. A decision matrix with m number of alternatives(A1, … ,Ai, … ,Am), n number of
criteria (C1, … ,Cj, … ,Cn) and m×n number of performance ratings (x11k, … ,xijk, … ,xmnk) is formed as
follows.
C1 … Cj … Cn
(2)
[ ]
⎥ ⎥ ⎥ ⎥ ⎥ ⎥ ⎦ ⎤ ⎢ ⎢ ⎢ ⎢ ⎢ ⎢ ⎣ ⎡ = × mnk mjk k m ink ijk k i nk jk k n m x x x x x x x x x DM … … … … … … 1 1 1 1 11 m i 1 A A Awherexijk is the performance rating of ithalternative for th
j criterion given by kthdecision maker and
expressed as xijk =⎜⎝⎛aijk,bijk⎟⎠⎞orxijk =⎜⎝⎛aijk,bijk,cijk⎞⎠⎟. These fuzzy numbers are defuzzified using relation
2 / ⎟ ⎠ ⎞ ⎜ ⎝ ⎛ = ′
∑
ijkijk a
x and xijk′ =⎝⎛⎜
∑
aijk⎞⎠⎟/3 in case of range of fuzzy values and triangular fuzzy numbers,respectively. Average rating of alternatives is computed by the formula ⎟⎟
⎠ ⎞ ⎜ ⎜ ⎝ ⎛ =
∑
= K k ijk ij x K x 1 1where1≤k≤K,
and K is the number of decision makers.
Brauers and Zavadskas (2006) described MOORA as a ratio system in which each response of an
653
alternative per objective is chosen (Van Delft & Nijkamp, 1977). Brauers et al. (2008)considered various ratio systems such as Stopp ratio, Weitendorf ratio, total ratio, Korth ratio, Scharlig ratio, Juttler ratio etc. and concluded that for this denominator, the best choice is the square root of the sum of squares of each alternative per criterion. This ratio system is expressed by Eq. (3).
Normalization of average rating of each alternative with respect to each subjective as well as objective criterion is determined using following Eq. (3)
2 / 1 1
2 /
⎥ ⎥ ⎦ ⎤ ⎢ ⎢ ⎣ ⎡
=
∑
=
m
i ij ij N
ij x x
x , j = 1, 2…n (3)
where N
ij
x is a dimensionless number which belongs to interval [0, 1] representing the normalized
performance of th
i alternative on the jthcriteria. In MOORA, the normalized performance measures are
added in case of maximization (for beneficial criteria) and subtracted in case of minimization(for non-beneficial criteria).Then the optimization problem(composite score)becomes
1 1
,
b n
N N
i ij ij
j j b
z x x
= = + =
∑
−∑
(4) where b is the number of criteria to be maximized, (n–b) is the number of criteria to be minimized, and
i
z is the normalized composite score of ith alternative with respect to all the criteria.
It has been noticed that some attributes are more important than the others (Brauers et al, 2009) .When the weights of the attributes are different, the optimization problem (composite score) becomes
∑
∑
+ = =
⊗ −
⊗
= n
b j
N ij j b
j
N ij j
i w x w x
z
1 1
j = 1, 2,…n
(5)
where wjis the weight of th
j criterion. The zi(composite score) may be positive or negative depending
upon the totals of its maxima (beneficial criteria) and minima (non-beneficial criteria) in the decision matrix. The ranking of the alternatives is determined on the basis of the descending order of the
composite score. The best alternative has the highest zi(composite score) value and the worst
alternative has lowest zi(composite score) value.
5. Illustrative example
Three examples on supply chain strategies are extracted from various open journals in order to demonstrate the applicability of MOORA method in FMCDM environment.
5.1 Warehouse location selection (Example 1)
Table 2. In order to find the normalized performance rating, the best ratio system is chosen. For this best ratio system, the denominator is the square root of the sum of squares of each alternative warehouse per criterion as shown in Table 2. The normalized values of performance rating of each alternative with respect to all subjective as well as objective criteria are calculated by using Eq.(3) and shown in Table 3. Chen (2001) considered the importance of weight of each criterion in terms of linguistic variables as
triangular fuzzy numbers. Defuzzified and normalized weightof each criterion is shown in Table no.4.
Composite Score of alternatives are then calculated by using Eq. (5) as shown in Table 5. Fig. 1 depicts composite score of alternative warehouse locations. All the values of the composite score are positive in nature as the total number of beneficial criteria is larger than the non-beneficial criteria. The final ranking of the alternatives is determined on the basis of the descending order values of composite score.
The ranking of warehouses according to proposed method isA2 A3 A1 as shown in Table 5. The best
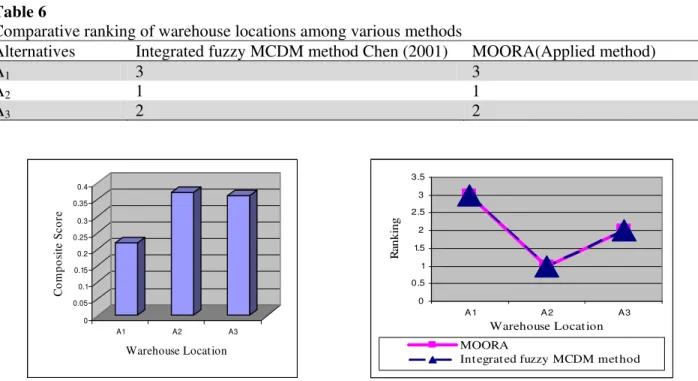
warehouse location is A2. Table 6.shows the comparative ranking of warehouse locations obtained by
applying proposed method with those of various other papers available in the open journals. Fig. 2 depicts a comparison of ranking of alternatives between MOORA (applied method) and the integrated fuzzy MCDM method applied in previous research work (Chen, 2001).
Table 1
Decision matrix (Average performance score)
Alternatives (Ai)
C1 (Investment cost) (Min) (–)
C2 ( Expansion possibility) (Max)
(+)
C3 (Availability of material) (Max)
(+)
C4 (Human resource) (Max) (+)
C5 (Closeness to demand market)(Max)
(+) A1 7 million (6.3, 8, 9) (5.7, 7.7, 9) (7.7, 9.3, 10) (3, 5, 7) A2
4 (9, million (7, 10, 10) (7, 9, 10) 9, 10) (5.7, 7.7, 9) A3 5 million (7, 9, 10) (7, 9, 10) (8.3, 9.7, 10) (7, 9, 10)
Source: Chen (2001)
Table 2
Defuzzified performance score of alternatives with their sums of square and square root values
Alternatives C1 (–) C2 (+) C3 (+) C4 (+) C5 (+)
A1 7 7.77 7.46 9.00 5.00
A2 4 9.67 8.67 8.67 7.46
A3 5 8.67 8.67 9.33 8.67
Sum of Squares 90.0601 228.9169 205.9225 243.36 155.7504
Square Roots 9.49 15.13 14.35 15.60 12.48
Table 3
Normalized and defuzzified rating of alternatives
Alternatives C1 (–) C2 (+) C3 (+) C4 (+) C5 (+)
A1 0.7376 0.5135 0.5198 0.5764 0.4006
A2 0.4215 0.6391 0.6042 0.5557 0.5977
A3 0.5269 0.5730 0.6042 0.5980 0.6947
Table 4
Weights of criteria
Weight C1(–) C2 (+) C3 (+) C4 (+) C5 (+)
Fuzzy weight (.83, .97, 1.0) (.7, .9, 1.0) (.57, .77, .93) (.5,.7, .9) (.7, .9, 1.0)
Defuzzified and Normalized weight
0.2263 0.2101 0.1835 0.1698 0.2101
655
Table 6
Comparative ranking of warehouse locations among various methods
Alternatives Integrated fuzzy MCDM method Chen (2001) MOORA(Applied method)
A1 3 3
A2 1 1
A3 2 2
Fig. 1 Composite score of warehouselocation for example 1
Fig. 2 Comparative ranking of warehouse location obtained by various methods for example 1
5.2. Vendor selection (Example 2)
The selection of right vendor is one of the most important functions of any company’s purchasing department and having strategic impact on the overall profitability of that organization. The vendor selection problem is an unstructured, complicated and multi criteria decision making problem. The
method MOORA is applied to solve a vendor selection problem cited from Yang et al. (2008). Five
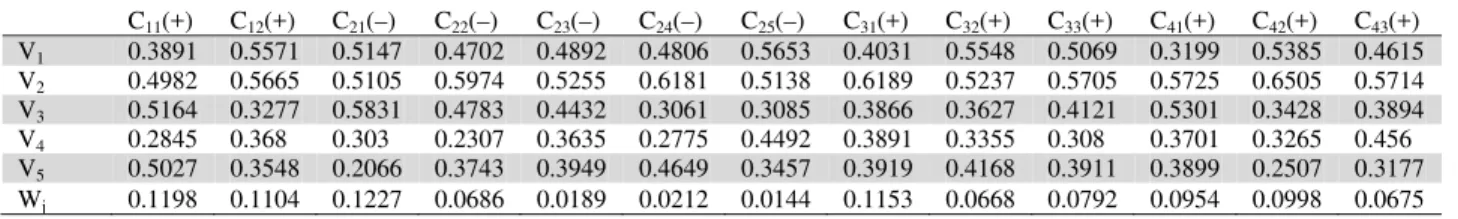
vendors (V1, V2, V3, V4 and V5) are screened out for evaluation purpose. Many studies have pointed out that the key is to set effective selection criteria for the vendor selection problem. The list of criteria and sub-criteria involved in this vendor selection problem are listed in Table 7.Out of all these criteria, quality (C1), supply chain support (C3), technology (C4) and the sub-criteria under them are the beneficial factors and hence are to be maximized. Price and terms (C2) and its various sub-criteria are the non-beneficial factors which are to be minimized. Table 7 also represents the normalized weights of all sub-criteria. Table 8 gives the fuzzy performance score of all vendors with respect to all sub-criteria. The performance score of all the alternative vendors are defuzzified as shown in Table 9. In order to find the normalized performance rating, the best ratio system is chosen. For this best ratio system, the denominator is the square root of the sum of squares of each alternative vendor per criterion as shown in Table 9. The normalized values of performance rating of each alternative vendor with respect to all sub-criteria are calculated by using Eq. (3) and shown in Table 10.
Composite score of alternative vendors are then calculated by using Eq. (5) as shown in Table 10. Fig. 3 depictscomposite score of alternative vendors. All the values of the composite score are positive in nature as the total number of beneficial criteria is larger than the non-beneficial criteria. The final
0 0.05 0.1 0.15 0.2 0.25 0.3 0.35 0.4
C
o
mpos
it
e
S
c
or
e
A1 A2 A3
Warehouse Location
0 0.5 1 1.5 2 2.5 3 3.5
A 1 A 2 A 3
Warehouse Locat ion
Ra
n
k
in
g
MOORA
Int egrat ed fuzzy MCDM met hod
Table 5
Composite Score of alternatives and their ranking
Alternatives Benefit value Non-Benefit value Composite Score Ranking
A1 0.3853 0.1669 0.2184 3
A2 0.4650 0.0953 0.3697 1
ranking of the alternatives is determined on the basis of the descending order values of composite
score. The ranking of alternative vendors according to the MOORA method is V2 V1 V5 V4 V3 as
shown in Table 11. The best vendor is V2. Yang et al. (2008) solved the same vendor selection problem by integrated fuzzy MCDM technique and observed the ranking of alternative vendors as
4 5 1 3
2 V V V V
V . While solving the same problem using traditional AHP method, the ranking of the
alternative vendors obtained asV2 V1 V3 V5 V4. Fig. 4 shows a comparative ranking of alternative vendors among MOORA and the methods applied in previous research works. The ranking of the vendors from these three methods reveal that the best vendor (V2) remains same whereas the ranking of
the intermediate vendors were different. Different methods resulted in different ranking of the intermediate vendors. A comparative ranking analysis among these methods is made and shown in Table 12.
Table 7
Criteria and sub-criteria for the vendor selection and normalized sub- criteria weights
Criteria and sub-criteria Normalized sub- criteria weights
Quality (C1) (Max) (+)
- Quality performance (C11) (+) 0.1198
- Quality containment& VDCS feed back (C12)(+) 0.1104
Price and terms (C2) (Min) (–)
- Price (C21) (–) 0.1227
- Terms (C22) (–) 0.0686
- Responsiveness (C23) (–) 0.0189
- Lead time (C24) (–) 0.0212
- VMI/VOI hub set up cost (C25) (–) 0.0144
Supply chain support (C3) (Max) (+)
- purchase order reactiveness (C31)(+) 0.1153
- Capacity support &flexibility (C32)(+) 0.0668
- Delivery/VMI operation (C33)(+) 0.0792
Technology (C4) (Max) (+)
- Technical support (C41)(+) 0.0954
- Design involvement (C42)(+) 0.0998
- ECN/PCN process (C43)(+) 0.0675
Source:.Yang et al. (2008)
Table 8
Fuzzy performance score of vendors for all sub-criteria
Vendors Sub -criteria
C11 (+) C12 (+) C21 (–) C22 (–) C23 (–)
V1 (2.94,4.12,5.81) (4.37,6.11,7.71) (4.25,5.81,7.24,) (3.87,5.25,6.98) (3.66,5.35,6.66) V2 (3.88,5.51,7.08) (4.82,6.02,7.66) (4.11,5.77,7.29,) (5.25,6.91,8.30) (3.97,5.69,7.17) V3 (4.02,5.84,7.22) (2.22,3.42,5.06) (5.07,6.72,7.82) (3.99,5.54,6.84) (3.21,4.81,6.17) V4 (1.90,2.93,4.58) (2.39,3.94,5.69) (1.86,3.33,5.00) (1.30,2.46,4.14) (2.45,3.66,5.53) V5 (3.86,5.68,7.09) (2.29,3.81,5.49) (1.34,2.04,3.56) (2.90,4.28,5.63) (2.88,4.19,5.58)
C24 (–) C25 (–) C31 (+) C32 (+) C33 (+)
V1 (4.47,6.14,7.53) (5.14,6.83,8.33) (2.67,4.44,6.02) (5.75,6.96,8.55) (3.74,5.40,6.92) V2 (6.57,7.91,8.86) (4.56,6.18,7.71) (5.23,6.78,8.14) (5.18,6.72,8.18) (4.33,6.09,7.66) V3 (2.46,3.76,5.34) (2.16,3.70,5.23) (2.52,4.12,5.94) (3.14,4.52,6.25) (2.76,4.42,5.88) V4 (2.04,3.43,5.02) (3.89,5.19,7.05) (2.77,4.09,5.81) (2.71,4.24,5.91) (1.95,3.31,4.50) V5 (4.43,5.64,7.49) (2.75,4.20,5.47) (2.69,4.29,5.78) (3.62,5.38,6.98) (2.61,4.08,5.71)
C41 (+) C42 (+) C43 (+)
V1 (1.86,3.18,4.85) (4.88,6.42,7.83) (3.22,5.18,6.85)
V2 (4.33,5.93,7.44) (6.36,7.85,8.91) (4.73,6.36,7.79,) V3 (4.02,5.53,6.83) (2.52,3.98,5.68) (2.84,4.14,5.88)
V4 (2.39,3.59,5.46) (2.24,3.93,5.43) (3.49,5.07,6.50) V5 (2.43,4.07,5.55) (1.84,2.71,4.36) (2.24,3.37,4.88)
657
Table 10
Normalized defuzzified performance score of alternatives and normalized weights of sub criteria C11(+) C12(+) C21(–) C22(–) C23(–) C24(–) C25(–) C31(+) C32(+) C33(+) C41(+) C42(+) C43(+)
V1 0.3891 0.5571 0.5147 0.4702 0.4892 0.4806 0.5653 0.4031 0.5548 0.5069 0.3199 0.5385 0.4615
V2 0.4982 0.5665 0.5105 0.5974 0.5255 0.6181 0.5138 0.6189 0.5237 0.5705 0.5725 0.6505 0.5714
V3 0.5164 0.3277 0.5831 0.4783 0.4432 0.3061 0.3085 0.3866 0.3627 0.4121 0.5301 0.3428 0.3894
V4 0.2845 0.368 0.303 0.2307 0.3635 0.2775 0.4492 0.3891 0.3355 0.308 0.3701 0.3265 0.456
V5 0.5027 0.3548 0.2066 0.3743 0.3949 0.4649 0.3457 0.3919 0.4168 0.3911 0.3899 0.2507 0.3177
Wj 0.1198 0.1104 0.1227 0.0686 0.0189 0.0212 0.0144 0.1153 0.0668 0.0792 0.0954 0.0998 0.0675
Table11
Composite Scores of alternatives and their ranking
Alternative Vendors Benefit criteria Non-benefit criteria Composite Score Ranking
V1 0.3007 0.123 0.1778 2
V2 0.3605 0.1341 0.2264 1
V3 0.266 0.1237 0.1423 5
V4 0.2202 0.0722 0.148 4
V5 0.2419 0.0733 0.1686 3
Table 12
Comparative ranking of vendors among various methods
Alternative Vendors *Traditional AHP method *Integrated fuzzy MCDM technique
MOORA (Applied method)
V1 2 3 2
V2 1 1 1
V3 3 2 5
V4 5 5 4
V5 4 4 3
*(Source: Yang et al. (2008)
Fig. 3. Composite score of vendors for example 2 Fig. 4. Comparative ranking of vendors obtained by various methods for example 2
Table 9
Defuzzified performance score of alternatives with their sums of square and square root values
C11 (+) C12(+) C21 (–) C22 (–) C23 (–) C24 (–) C25 (–) C31(+) C32(+) C33(+) C41(+) C42(+) C43(+)
V1 4.289 6.065 5.768 5.367 5.221 6.051 6.767 4.376 7.089 5.355 3.295 6.378 5.083
V2 5.491 6.167 5.721 6.819 5.609 7.782 6.15 6.718 6.692 6.026 5.897 7.705 6.293
V3 5.692 3.568 6.534 5.459 4.73 3.854 3.693 4.196 4.635 4.353 5.46 4.06 4.288
V4 3.136 4.006 3.395 2.633 3.88 3.494 5.377 4.224 4.287 3.253 3.812 3.868 5.022
V5 5.541 3.863 2.315 4.272 4.215 5.853 4.138 4.254 5.326 4.131 4.016 2.969 3.499
SoS 121.48 118.53 125.57 130.28 113.91 158.48 143.28 118.48 163.28 111.58 106.11 140.30 121.29
SR 11.02 10.89 11.21 11.41 10.67 12.59 11.97 10.86 12.778 10.56 10.301 11.845 11.013
SoS=Sum of squares, SR= Square root
0 0.05 0.1 0.15 0.2 0.25
C
o
m
p
os
it
e
s
c
or
e
V1 V2 V3 V4 V5
Vendors
0 1 2 3 4 5 6
V1 V2 V3 V4 V5
Vendors
Ra
n
k
in
g
AHP
5.3 Supplier selection (Example 3)
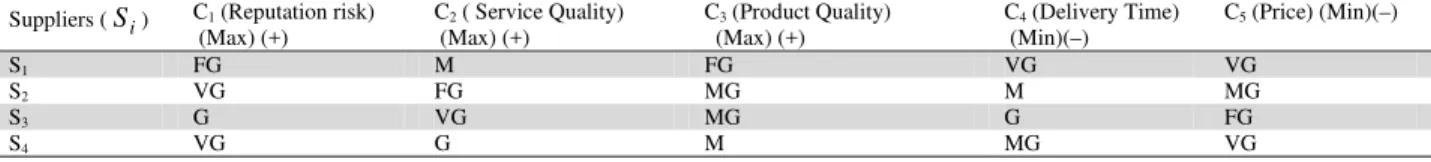
A supplier selection inherently is a multi-criteria decision making problem and having a strategic dimension to any supply chain system. The selection decisions become difficult as the information in a vague environment are often imprecise and complex in nature. Expert’s opinions play a major role in assessing these information in terms of linguistic variables and impart a fuzzy number on the basis of their human judgments (Table 13 &14). The selection attributes of alternative suppliers often varies depending upon the type and nature of products of that particular chain. Here a numerical problem is extracted from Li et al. (2007) in order to demonstrate the applicability of MOORA in supplier selection. In the problem there are four alternative suppliers Si(i= 1, 2, 3, 4 ) primarily selected as
alternatives and five attributes or criteria Cj (j= 1, 2 , ….,5 ) are chosen for the decision making. The
five attributes are reputation risk (C1), service quality (C2), product quality (C3), delivery time (C4), and price (C5) as shown in Table 14. Among these attributes C1,C2, C3 are to be maximized being the beneficial criteria where as C4,C5 are to be minimized being the non-beneficial criteria.
The fuzzy decision matrix comprising of performance measures of the alternatives with respect to all criteria as shown in Table 15. The performance rating of all the alternative vendors are defuzzified and shown in Table 16. In order to find the normalized performance rating, the best ratio system is chosen. For this best ratio system, the denominator is the square root of the sum of squares of each alternative supplier per criterion as shown in Table 16. The normalized values of performance rating of each alternative supplier with respect to all criteria are calculated by using Eq. (3) and shown in Table 17. The weights of all criteria are also shown in Table 17.
Composite Score of alternative suppliers are then calculated by using Eq. (5) as shown in Table 18. Fig. 5 depictscomposite score of alternative suppliers. All the values of the composite score are positive in nature as the total number of beneficial criteria is larger than the non-beneficial criteria. The final ranking of the alternatives is determined on the basis of the descending order values of composite
score. The ranking of suppliers according to the MOORA method is S2 S3 S4 S1 as shown in
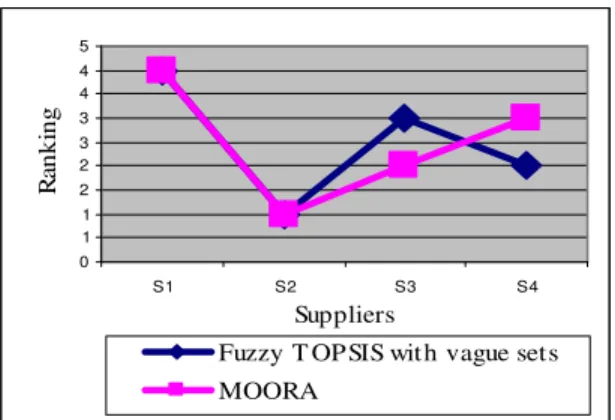
Table 18. The best supplier isS2. Wu (2011) solved the same supplier selection problem of Li et al. (2007) by fuzzy TOPSIS with vague sets method and observed the ranking of suppliers as
1 3 4
2 S S S
S . Fig. 6 shows a comparative ranking of alternative suppliers between MOORA and the
method applied in Wu(2011).The ranking of the suppliers from these two methods reveal that the best supplier (S2) and the worst supplier (S1) remain same. But the ranking of the intermediate suppliers were different. Different methods resulted in different ranking of the intermediate suppliers. A comparative ranking analysis between these two methods is made and shown in Table 19.
Table 13
Linguistic variables and fuzzy numbers for the ratings of alternative suppliers
Linguistic variables Fuzzy numbers
Absolute Good (AG) (1,1)
Very Good (VG) (0.9,0.95)
Good (G) (0.8,0.9)
Fairly Good (FG) (0.7,0.85)
Medium Good (MG) (0.6,0.8)
Medium (M) (0.5,0.5)
Fairly Poor (FP) (0.3,0.45)
Poor (P) (0.2,0.3)
Very Poor (VP) (0.1,0.15)
Absolutely Poor (AP) (0,0)
659
Table14
Decision makers opinion regarding attributes of supplier selection Suppliers (Si) C1 (Reputation risk)
(Max) (+)
C2 ( Service Quality) (Max) (+)
C3 (Product Quality) (Max) (+)
C4 (Delivery Time) (Min)(–)
C5 (Price) (Min)(–)
S1 FG M FG VG VG
S2 VG FG MG M MG
S3 G VG MG G FG
S4 VG G M MG VG
Source: Li et al.(2007)
Table15
Fuzzy decision matrix of the alternative suppliers
Suppliers C1 (+) C2 (+) C3 (+) C4 (–) C5)(–)
S1 (0.7,0.85) (0.5,0.5) (0.7,0.85) (0.9,0.95) (0.9,0.95)
S2 (0.9,0.95) (0.7,0.85) (0.6,0.8) (0.5,0.5) (0.6,0.8)
S3 (0.8,0.9) (0.9,0.95) (0.6,0.8) (0.8,0.9) (0.7,0.85)
S4 (0.9,0.95) (0.8,0.9) (0.5,0.5) (0.6,0.8) (0.9,0.95)
Table 16
Defuzzified performance score of alternatives with their sums of squares and square root values
Suppliers C1 (+) C2 (+) C3 (+) C4 (–) C5 (–)
S1 0.775 0.5 0.775 0.925 0.925
S2 0.925 0.775 0.7 0.5 0.7
S3 0.85 0.925 0.7 0.85 0.775
S4 0.925 0.85 0.5 0.7 0.925
Sum of Squares 3.0344 2.4288 1.8306 2.3181 2.8019
Square Roots 1.7419 1.5584 1.353 1.5225 1.6739
Table 17
Normalized and defuzzified rating of suppliers along with the weights of criteria
Suppliers C1 (+) C2 (+) C3 (+) C4 (–) C5 (–)
S1 0.4449 0.3208 0.5728 0.6075 0.5526
S2 0.531 0.4973 0.5174 0.3284 0.4182
S3 0.488 0.5935 0.5174 0.5583 0.463
S4 0.531 0.5454 0.3695 0.4598 0.5526
Weights of criteria,wj 0.196 0.272 0.184 0.217 0.131
Source: Weights of criteria are extracted from Li et al.(2007)
Table 19 Table 18
Composite score of alternatives and their ranking
Suppliers Benefit value Non-Benefit value Composite Score Ranking
S1 0.2799 0.2042 0.0756 4
S2 0.3345 0.126 0.2085 1
S3 0.3523 0.1818 0.1705 2
S4 0.3204 0.1722 0.1483 3
Comparative ranking of suppliers among various methods
Suppliers Fuzzy TOPSIS with vague sets MOORA (Applied method)
S1 4 4
S2 1 1
S3 3 2
Fig. 5 Composite score of suppliers forexample 3 Fig. 6 Comparative ranking of suppliersobtained by various methods for example 3
6. Conclusions
Decision making for supply chain strategies under FMCDM environment involves complex evaluation process due to imprecise information. The complexity further increases as the number of alternatives and selection attributes increases. In this regard the application of the MOORA method is recommended for making decisions in a supply chain for the selection of best alternative from a number of alternatives. Three illustrative examples are considered to adjudge its enviable significance from the point of viability and feasibility. In example 1, it is observed that the ranking of all the alternatives obtained by applied method exactly match with those derived by the earlier researchers. In example 2, the ranking of the top two vendors exactly match with the result obtained from traditional AHP and MOORA method whereas the best vendor remains same among all the three methods. In example 3, the ranking of the suppliers obtained by MOORA and fuzzy TOPSIS with vague sets methods reveal that the best supplier and the worst supplier remain same. But the ranking of the intermediate vendors/suppliers were found different in example 2 & 3. The disparities among the intermediate rankings of the alternatives may be due to the diverse opinion given by the decision makers. The MOORA method can be applied in fuzzy environment considering both the qualitative as well as the quantitative criteria. Computationally the MOORA method is very simple and easily comprehensible which can handle large number of selection criteria. Application of this method in a wider range of selection problem in a supply chain is a direction of future research work.
References
Bhttacharya, A., Sarkar, B., & Mukherjee, S.K. (2004). A new method for plant location selection: a
holistic approach, International Journal of Industrial Engineering: Theory, application and
practice, 11 (4), 330 – 338.
Brauers, W.K.M. (2004). Optimization methods for a stakeholder society, A revolution in economic
thinking by multiobjective optimization, Boston: Kluer Academic Publishers.
Brauers, W.K.M., & Zavadskas, E. K. (2006). The MOORA method and its application to privatization in a transition economy, Control and Cybernetics, 35, 445 – 469.
Brauers, W.K.M., Zavadskas, E. K., Peldschus, F., & Turskis, Z. (2008). Multi-objective decision-making for road design, Transport, 23, 183 – 193.
Brauers, W.K.M., & Zavadskas, E. K. (2009). Robustness of the multi-objective MOORA method with
a test for the facilities sector, Technological and Economic Development of Economy: Baltic
Journal on sustainability, 15, 352 – 375.
Chen, C.T. (2001). A fuzzy approach to select the location of the distribution center, Fuzzy Sets and
Systems, 118, 65–73.
0 0.05 0.1 0.15 0.2 0.25
C
o
m
pos
it
e s
c
or
e
S1 S2 S3 S4
Suppliers
0 1 1 2 2 3 3 4 4 5
S1 S2 S3 S4
Suppliers
R
anki
ng
Fuzzy T OPSIS wit h vague set s
661
Chen, C. T., Lin, C. T., & Huang, S. F. (2006). A fuzzy approach for supplier evaluation and selection in supply chain management, International Journal of Production Economics, 102, 289–301.
Chen, C.L., Yuan, T.W., & Lee, W.C. (2007). Multi-criteria fuzzy optimization for locating warehouses and distribution centers in a supply chain network, Journal of the Chinese Institute of
Chemical Engineers, 38, 393 – 407.
Chun,Y. S.,& Kun, T. Y. (2009). A generalized fuzzy approach for strategic problems: The empirical study on facility location selection of authors’ management consultation client as an example,
Expert Systems with Applications, 36, 4709 – 4716.
Chu, T. C. (2002). Facility location selection using fuzzy TOPSIS under group decisions, International
Journal of Uncertainty, Fuzziness and Knowledge-Based Systems, 10(6), 687–701.
Coyle, J. J., Bardi, E. J., & Langley, C. J. (2003). The management of business logistics: A supply chain
perspective, (seventh ed.), Thomson, South –Western.
De Boer, L., Labro, E., & Morlacchi, P. (2001). A review of methods supporting supplier selection,
European Journal of Purchasing and Supply Management, 7(2), 75–89.
Dubois, D., & Prade, H.(1978). Operations on fuzzy numbers, International Journal of Systems
Science, 9, 613–626.
Emanuel, M., Achille M., & Hokey, M. (2005). Consolidating a warehouse network: A physical programming approach, International Journal of Production Economics, 97, 1–17.
Feng, C. M., & Wang, R. T. (2000). Performance evaluation for airlines including the consideration of financial ratios, Journal of Air Transport Management, 6, 133–142.
Guneri, A.F., Cengiz, M., & Seker, S. (2009). A fuzzy ANP approach to shipyard location selection,
Expert Systems with Applications,36, 7992 – 7999.
Hees, P., & Siciliano, J. (1996). Management :Responsibility for performance, New York: McGraw-Hill.
Heizer, J., & Render, B. (2004). Principles of operations management, New Jersey: Prentice-Hall. Hwang, C.L., & Yoon, K. (1981). Multiple attribute decision making methods and applications, New
York: Springer-Verlag.
Jinxiang, G., Marc, G., & Leon, F. M. (2007). Invited Review, Research on warehouse operation: A
comprehensive review, European Journal of Operational Research, 177, 1–21.
Kahraman, C., Ruan, D., & Ibrahim D.G. (2003). Fuzzy group decision-making for facility location selection, Information Sciences, 157, 135–153.
Keufmann, A.,& Gupta, M.M., (1991). Introduction to Fuzzy Arithmetic: Theory and Application, New York: Van Nostrand Reinhold.
Kumar, M., Vrat, P., & Shankar, R. (2004). A fuzzy goal programming approach for vendor selection problem in a supply chain, Computers and Industrial Engineering, 46(1), 69–85.
Kuo, R. J., Chi, S. C., & Kao, S. S. (1999). A decision support system for locating convenience store through fuzzy AHP, Computers & Industrial Engineering, 37, 323–326.
Lee, H.L., & Billington, C. (1992). Managing supply chain inventory: Pitfalls and opportunities, Sloan
management review, 33(3), 64 – 67.
Li, G., Yamaguchi, D., & Nagai, M. (2007). A grey based decision making approach to the supplier selection problem. Mathematical and computer modeling, 46 (3-4), 573-581.
Liang, G.S., & Wang, M.J.J.(1991). A fuzzy multi-criteria decision-making method for facility site selection, International Journal of Production Research, 29(11), 2313–2330.
Liang, G. S.(1999). Fuzzy MCDM based on ideal and anti-ideal concepts, European Journal of
Operational Research, 112, 682–691.
Li, S.G., & Kuo, X. (2008). The inventory management system for automobile spare parts in a central warehouse, Expert Systems with Applications, 34, 1144–1153.
Mikhailov, L. (2002). Fuzzy analytical approach of partnership selection in formation of virtual enterprises, Omega, 30(2), 393–401.
Peter, B., & Marco, C. (2009). Warehouse design: A structured approach, European Journal of
Sanayei, A., Mousavi, S. F., & Yazdankhah, A. (2010). Group decision making process for supplier selection with VIKOR under fuzzy environment, Expert System with Applications, 37, 24 – 30 . Shuo,Y. C., Yao, H. C., & Chun,Y. S. (2008). A fuzzy simple additive weighting system under group
decision-making for facility location selection with objective/subjective attributes, European
Journal of Operational Research, 189, 132–145.
Shyur, H.J., & Shih, H.S. (2006). A hybrid MCDM model for strategic vendor selection, Mathematical
and Computer Modelling, 44(8), 749–761.
Simchi-Levi, D., Kaminsky, P., & Simchi-Levi, E. (2003). Designing & managing the supply chain, New York: McGraw-Hill.
Stevenson, W. J. (2005). Operations management, New York: McGraw-Hill.
Van Delft, A., & Nijkamp, P. (1977). Multi-criteria Analysis and Regional Decision-making, Leiden: Martinus Nijhoff Publishers.
Wang, Y. J., Lee, H. S., & Lin, K. (2003). Fuzzy TOPSIS for multi-criteria decision making,
International Mathematical Journal, 3, 367–379.
Wang, Y. J., & Lee, H. S. (2007). Generalizing TOPSIS for fuzzy multiple-criteria group decision-making, Computers and Mathematics with Applications, 53, 1762–1772.
Yang, J.L., Huan N. C., Gwo-Hshiung ,T., & Ruey H.,Y. (2008). Vendor selection by integrated fuzzy
MCDM techniques with independent and interdependent relationships, Information Sciences, 178,
4166–4183.
Zadeh, L.A. (1965). Fuzzy sets, Information and Control, 8, 338–353.