www.nat-hazards-earth-syst-sci.net/6/941/2006/ © Author(s) 2006. This work is licensed under a Creative Commons License.
and Earth
System Sciences
Determination of the rockfall source in an urban settlement area by
using a rule-based fuzzy evaluation
H. Aksoy and M. Ercanoglu
Hacettepe University, Engineering Faculty, Department of Geological Engineering, Applied Geology Division, 06800 Beytepe/Ankara, Turkey
Received: 4 July 2006 – Revised: 7 September 2006 – Accepted: 24 October 2006 – Published: 27 October 2006
Abstract. The evaluation of the rockfall initiation
mecha-nism and the simulation of the runout behavior is an impor-tant issue in the prevention and remedial measures for poten-tial rockfall hazards in highway protection, in forest preser-vation, and especially in urban settlement areas. In most of the studies in the literature, the extent of the rockfall hazard was determined by various techniques basing on the selec-tion of a rockfall source, generally defined as zones of rock bodies having slope angles higher than a certain value, pro-posed by general practice. In the present study, it was aimed to carry out a rule-based fuzzy analysis on the discontinuity data of andesites in the city of Ankara, Turkey, in order to bring a different and rather systematic approach to determine the source areas for rockfall hazard in an urban settlement, based on the discontinuity and natural slope features. First, to obtain rock source areas (RSAs), data obtained from the field studies were combined with a rule-based fuzzy evalua-tion, incorporating the altitude difference, the number of dis-continuities, the number of wedges and the number of poten-tial slides as the parameters of the fuzzy sets. After process-ing the outputs of the rule-based fuzzy system and produc-ing the lproduc-inguistic definitions, it could be possible to obtain potential RSAs. According to the RSA maps, 1.7% of the study area was found to have “high RSA”, and 5.8% of the study area was assigned as “medium RSA”. Then, potential rockfall hazard map was prepared. At the final stage, based upon the high and medium RSAs, 3.6% of the study area showed “high rockfall potential”, while areal distribution of “medium rockfall potential” was found as 7.9%. Both RSA and potential rockfall hazard map were in accordance with the observations performed in the field.
Correspondence to:M. Ercanoglu ([email protected])
1 Introduction
Rockfall is a natural phenomenon that can be defined as the detachment and falling of rock blocks down the slope of a rock body. These blocks may bounce or roll depending on the volume of the mass and the geometry of the rock slope and rock properties. In other respect, the word rockfall is usually used to describe small and rapid phenomena, diffi-cult to predict without any extensive instrumentation, from block falls of a few dm3up to 10 000 dm3events (Dussauge-Peisser et al., 2002). Initiation of a rockfall event can be sourced from different geological, geomorphologic, clima-tologic, and/or human-related processes such as change in pore water pressure, freezing and thawing, chemical/physical weathering, road cuts etc. In general, rockfall assessment by relevant parameters are difficult to assess due to its com-plex nature. Generally, the geometrical and geomechanical properties of the blocks and of the slopes, and the exact lo-cation of the rockfall source area (RSA) can not be properly described due to uncertainties (Crosta and Agliardi, 2003). Furthermore, it is difficult to quantify rockfall incidence and provide a general context (Duarte and Marquinez, 2002).
Selection of appropriate parameters, which are not only meaningful, but also necessary for the special cases, is the most important task of any methodology employed. In addi-tion, the difficulties in determining the various types of fac-tors such as the scale of the study, financial conditions, time, and experience may also affect the parameters to be used. Furthermore, it is important to use the resources in the most profitable way to provide methods and concepts which can be applied to gain the most benefit from lowest costs (Glade and Crozier, 2005).
ANKARA CASTLE
Kale Hill (986 m)
Timurlenk Hill (1003 m)
School BentderesiStreet Qal Qal Qal Yigitler District Onculer District Hıdırlık District Ta Ta Ta Ta Ta Plg N Orhangazi District 1 2 3 4 5 6 7 8 9 10 11 12 13 14 15 16 17
18 19 20
21 22 23 24 25 26 27 28 29 30 31 32 33 34 36 37 35 38 39 44 45 40 43 41 42 Fermanlılar District H. Ahmet Yesevi
Street Altındag Street x x S.Kaya Aldogan Street
0 200 400 m
EXPLANATIONS Qal Plg Ta Alluvium (Quaternary) River and lake sediments(Pliocene) Andesite (Miocene) Scanline locations 21 Road Possible RSAs
Observed rockfalls ofobvious origin Observed rockfalls of uncertainorigin 4424500 ANKARA ISTANBUL N 4422650 487800 489150 Black Sea Mediterranean Sea Old andesite quarries
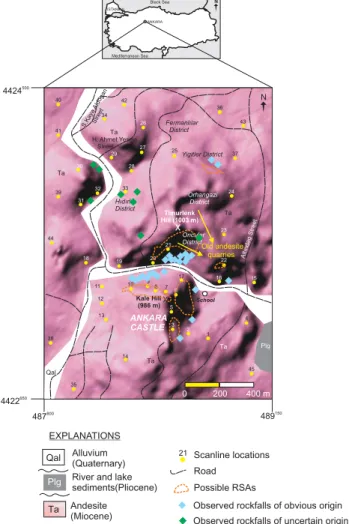
Fig. 1. Geological setting and rockfall inventory map of the study area.
settlement areas. In literature, numerous works were focused on the study of rockfall mechanism in mountainous regions to analyze the risk for highways, or to provide remedial mea-sures for highway protection, forest preservation and math-ematical approaches to simulate the runout behavior of the moving mass (e.g. Wieczorek et al., 1998; Baillifard et al., 2003; Guzzetti et al., 2003; Hantz et al., 2003; Jaboyedoff and Labiouse, 2003; Crosta and Agliardi, 2004; Dorren et al., 2004; Petje et al., 2005). Many of these studies were carried out at regional scale and rockfall models were pro-posed to estimate the extent of significant hazard. However, in almost all studies, the source area for the rockfall was de-termined either by evaluation based on observations in the field or selecting areas prone to rockfall on various models and assumptions assigning slope angles higher than a certain value based on professional experience (e.g. 60◦
in Guzzetti et al., 2003; 37◦
in Crosta et al., 2006), which in turn, is closely related to the mesh size of the DEM. In this respect, fractured or jointed rock bodies with steep slope angles were assumed to behave as source for rockfall.
Although there are some studies related to integration of fuzzy logic to general landslide concept (e.g. Chi et al., 2002; Ercanoglu and Gokceoglu, 2002; Gorsevski et al., 2003; Er-canoglu and Gokceoglu, 2004) and hazard or risk manage-ment (e.g. Krause et al., 2005), we believe that the present study will contribute to the fuzzy logic related landslide eval-uation in terms of rockfall source area determination. In the present study, it was attempted to carry out a rule-based fuzzy analysis on the discontinuity data of andesites in the city of Ankara, Turkey, in order to bring a different approach to determine the source areas for rockfall hazard in an ur-ban settlement based on the discontinuity and natural slope features. To obtain RSAs, data obtained from the field stud-ies were combined with a rule-based fuzzy approach, and, at the final stage, potential rockfall hazard maps were ob-tained. The crucial points of this study are twofold: (a) deter-mination of RSAs by rule-based fuzzy approach, and (b) pro-viding a potential rockfall hazard map. The authors believe that the preparation of a potential rockfall hazard map in this study satisfies the need for such an issue in the study area, as suggested in the previous works (e.g. Ercanoglu, 1997; Gokceoglu et al., 2000; Ercanoglu and Aksoy, 2004) carried out in the same area.
2 Presentation of the study area
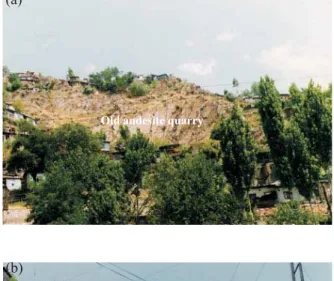
The study area, covering about 2.5 km2in a densely popu-lated zone, is situated in the central part of Ankara, the cap-ital city of Turkey (Fig. 1), It has been the subject of many studies (e.g. Ercanoglu, 1997; Gokceoglu et al., 2000; Er-canoglu and Aksoy, 2004). There are a host of squatters built unconciously in old andesite quarries and historical Ankara Castle. This part of the city is considered as a typical un-controlled urbanization area. In this part of the city, several rockfall incidences were observed to cause at least material damage to the houses and roads, and threaten from time to time human life. However, there are no reliable rockfall his-tory data. Figures 2a, b, and c show the general character of the rock medium in the study area.
The principal rock unit in the area consists of Miocene aged andesites, forming high topographical features with several joint sets developed systematically. Andesites in the study area are generally steeply jointed, and were considered as the products of Miocene volcanism in Central Anatolia (Erol, 1961; Erentoz, 1975). The rock has a rather fresh appearance throughout the area, showing local weathering. Other geological units of minor superficial distribution are Pliocene aged lacustrine deposits and recent alluvium, form-ing lower altitude morphological features (see Fig. 1).
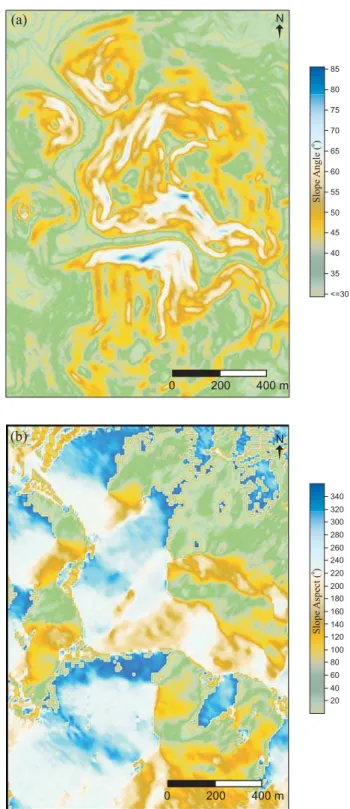
planning of land use in urban areas. In fact, in literature there exist similar studies on rockfall hazard assessment in urban areas using map scales 1:5000 or smaller (e.g. Agliardi and Crosta, 2003; Ayala-Carcedo et al., 2003). Maps of scale greater than 1:20 000 would be acceptable for slope stabil-ity studies in sensitive areas, residential planning or haz-ard zonation (Resources Inventory Committee, 1996). Thus, a DEM (Digital Elevation Model) was prepared from the 1/5000 scaled topographic map of the study area (see Fig. 1). It contains 190 rows and 150 columns on the basis of a 9×9 m grid base. Topographical elevations range between
850 and 1003 m. The higher elevations form the steep slopes, where the slope angle values reach nearly 90◦
. The slope an-gle and slope aspect maps derived from the DEM are given in Figs. 3a and b, respectively. In this figure, the slope angles and the slope aspects (orientations) were calculated on pixel basis using SURFER (Ver. 8) (2002) program to produce the database on slope geometry, which will be used in further analyses.
3 Discontinuity data
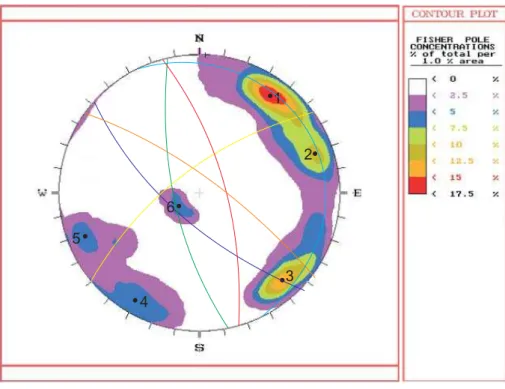
When dealing with jointed or fractured rock masses, identify-ing the characteristics of the discontinuities is a very impor-tant stage. A detailed discontinuity survey conforming with the ISRM (1981) standards was performed in the area during the years 1996 and 1997 along 36 scanlines; and the database was improved with additional scanlines in 2005 yielding a to-tal number of 2106 discontinuity records along 45 scanlines (see Fig. 1). To determine the major discontinuity sets, 2106 measured discontinuities were plotted and processed using the software DIPS (Diedrics and Hoek, 1989). According to these analyses, six major discontinuity sets were identified in the study area (Fig. 4). The properties of the discontinuities used in the analyses are given in Table 1.
During the field studies, 35 rockfall incidences were mapped based on the field observations and communication with local people. Possible source areas of these rockfall incidences were also mapped during the field studies (see Fig. 1). Nevertheless, some of them could not have been mapped due to the dense settlement in the study area.
Field investigations and related literature (e.g. Karacan and Kasapoglu, 1986; Ercanoglu, 1997; Kasapoglu, 2000; Ercanoglu and Aksoy, 2004) indicated that the types of dis-continuities present in the rock unit studied where principally cooling and tectonic types of joints. The cooling joints de-veloped in the rock units generally occur as vertical or near to vertical surfaces with different orientations. On the other hand, the tectonic joints are observed as tension or shear fractures in relation to the tectonic regime that prevailed dur-ing the Neogene (Karacan and Kasapoglu, 1986; Kasapoglu, 2000).
(a)
(b)
(c)
Old andesite quarry
Roof of a house
Fallen blocks close to the houses
Rockfall on the road
Table 1.Characteristics of the discontinuities.
Discontinuity set Dip direction/dip (◦
) Mean discontinuity spacing (m)
1 220/75 0.34
2 255/76 0.39
3 321/75 0.27
4 034/79 0.34
5 072/75 0.36
6 061/14 0.21
4 Selection and preparation of the parameters for
anal-yses
When applying any model to assess a natural hazard, it is very important to define the criteria controlling the hazard in concern. Generally, the criteria depend both on real geo-environmental conditions and the purpose of mapping. In ad-dition, engineering judgment has to be used to establish the real criteria for the real geo-environment (Abdolmasov and Obradovic, 1997). In other words, selection of the parame-ters or layers in such treatment depends mainly upon engi-neering judgment and/or expert opinion. This means that it is natural to consider any parameter effective on the problem definition should be taken into account in the definition of the relation between the input(s) and the output(s).
To evaluate rockfall hazard, at the first stage, origin and initiation conditions, provided by RSAs, should be defined and/or mapped. In general, RSAs can be mapped by field work and/or air photo interpretations. With the aid of Geo-graphic Information System (GIS), it became easier to assess and evaluate RSAs since the topographic data can easily be obtained, particularly for regional scale studies. Different data sources which may be effective on rockfall occurrence are available (e.g. slope angle, discontinuity characteristics, curvature, slope scree, distance to faults, block size, block shape etc.). For example, in terms of curvature, slope con-cavity and convexity influence the velocity and energy losses. With larger slope concavity the runout distance of rockfall is substantially larger (Petje et al., 2005). On the other hand, the presence of slope scree below the rock cliff suggests slope raveling activity, and it can be linked to the progressive fail-ure (Baillifard et al., 2003). As can be seen from these ex-amples, selected parameters and their importance on rockfall event may change from one location to another. In addition, data availability, reliability, and rockfall history (i.e. inven-tory) become important for the analyses.
Based on the field observations, it was concluded that the rockfall initiation in the present study was completely related to natural slope and discontinuity characteristics in the study area. Along with the rock slope geometry (i.e. slope angle and slope aspect), the authors believe that the presence of dis-continuities, their frequency, their capability of forming rock
blocks or wedges, and ability to produce movement along the discontinuity surfaces all contributed to the rockfall potential and might have been included in the evaluation to determine the source area for rockfall. Therefore, the following mor-phological and structural features of the area were adopted as the parameters to be used in the fuzzy evaluation of which the details will be given later in the section devoted to the methodology: (i) altitude difference, (ii) average number of discontinuities, (iii) average number of wedges, (iv) average number of slide potential.
To evaluate the above parameters, the DEM of the study area and the discontinuity database were used, and four different maps were obtained for the parameters cited above. The computer program Matterocking (Version 2.0) (2002), produced by CREALP (Centre de Recherche Sur L’environnement Alpin), was used to produce the parameter maps. It uses the DEM, as a treatment file (slope and slope aspect) and discontinuity characteristics (dip, dip direction, and spacing) for detection of rock slope instabilities. The de-tails can be found in the manual of the software, or on the website (http://www.quanterra.org/softs.HTM).
5 Methodology
runout zones. On the other hand, empirical models make use of available data sets on different processes and therefore are subjected to a high degree of approximation. In fact, it is of-ten difficult to have a complete and satisfactory description of the actual process, geometry, and rock detachment conditions (Crosta et al., 2003). Although rock slope analyses are com-monly based on conventional stability analysis techniques, empirical estimates, and more sophisticated numerical meth-ods, it should always be remembered that the more advanced models are, the highest is the input data requirement, and thus, the more complex is the assessment. Hence, empirical and conventional techniques are applied for back analysis or for preliminary assessments. Detailed site-specific investi-gations require numerical models based on continuum mod-eling, discontinuum modmod-eling, or hybrid/coupled modeling. The latter models, in particular, are used in mining and civil engineering applications (Glade and Crozier, 2005).
In general, most of the engineering geological problems are complex and exact solutions to these problems rarely ex-ist because the relationships among the variables of the prob-lem(s) are not known exactly due to imprecision and uncer-tainty (Alvarez-Grima, 2000). In the last two decades, there has been an increasing awareness and utilization of AI (Ar-tificial Intelligence) techniques in engineering geology. The most important reason for this situation may be sourced from the ability of AI techniques to handle imprecise data in engi-neering geology effectively. A rule-based fuzzy model, one of the most widely used fuzzy modeling techniques, was em-ployed to determine the RSAs in this study.
After introduction of fuzzy set concept by Zadeh (1965), rule-based fuzzy approach (Zadeh, 1973), based on human thinking, emerged to solve complex problems in engineering applications in succeeding years. Fuzzy rules are linguis-tic descriptions to solve a certain problem using “If–Then” rules, and a way of representing knowledge about the prob-lem considered. A fuzzy rule comprises two different parts as explained below:
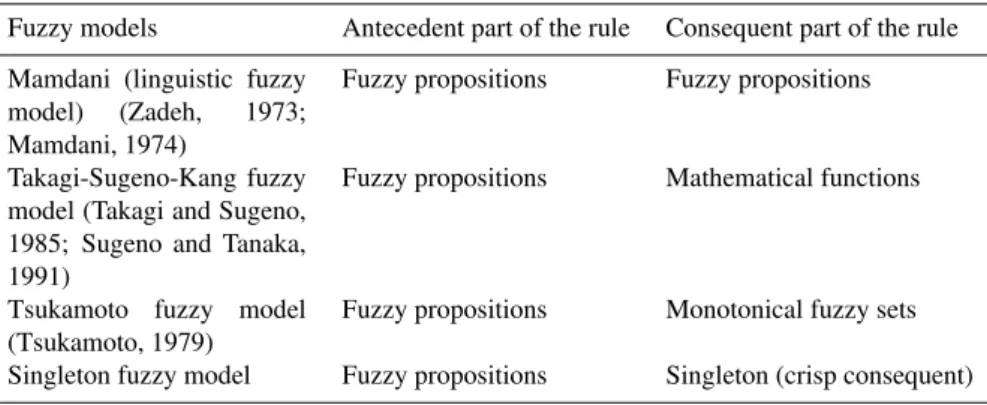
Ifpremise (antecedent)Thenconclusion (consequent) (1) This form of expression is referred to the “If–Then” rule-based form, and it expresses a fuzzy interference between an-tecedent and consequent parts by propositions (Ross, 1995). The existing rule-based models and their main differences were summarized in Table 2. In this study, the Mamdani model (linguistic fuzzy model) was used to determine the RSAs. “If–Then” rule structure of this model was given in the following form:
Ri : Ifxi isAiland ...andXr isAirThenyisBi,
fori=1,2, ..., k (2)
wherekis the number of rules,xi(i=1, 2, ..., l) are the input
variables,yis the output variable. The schematic representa-tion and process units were given in Fig. 5. The other impor-tant concepts about Mamdani model can be found in detail
<=30 35 40 45 50 55 60 65 70 75 80 85
20 40 60 80 100 120 140 160 180 200 220 240 260 280 300 320 340 (a)
(b)
0 200 400 m
0 200 400 m
N
N
Slope
Angle
(
)
0
Slope
Aspect
(
)
0
Fig. 3. (a)Slope map of the study area,(b)slope aspect map of the study area.
in different sources (e.g. Ross, 1995; Berkan and Trubatch, 1997; Alvarez Grima, 2000; Negnevitsky, 2002).
2106 2106
1
2
3
4 5
6 7
Fig. 4.Presentation of the main discontinuity sets.
Medium
Low
Medium
Low
If
and
Then
If
and
Then
min
min
High
R :
1
R :
20 0.1 0.5 1
0 1
0
1
Very High
B
1Y
1.25 21 2.5
Aggregation (max, or)
B
2B
Y
Y
1 2
Y=1.5
Defuzzification
R :
1
If x is medium and x is low Then Y is very high.
1 2R :
2
If x is low and x is medium Then Y is high.
1 2x
1x
20 0.1 0.6 1
0 1
0 1
0 1
Table 2.Existing rule-based fuzzy models and their main differences (After Alvarez-Grima, 2000).
Fuzzy models Antecedent part of the rule Consequent part of the rule
Mamdani (linguistic fuzzy model) (Zadeh, 1973; Mamdani, 1974)
Fuzzy propositions Fuzzy propositions
Takagi-Sugeno-Kang fuzzy model (Takagi and Sugeno, 1985; Sugeno and Tanaka, 1991)
Fuzzy propositions Mathematical functions
Tsukamoto fuzzy model (Tsukamoto, 1979)
Fuzzy propositions Monotonical fuzzy sets
Singleton fuzzy model Fuzzy propositions Singleton (crisp consequent)
linguistic variables; (b) determination of fuzzy sets; (c) elici-tation and construction of fuzzy rules; (d) encoding the fuzzy sets, fuzzy rules, and procedures to perform fuzzy inference in to the model; (e) evaluation of the model (Negnevitsky, 2002). These steps were adapted and updated according to the aim of the study to build Mamdani model with respect to the considered input parameters-RSA interaction in the fol-lowing paragraphs.
5.1 Step 1
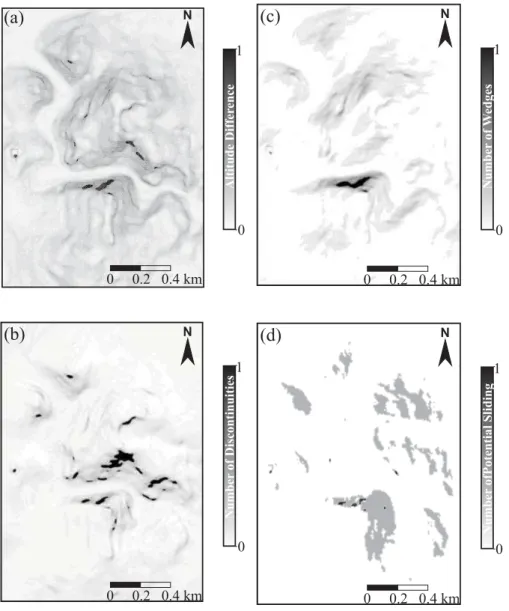
The first, and probably the most important, step in build-ing the fuzzy model is to specify the problem (Negnevitsky, 2002). To perform this, at the first stage, we selected four in-put parameters such as altitude difference, number of discon-tinuities, number of wedges, and number of potential sliding, considered as effective on rockfall initiation in the study area. The first parameter was the altitude difference. Given the morphology of a rock slope, flat areas, where the altitude dif-ference is zero or very low, were assumed that they could not be source for rockfall regardless of other conditions such as discontinuity orientation, spacing etc. However, areas hav-ing higher altitude differences may be RSAs as they have ca-pability of producing rockfall if favorable discontinuity dip and dip direction conditions were reached. In other words, rockfall potential will increase if the altitude difference in-creases between two neighboring points, i.e., steeper rock slopes will be more suitable for higher potential energy, thus will present greater rockfall hazard potential. Altitude dif-ference was computed with the “Altitude Difdif-ference” mod-ule of Matterocking. It calculates the maximum height of a slope using maximum difference between two extreme points within the cells of the DEM. In other words, calculated val-ues correspond to a rough estimate of cliff height (Matte-rocking, 2002). The normalized altitude difference map was given in Fig. 6a, and the linguistic definitions of normalized values were tabulated in Table 3.
The second parameter was the average number of disconti-nuities per unit cell. It was calculated by the “Number of
Dis-continuities (spacing)” module of Matterocking. It creates a file containing the average number of discontinuities per unit cell using dip, dip direction, and spacing features of discon-tinuities. To calculate this value for each pixel, discontinu-ity characteristics were employed (see Table 1). The main idea herein with respect to RSA was that increasing number of discontinuities would increase the capability of producing rock blocks. The normalized number of discontinuities per unit cell map was given in Fig. 6b, and the linguistic def-initions of normalized values were tabulated in Table 3. It should be noted that this map was obtained by overlying of 6 different maps showing the characteristics of 6 different dis-continuity sets.
The average number of wedges, the third input parameter, was computed by “Number of Wedges” module of Matte-rocking. This module creates a file containing the average number of wedges per unit cells of the DEM. The idea be-hind the number of wedge parameter is similar to that of the parameter for the number of discontinuities. To produce a wedge, at least two discontinuity sets are necessary to inter-sect. Therefore, all possible combinations of 6 discontinuity sets were taken into consideration, and they were overlaid and normalized in [0,1]. The final map was obtained and shown in Fig. 6c. Linguistic definitions of this parameter was tabulated in Table 3.
The last input parameter was the average number of poten-tial sliding. “Potenpoten-tial Sliding Zone” module of Matterock-ing asks for orientation of a discontinuity set. It calculates a file comprising 1 (slide potential) and−1 (no-slide potential)
(a)
(b)
N
N
0 0.2 0.4 km
0 0.2 0.4 km
1
1 0
0
Altitude
Differ
ence
Number
of
Discontinuities
(c)
(d)
N
N
0 0.2 0.4 km
0 0.2 0.4 km
1
1 0
0
Number
of
W
edges
Number
ofPotential
Sliding
Fig. 6. Input parameter maps: (a)altitude difference,(b)average number of discontinuities (spacing),(c)average number of wedges,(d)
average number of potential sliding.
5.2 Step 2
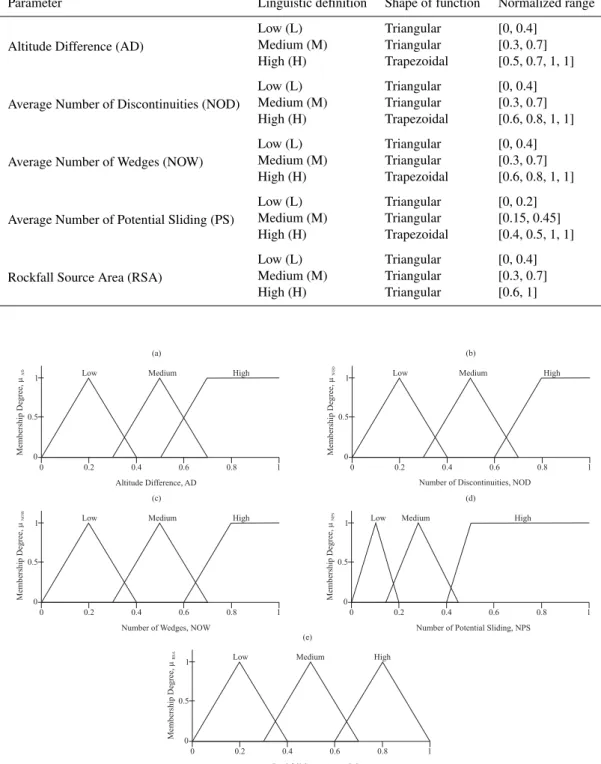
In this step, fuzzy sets were defined. Fuzzy sets representing the parameter effect on capability of being RSA were given in Figs. 7a, b, c, d, and e. Triangular and trapezoidal shaped membership functions were selected to define input and out-put parameters using MATLAB 6.5 (Fuzzy Logic Toolbox) computer program. The boundaries of each linguistic param-eter were constituted by means of engineering judgment and expert knowledge, based on the information gathered from the study area.
5.3 Step 3
Table 3.Input/output parameters of the fuzzy system and related linguistic definitions.
Parameter Linguistic definition Shape of function Normalized range
Altitude Difference (AD)
Low (L) Triangular [0, 0.4]
Medium (M) Triangular [0.3, 0.7] High (H) Trapezoidal [0.5, 0.7, 1, 1]
Average Number of Discontinuities (NOD)
Low (L) Triangular [0, 0.4]
Medium (M) Triangular [0.3, 0.7] High (H) Trapezoidal [0.6, 0.8, 1, 1]
Average Number of Wedges (NOW)
Low (L) Triangular [0, 0.4]
Medium (M) Triangular [0.3, 0.7] High (H) Trapezoidal [0.6, 0.8, 1, 1]
Average Number of Potential Sliding (PS)
Low (L) Triangular [0, 0.2]
Medium (M) Triangular [0.15, 0.45] High (H) Trapezoidal [0.4, 0.5, 1, 1]
Rockfall Source Area (RSA)
Low (L) Triangular [0, 0.4]
Medium (M) Triangular [0.3, 0.7]
High (H) Triangular [0.6, 1]
1
1
1
1 1
0
0
0
0 0 0
0
0
0 0 0.2
0.2
0.2
0.2 0.2 0.4
0.4
0.4
0.4 0.4 0.6
0.6
0.6
0.6 0.6 0.8
0.8
0.8
0.8 0.8 1
1
1
1 1 0.5
0.5
0.5
0.5 0.5 Low
Low
Low
Low Low Medium
Medium
Medium
Medium
Medium High
High
High
High High
Membership
Degree,
m
AD
Membership
Degree,
m
NOW
Membership
Degree,
m
RSA
Membership
Degree,
m
NPS
Membership
Degree,
m
NOD
Altitude Difference, AD
Number of Wedges, NOW
Rockfall Source Area, RSA
Number of Potential Sliding, NPS Number of Discontinuities, NOD (a)
(c)
(e)
(d) (b)
Fig. 7. Fuzzy sets and membership functions for input/output parameters: (a)altitude difference,(b)average number of discontinuities (spacing),(c)average number of wedges,(d)average number of potential sliding,(e)rockfall source area.
5.4 Step 4
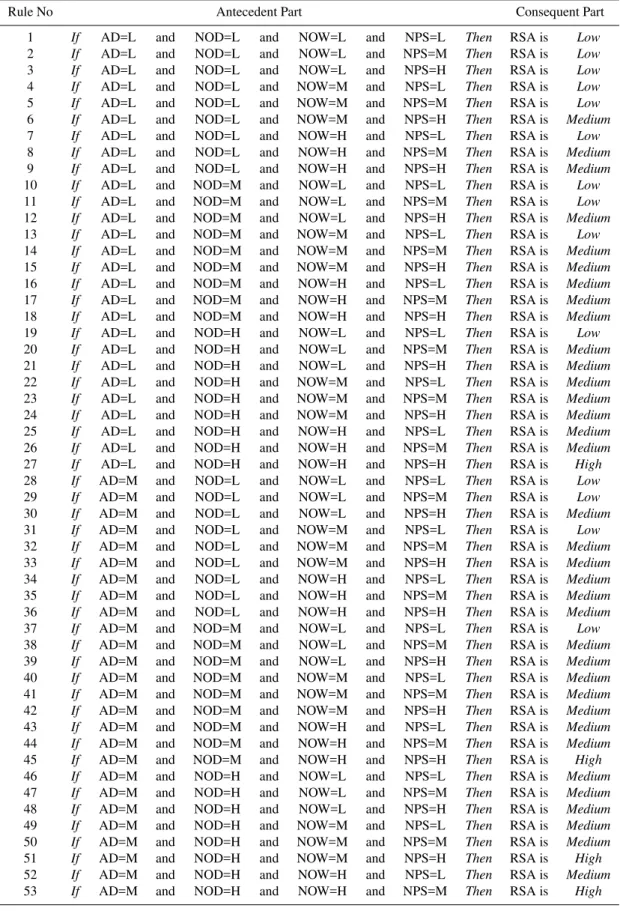
In this step, fuzzy sets, fuzzy rules, and Mamdani linguis-tic fuzzy model were combined using Fuzzy Logic Toolbox.
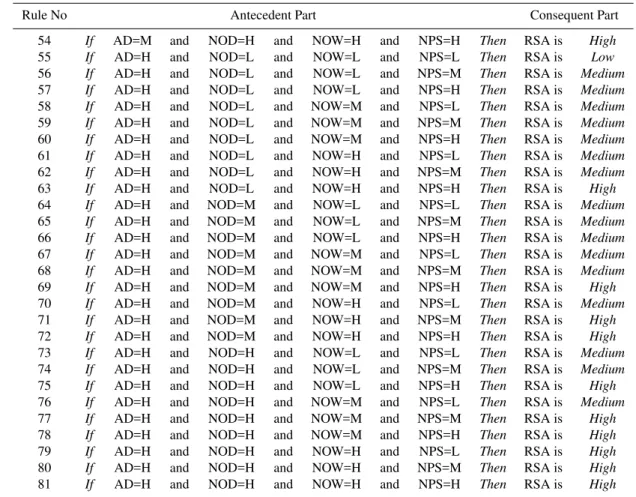
Table 4.If–Then rules used in the study.
Rule No Antecedent Part Consequent Part
1 If AD=L and NOD=L and NOW=L and NPS=L Then RSA is Low
2 If AD=L and NOD=L and NOW=L and NPS=M Then RSA is Low
3 If AD=L and NOD=L and NOW=L and NPS=H Then RSA is Low
4 If AD=L and NOD=L and NOW=M and NPS=L Then RSA is Low
5 If AD=L and NOD=L and NOW=M and NPS=M Then RSA is Low
6 If AD=L and NOD=L and NOW=M and NPS=H Then RSA is Medium
7 If AD=L and NOD=L and NOW=H and NPS=L Then RSA is Low
8 If AD=L and NOD=L and NOW=H and NPS=M Then RSA is Medium
9 If AD=L and NOD=L and NOW=H and NPS=H Then RSA is Medium
10 If AD=L and NOD=M and NOW=L and NPS=L Then RSA is Low
11 If AD=L and NOD=M and NOW=L and NPS=M Then RSA is Low
12 If AD=L and NOD=M and NOW=L and NPS=H Then RSA is Medium
13 If AD=L and NOD=M and NOW=M and NPS=L Then RSA is Low
14 If AD=L and NOD=M and NOW=M and NPS=M Then RSA is Medium
15 If AD=L and NOD=M and NOW=M and NPS=H Then RSA is Medium
16 If AD=L and NOD=M and NOW=H and NPS=L Then RSA is Medium
17 If AD=L and NOD=M and NOW=H and NPS=M Then RSA is Medium
18 If AD=L and NOD=M and NOW=H and NPS=H Then RSA is Medium
19 If AD=L and NOD=H and NOW=L and NPS=L Then RSA is Low
20 If AD=L and NOD=H and NOW=L and NPS=M Then RSA is Medium
21 If AD=L and NOD=H and NOW=L and NPS=H Then RSA is Medium
22 If AD=L and NOD=H and NOW=M and NPS=L Then RSA is Medium
23 If AD=L and NOD=H and NOW=M and NPS=M Then RSA is Medium
24 If AD=L and NOD=H and NOW=M and NPS=H Then RSA is Medium
25 If AD=L and NOD=H and NOW=H and NPS=L Then RSA is Medium
26 If AD=L and NOD=H and NOW=H and NPS=M Then RSA is Medium
27 If AD=L and NOD=H and NOW=H and NPS=H Then RSA is High
28 If AD=M and NOD=L and NOW=L and NPS=L Then RSA is Low
29 If AD=M and NOD=L and NOW=L and NPS=M Then RSA is Low
30 If AD=M and NOD=L and NOW=L and NPS=H Then RSA is Medium
31 If AD=M and NOD=L and NOW=M and NPS=L Then RSA is Low
32 If AD=M and NOD=L and NOW=M and NPS=M Then RSA is Medium
33 If AD=M and NOD=L and NOW=M and NPS=H Then RSA is Medium
34 If AD=M and NOD=L and NOW=H and NPS=L Then RSA is Medium
35 If AD=M and NOD=L and NOW=H and NPS=M Then RSA is Medium
36 If AD=M and NOD=L and NOW=H and NPS=H Then RSA is Medium
37 If AD=M and NOD=M and NOW=L and NPS=L Then RSA is Low
38 If AD=M and NOD=M and NOW=L and NPS=M Then RSA is Medium
39 If AD=M and NOD=M and NOW=L and NPS=H Then RSA is Medium
40 If AD=M and NOD=M and NOW=M and NPS=L Then RSA is Medium
41 If AD=M and NOD=M and NOW=M and NPS=M Then RSA is Medium
42 If AD=M and NOD=M and NOW=M and NPS=H Then RSA is Medium
43 If AD=M and NOD=M and NOW=H and NPS=L Then RSA is Medium
44 If AD=M and NOD=M and NOW=H and NPS=M Then RSA is Medium
45 If AD=M and NOD=M and NOW=H and NPS=H Then RSA is High
46 If AD=M and NOD=H and NOW=L and NPS=L Then RSA is Medium
47 If AD=M and NOD=H and NOW=L and NPS=M Then RSA is Medium
48 If AD=M and NOD=H and NOW=L and NPS=H Then RSA is Medium
49 If AD=M and NOD=H and NOW=M and NPS=L Then RSA is Medium
50 If AD=M and NOD=H and NOW=M and NPS=M Then RSA is Medium
51 If AD=M and NOD=H and NOW=M and NPS=H Then RSA is High
52 If AD=M and NOD=H and NOW=H and NPS=L Then RSA is Medium
Table 4.Continued.
Rule No Antecedent Part Consequent Part
54 If AD=M and NOD=H and NOW=H and NPS=H Then RSA is High
55 If AD=H and NOD=L and NOW=L and NPS=L Then RSA is Low
56 If AD=H and NOD=L and NOW=L and NPS=M Then RSA is Medium
57 If AD=H and NOD=L and NOW=L and NPS=H Then RSA is Medium
58 If AD=H and NOD=L and NOW=M and NPS=L Then RSA is Medium
59 If AD=H and NOD=L and NOW=M and NPS=M Then RSA is Medium
60 If AD=H and NOD=L and NOW=M and NPS=H Then RSA is Medium
61 If AD=H and NOD=L and NOW=H and NPS=L Then RSA is Medium
62 If AD=H and NOD=L and NOW=H and NPS=M Then RSA is Medium
63 If AD=H and NOD=L and NOW=H and NPS=H Then RSA is High
64 If AD=H and NOD=M and NOW=L and NPS=L Then RSA is Medium
65 If AD=H and NOD=M and NOW=L and NPS=M Then RSA is Medium
66 If AD=H and NOD=M and NOW=L and NPS=H Then RSA is Medium
67 If AD=H and NOD=M and NOW=M and NPS=L Then RSA is Medium
68 If AD=H and NOD=M and NOW=M and NPS=M Then RSA is Medium
69 If AD=H and NOD=M and NOW=M and NPS=H Then RSA is High
70 If AD=H and NOD=M and NOW=H and NPS=L Then RSA is Medium
71 If AD=H and NOD=M and NOW=H and NPS=M Then RSA is High
72 If AD=H and NOD=M and NOW=H and NPS=H Then RSA is High
73 If AD=H and NOD=H and NOW=L and NPS=L Then RSA is Medium
74 If AD=H and NOD=H and NOW=L and NPS=M Then RSA is Medium
75 If AD=H and NOD=H and NOW=L and NPS=H Then RSA is High
76 If AD=H and NOD=H and NOW=M and NPS=L Then RSA is Medium
77 If AD=H and NOD=H and NOW=M and NPS=M Then RSA is High
78 If AD=H and NOD=H and NOW=M and NPS=H Then RSA is High
79 If AD=H and NOD=H and NOW=H and NPS=L Then RSA is High
80 If AD=H and NOD=H and NOW=H and NPS=M Then RSA is High
81 If AD=H and NOD=H and NOW=H and NPS=H Then RSA is High
During the defuzzification process, centroid method, which is generally used in that kind of applications because of its simplicity and producing consistent results, was chosen. 5.5 Step 5
In this step, outputs of the rule-based fuzzy system analy-ses processed to produce RSA were used. To perform this, outputs of the system were assigned to produce RSA maps based on fuzzy sets defined in the Step 2 and original in-put values replaced with linguistic definitions. This process was repeated for all combinations of the input parameters and their subgroups, and final RSA map (Fig. 8) was obtained. 5.6 Step 6
At the last step, after obtaining the RSAs ranging between low and high (actually in [0,1]), in order to evaluate rockfall potential, another computer program, Conefall (2003), was used. It is designed to estimate roughly the potential rock-fall prone areas based on the given RSAs. The theory be-hind the program was based on the logic proposed by Evans and Hungr (1993), and it was used in different rockfall
haz-ard assessments and applications effectively (e.g. Jaboyed-off and Labiouse, 2003). In order to evaluate the areas to be affected by rockfall hazard, firstly, RSAs should be de-fined. Using the ASCII *.grd file of RSAs obtained in the previous step (see Fig. 8), it was entered as inputs to the program with DEM ASCII *.grd file of the study area. In the program−1 and +1 values were defined for “not source
area” and “source area”, respectively. The areas having low RSA values were not taken into consideration as they also contain zero RSAs, not having contribution to rockfall initi-ation. Therefore, two different RSAs, assigned as medium and high, were entered to the program separately to produce a rockfall potential map. Taking into account the cone angle 33◦
N
0 200 400 m
RSA
High
Medium
Low
Possible RSAs
Observed rockfalls of obvious origin
Observed rockfalls of uncertain origin
Fig. 8.RSA map of the study area.
6 Results and conclusions
Following results and conclusions can be drawn from this study:
(1) The main objective in starting the present study was to determine the RSAs around the Ankara Castle area and its vicinity as there had been several rockfall inci-dences, causing rock blocks to hit many houses, fall on the roads, and give rise to damage to other facilities. In this study, a rule-based fuzzy system was used to evalu-ate the RSAs in an urban settlement, where many houses had been unconsciously built very close to the historical Ankara Castle and in old andesite quarries. A potential rockfall hazard map was also produced to satisfy the lack of rockfall assessment in the study area. Despite the fact that rockfall hazard potential was emphasized in almost all previous studies carried out in the same area, there were neither qualitative and/or quantitative evaluation considering rockfall event, nor a rockfall
in-(a)
(b)
N
N
Medium RSA Medium RSA
Areas of medium rockfall potential Areas of medium rockfall potential
Fig. 9.Potential rockfall hazard map of the study area.
ventory and/or database, which could be considered as one of the most important stages of any natural hazard assessment.
This situation also concluded that there could be more RSAs than expected.
(3) Potential rockfall hazard map was prepared to show high and medium potential rockfall hazard zones. Ac-cording to this map based upon the high and medium RSAs, 3.6% of the study area showed “high rockfall potential”, while areal distribution of “medium rockfall potential” was found as 7.9%. If the ratios of being RSA and capability of producing rockfall hazard were taken into consideration, it may be concluded that the “high RSAs” have much greater capability of producing rock-fall potential than those of the “medium RSAs” with respect to areal distributions. In addition, according to this map, a considerable amount of area in the urban settlement district and roads seemed to be under rock-fall threat.
(4) Although mapping of RSA and rockfall potential seem to be easy to map during field work by direct mapping, it is not always possible to produce consistent maps due to the complex nature of rockfall phenomenon. In fact, modeling the rockfall potential and/or producing rockfall scenarios using constant geomechanical param-eters and topographical irregularities may cause incor-rect results particularly for the slopes boasting complex features. For example, numerical and/or analytical ap-proaches, based upon generally geomechanical and to-pographical features of the slopes, may be affected by the parametric diversity of the considered slopes and materials, so that they may not represent actual condi-tions and may be insufficient. Furthermore, it is not easy to evaluate which parameter played the most important role on the rockfall occurrence. Under these conditions, soft computing techniques such as fuzzy logic, consid-ering all parametric relations and their effects as a whole for the defined problem, can be used to evaluate the rather complex nature of the rockfall event, at least for the initial stage of the evaluation processes. It would be recommended to perform further detailed numerical and analytical treatment after determining potentially haz-ardous areas.
(5) Resulting maps may be useful for the decision mak-ers and municipality plannmak-ers, and provide information about the rockfall phenomenon for the area in concern. It should be noted that the rockfall hazard maps pro-duced in this study do not intend to be integrated as a part of any settlement planning project in the study area. However, such a work would yield useful infor-mation on potentially safe and unsafe zones if carried out especially prior to any site selection decision in an area prone to rockfall hazard.
Acknowledgements. The authors would like to thank M. Jaboyed-off for his suggestions and comments in using the program
CONEFALL and producing rockfall source map. The authors would also like to thank T. Glade (Editor) and T. Topal for their evaluation and valuable comments and encouragement, which increased the quality of the paper.
Edited by: T. Glade
Reviewed by: M. Jaboyedoff and T. Topal
References
Abdolmasov, B. and Obradovic, I.: Evaluation of geological pa-rameters for landslide hazard mapping, Proc. Int. Symp. Eng. Geol.&Env., 23–27 June 1997, Athens, Greece, edited by: Mari-nos, P. G., Koukis, G. C., Tsiambaos, G. C., and Stournaras, G. C., Balkema, 471–476, 1997.
Agliardi, F. and Crosta, G. B.: High resolution three-dimensional numerical modelling of rockfalls, International Journal of Rock Mechanics&Mining Sciences, 40, 455–471, 2003.
Aleotti, P. and Chowdhury, R.: Landslide hazard assessment: sum-mary review and new perspectives, Bull. Eng. Geol. Environ., 58, 21–44, 1999.
Alvarez Grima, M.: Neuro-fuzzy Modeling in Engineering Geol-ogy, Balkema, Rotterdam, 2000.
Ayala-Carcedo, F. J., Cubillo-Nielsen, S., Alvarez, A., Dominguez, M. J., Lain, L., Lain, R., and Ortiz, G.: large scale rockfall reach susceptibility maps in La Cabrera Sierra (Madrid) performed with GIS and dynamic analysis at 1:5000, Nat. Hazards, 30, 325– 340, 2003.
Baillifard, F., Jaboyedoff, M., and Sartori, M.: Rockfall hazard mapping along a mountainous road in Switzerland using a GIS-based parameter rating approach, Nat. Hazards Earth Syst. Sci., 3, 431–438, 2003,
http://www.nat-hazards-earth-syst-sci.net/3/431/2003/.
Berkan, R. C. and Trubatch, S. L.: Fuzzy Systems Design Princi-ples, IEEE Neural Networks Council, New York, 1997. Chi, K., Park, N. W., and Chung, C. J.: Fuzzy logic integration for
landslide hazard mapping using spatial data from Boeun, Korea, Symposium on Geospatial Theory, Processing and Applications, Ottawa, 283–288, 2002.
Coggan, J. S., Stead, D., and Eyre, J. M.: Evaluation of techniques for quarry slope stability assessment, Trans. Instit. Min. Metall., 107, B139–B147, 1998.
Conefall (1.0): User’s Guide. Open report – Soft 01,Quanterra, http: //www.quanterra.org, 15 p., 2003.
Crosta, G. B. and Agliardi, F.: A methodology for physically based rockfall hazard assessment, Nat. Hazards Earth Syst. Sci., 3, 407–422, 2003,
http://www.nat-hazards-earth-syst-sci.net/3/407/2003/.
Crosta, G. B., Imposimato, S., and Roddeman, D. G.: Numerical modelling of large landslides stability and runout, Nat. Hazards Earth Syst. Sci., 3, 523–538, 2003,
http://www.nat-hazards-earth-syst-sci.net/3/523/2003/.
Crosta, G. B. and Agliardi, F.: Parametric evaluation of 3D dis-persion of rockfall trajectories, Nat. Hazards Earth Syst. Sci., 4, 583–598, 2004,
http://www.nat-hazards-earth-syst-sci.net/4/583/2004/.
rockfall susceptibility assessment, Geophys. Res. Abstr., 8, 08255, 2006.
Diedrics, M. S. and Hoek, E.: DIPS, a computer program for stereo-graphic net (Version 2.2, Advanced Version), Rock Engineering Group, Department of Civil Engineering Group, University of Toronto, Toronto, Canada, 1989.
Dorren, L. K. A.: Mountain geoecosystems: GIS modelling of rock-fall and protection forest structure, Thesis Universiteit van Ams-terdam, ISBN: 90-9016094-9, 162 p., 2002.
Dorren, L. K. A., Maier, B., Putters, U. S., and Seijmonsbergen, A. C.: Combining field and modelling techniques to assess rockfall dynamics on a protection forest hillslope in the European Alps, Geomorphology, 57, 151–167, 2004.
Duarte, R. M. and Marquinez, J.: The influence of environmental and lithologic factors on rockfall at a regional scale: an evalua-tion using GIS, Geomorphology, 43, 117–136, 2002.
Dussauge-Peisser, C., Helmstetter, A., Grasso, J. R., Hantz, D., Desvarreux, P., Jeannin, M., and Giraud A.: Probabilistic ap-proach to rock fall hazard assessment: potential of historical data analysis, Nat. Hazards Earth Syst. Sci., 2, 15–26, 2002, http://www.nat-hazards-earth-syst-sci.net/2/15/2002/.
Ercanoglu, M.: Investigation of possible modes of instability and preparation of instability map of andesites in Altindag (Ankara) settlement region, MSc Thesis, Hacettepe University (in Turkish, unpublished), 1997.
Ercanoglu, M. and Gokceoglu, C.: Assessment of landslide suscep-tibility for a landslide-prone area (North of Yenice, NW Turkey) by fuzzy approach, Environ. Geol., 41, 720–730, 2002. Ercanoglu, M. and Aksoy, H.: Potential instability map for rock
slopes at Ankara Castle and vicinity, Yerbilimleri (in Turkish), 29, 97–114, 2004.
Ercanoglu, M. and Gokceoglu, C.: Use of fuzzy relations to pro-duce landslide susceptibility map of a landslide prone area (West Black Sea Region, Turkey), Eng. Geol., 75, 229–250, 2004. Erentoz, C.: 1/15000 scaled Turkey Geological Map, Ankara
Re-gion, MTA Press, (in Turkish), 1975.
Erol, O.: Tectonic development of Ankara region. Bulletin of TJK, (in Turkish), 7, 57–85, 1961.
Evans, S. and Hungr, O.: The assessment of rockfall hazard at the base of talus slopes, Canadian. Geotechnical Journal, 30, 620– 636, 1993.
Glade, T. and Crozier, M. J.: A review of scale dependency in land-slide hazard and risk analysis, in: Landland-slide Hazard and Risk, edited by: Glade, T., Anderson, M., and Crozier, M. J., Part 3, John Wiley&Sons, 75–138, 2005.
Gokceoglu, C., Sonmez, H., and Ercanoglu, M.: Discontinuity con-trolled probabilistic risk maps of the Altindag (settlement) region in Turkey, Engineering Geology, 55, 277–296, 2000.
Gorsevski, P. V., Gessler, P. E., and Jankowski, P.: Integrating a fuzzy k-means classification and a Bayesian approach for spatial prediction of landslide hazard, J. Geog. Syst., 5, 223–251, 2003.
Guzzetti, F., Reichenbach, P., and Wieczorek, G. F.: Rockfall haz-ard and risk assessment in the Yosemite Valley, California, USA, Nat. Hazards Earth Syst. Sci., 3, 491–503, 2003,
http://www.nat-hazards-earth-syst-sci.net/3/491/2003/.
Hantz, D., Vengeon, J. M., and Dussauge-Peisser, C.: An historical, geomechanical and probabilistic approach to rock-fall hazard as-sessment, Nat. Hazards Earth Syst. Sci., 3, 693–701, 2003, http://www.nat-hazards-earth-syst-sci.net/3/693/2003/.
ISRM (International Society for Rock Mechanics): Rock Charac-terization, Testing and Monitoring-ISRM Suggested Methods, Pergamon Press, Oxford, 211 pp, 1981.
Jaboyedoff, M. and Labiouse, V.: Preliminary assessment of rockfall hazard based on GIS data, ISRM 2003 – Technology roadmap for rock mechanics, South African Institute of Mining and Metallurgy, 575–578, 2003.
Karacan, E. and Kasapoglu, K. E.: An investigation on the fractures and joints in the Ankara andesites, Yerbilimleri, (in Turkish), 13, 63–75, 1986.
Kasapoglu, K. E.: Ankara Kenti Zeminlerinin Jeoteknik ¨Ozellikleri ve Depremselligi, TMMOB Jeoloji M¨uhendisleri Odası Yayını, No, 54, Ankara, 2000.
Krause, J. P., Mock, R., and Gheorghe, A. V.: Assessment of risks from technical systems: integrating fuzzy logic into the Zurich Hazard Analysis method, Int. J. Environ. Pollut., 5, 2/3, 1995. Matlab (6.5): The language of Technical Computing, Fuzzy Logic
Toolbox, 2002.
Matterocking (2.0): Users’s Guide, Open report, Quanterra, http: //www.quanterra.org, 24 p., 2002.
Negnevitsky, M.: Artificial Intelligence: a guide to intelligent sys-tems, Addison-Vesley, Harlow, England, 2002.
Petje, U., Ribicic, M., and Mikos, M.: Computer simulation of stone falls and rockfalls, Acta geographica Slovenica, 45–2, 93– 120, 2005.
Resources Inventory Committee: Guidelines and standards for Ter-rain Mapping in British Columbia, Res. Inv. Ctee, Victoria, BC, Canada, 1996.
Ross, T. J.: Fuzzy Logic with Engineering Applications, Mc-Graw-Hill, New Mexico, 1995.
Surfer (Ver. 8): Golden Software Inc., Colarado, USA, 2002. Wieczorek, G. F., Morrissey, M. M., Iovine, G., and Godt, J.:
Rock-fall Hazards in the Yosemite Valley, U.S. Geological Survey Open-file report 98–467, scale 1:12 000, 7, 1998.
Zadeh, L. A.: Fuzzy sets, Information and Control, 8, 338–353, 1965.