Endogenous Retinoic Acid Signaling
Marie Paschaki1, Carole Schneider1, Muriel Rhinn1, Christelle Thibault-Carpentier2, Doulaye Dembe´le´2, Karen Niederreither1, Pascal Dolle´1*
1Developmental Biology and Stem Cells Department, Institut de Ge´ne´tique et de Biologie Mole´culaire et Cellulaire (IGBMC), Centre National de la Recherche Scientifique (Unite´ Mixte de Recherche 7104), Institut National de la Sante´ et de la Recherche Me´dicale (Unite´ 964), Universite´ de Strasbourg, Illkirch-Strasbourg, France,2Biochips platform, Institut de Ge´ne´tique et de Biologie Mole´culaire et Cellulaire (IGBMC), Centre National de la Recherche Scientifique (Unite´ Mixte de Recherche 7104), Institut National de la Sante´ et de la Recherche Me´dicale (Unite´ 964), Universite´ de Strasbourg, Illkirch-Strasbourg, France
Abstract
Retinoic acid (RA), an active derivative of the liposoluble vitamin A (retinol), acts as an important signaling molecule during embryonic development, regulating phenomenons as diverse as anterior-posterior axial patterning, forebrain and optic vesicle development, specification of hindbrain rhombomeres, pharyngeal arches and second heart field, somitogenesis, and differentiation of spinal cord neurons. This small molecule directly triggers gene activation by binding to nuclear receptors (RARs), switching them from potential repressors to transcriptional activators. The repertoire of RA-regulated genes in embryonic tissues is poorly characterized. We performed a comparative analysis of the transcriptomes of murine wild-type andRetinaldehyde Dehydrogenase 2null-mutant (Raldh22/2) embryos — unable to synthesize RA from maternally-derived retinol — using Affymetrix DNA microarrays. Transcriptomic changes were analyzed in two embryonic regions: anterior tissues including forebrain and optic vesicle, and posterior (trunk) tissues, at early stages preceding the appearance of overt phenotypic abnormalities. Several genes expected to be downregulated under RA deficiency appeared in the transcriptome data (e.g.Emx2,Foxg1anteriorly,Cdx1,Hoxa1,Rarbposteriorly), whereas reverse-transcriptase-PCR and in situ hybridization performed for additional selected genes validated the changes identified through microarray analysis. Altogether, the affected genes belonged to numerous molecular pathways and cellular/organismal functions, demonstrating the pleiotropic nature of RA-dependent events. In both tissue samples, genes upregulated were more numerous than those downregulated, probably due to feedback regulatory loops. Bioinformatic analyses highlighted groups (clusters) of genes displaying similar behaviors in mutant tissues, and biological functions most significantly affected (e.g. mTOR, VEGF, ILK signaling in forebrain tissues; pyrimidine and purine metabolism, calcium signaling, one carbon metabolism in posterior tissues). Overall, these data give an overview of the gene expression changes resulting from embryonic RA deficiency, and provide new candidate genes and pathways that may help understanding retinoid-dependent molecular events.
Citation:Paschaki M, Schneider C, Rhinn M, Thibault-Carpentier C, Dembe´le´ D, et al. (2013) Transcriptomic Analysis of Murine Embryos Lacking Endogenous Retinoic Acid Signaling. PLoS ONE 8(4): e62274. doi:10.1371/journal.pone.0062274
Editor:Michael Schubert, Laboratoire de Biologie du De´veloppement de Villefranche-sur-Mer, France
ReceivedNovember 21, 2012;AcceptedMarch 19, 2013;PublishedApril 24, 2013
Copyright:ß2013 Paschaki et al. This is an open-access article distributed under the terms of the Creative Commons Attribution License, which permits unrestricted use, distribution, and reproduction in any medium, provided the original author and source are credited.
Funding:This work was supported by grants from the Agence Nationale de la Recherche (ANR Neurosciences 2007, ANR Blanc 2011) and the Fondation pour la Recherche Me´dicale (Equipe FRM 2007), and by institutional funds from the Centre National de la Recherche Scientifique (CNRS) and Institut National de la Sante´ et de la Recherche Me´dicale (INSERM). The funders had no role in study design, data collection and analysis, decision to publish, or preparation of the manuscript.
Competing Interests:The authors have declared that no competing interests exist.
* E-mail: dolle@igbmc.fr
Introduction
Retinoic acid (RA), an active derivative of the liposoluble vitamin A, is an endogenous signaling molecule involved in many biological processes in vertebrates. This small hydrophobic compound is the ligand for a subfamily of nuclear receptors, the retinoic acid receptors (RAR)a,bandc(NR1B1, B2 and B3), that belong to the group of nuclear receptors heterodimerizing with RXRs. The RAR-RXR dimers bind to DNA motifs called RA-response elements (RAREs), typically composed of two short similar sequences (‘‘direct repeats’’, DR) with a spacer element of varying length (DR1, 2, 5 or 8). Although functional RAREs have yet been characterized in a relatively small number of genes [1,2], it is estimated that several hundred genes may harbor such elements [3]. RAR/RXR dimers are able to bind RAREs in the absence of ligand and – at least on some of their target promoters
–, can have a repressive function by interacting with corepressors that silence transcription through epigenetic mechanisms (ref. [4] for a review). RA binding leads to a conformational change in the receptor structure, leading to a switch from a repressing to a transcriptionally activating state. The distribution and availability of RA in various cell populations therefore has to be tightly controlled by enzymatic mechanisms.
spatial RA distributions are critical for the establishment and patterning of the hindbrain segments (the rhombomeres), whereas more caudally, RA has been implicated in the regulation of the symmetrical progression of somitogenesis, and in early neurogenic events in the neural tube (the prospective spinal cord) [8,9,10,11] (refs. [12,13,14] for reviews). Other early embryonic functions have been reported for development of the segmented pharyngeal apparatus (the branchial arches), and in cell populations giving rise to the heart [15,16,17,18].
The distribution of RA among cell populations is controlled by specific enzymatic pathways. Embryos from placental species obtain vitamin A in the form of retinol transferred from the maternal circulation through the embryonic yolk sac – and eventually the placenta [19,20]. Oviparous species store retinol and/or carotenoids in the egg yolk. Retinol reaching the embryo can be oxidized to retinaldehyde by two classes of enzymes (alcohol and retinol dehydrogenases: ADHs, RDHs), whereasb -carotenoids are cleaved byb-carotene-15,159oxygenases (BCOs) (refs. [21,22,23,24] for reviews). Critical for the production of RA is the presence of specific retinaldehyde dehydrogenases (RALDHs). Three such enzymes have been characterized, all of which being expressed according to distinct temporal and spatial (tissue-specific) patterns during development. Interestingly, there is a temporal window during which RALDH2 is the only RALDH to be expressed in the early embryo, and all the functions mentioned above have indeed been ascribed to this enzyme. This phase goes from gastrulation to early somitic stages, during whichRaldh2gene expression is first induced in the embryonic node and newly formed mesoderm, and then persists at specific anterior-posterior axial levels in several mesodermal derivatives [6,25]. Analysis of murine Raldh22/2 null mutants harboring a RA-activatable reporter transgene has demonstrated the absence of any detectable RA activity throughout the embryo at these early stages [26].
Raldh2expression is transiently seen at early somite stages (E8.0– E8.5 in the mouse) in head tissues, including the anteriormost neuroectoderm destined to form the anterior forebrain and optic vesicles [27], and knockout mutation of Raldh2 affects morpho-genesis of these structures [28,29]. The second nextRaldhgene to be expressed isRaldh3, whose transcripts first appear by E8.5 in head structures (prospective nasal region, eye, and otocyst), and at trunk levels in the mesonephric duct (embryonic kidney) [30,31]. AlthoughRaldh22/2mouse mutants have been used in a large set of studies for unravelling the consequences of a lack of RA signaling in early developmental processes, there is still a poor understanding of the molecular events leading to the realization of the RA-deficiency phenotypes. Genes abnormally expressed in the
Raldh22/2 embryos were usually identified through in situ hybridization studies using molecular markers of the affected structures, and there has been no attempt to globally analyze gene expression changes at the transcriptomic level. As this mutant is a good model for analyzing embryos developing under RA deficiency, we decided to perform an Affymetrix DNA microarray study to compare the transcriptomes of wild-type andRaldh22/2
embryos. We searched for gene expression changes in two regions of the embryo: the anterior head and forebrain region, and more posterior (‘‘trunk’’) tissues, as these correspond to two distinct – both temporally and spatially – phases of RALDH2-dependent RA signaling. The tissue samples were collected at such stages that RA deficiency was installed in the corresponding region (as documented, for instance, by the analysis of a RA-sensitive transgene; see Fig. 1), although early enough for morphological phenotypic abnormalities to be minimal in the mutant embryos. The resulting data provide a global view on genes affected in their expression by a state of embryonic RA deficiency, and highlight
possible gene networks involved in the resulting phenotypic defects, as bioinformatic clustering analysis identified several groups of genes displaying similar behaviors in the mutant tissue samples. More generally, this study confirms the pleiotropic effects of RA signaling in regulating many classes of gene products, some of which belong to critical pathways that will help explain the developmental consequences of a deficiency in this signal.
Results and Discussion
Experimental design
Two sets of samples were used for analyzing transcriptome changes in Raldh22/2 embryos. The rostral part of the head (including the anterior forebrain, optic vesicles, and overlying tissues), was collected from wild-type and mutant embryos at the 14 somite stage. This stage was chosen according to the expression
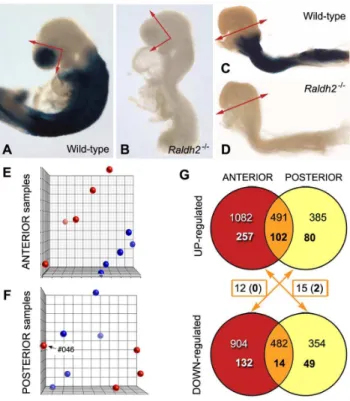
Figure 1. Description of the samples analyzed and summary of the microarray results.(A–D) Profile views of mouse embryos (wild-type: A, C;Raldh22/2mutants: B, D) at the stages chosen for analysis. The embryos are not from the experimental series, but were collected from litters harboring a retinoic acid-sensitive (RARE-hsp68-lacZ) reporter transgene and processed for X-gal analysis, thereby illustrating the absence of detectable RA activity in the mutants. The collected samples were the anterior head region of 14 somite stage embryos (X-gal-labelled in control embryos, section planes illustrated by arrows: A, B) and the posterior region (X-gal-labelled in control embryos, section plane illustrated by arrows: C, D) of 4 somite stage embryos. (E, F) Principal component analysis illustration of ANT and POST data sets. Wild-type samples are depicted by blue dots, andRaldh22/2samples by red dots. For anterior tissues, wild-type and Raldh22/2 samples segregate in two distinct groups. In the case of posterior tissues, one Raldh22/2 sample (#046) did not cluster with the others, and was
excluded from subsequent analyses. (G) VENN diagrams summarizing the numbers of genes showing statistically significant different expression levels, with a fold change of 61.2 (upper numbers) or 61.5 (lower, bold numbers). The numbers of genes exhibiting a ‘‘contradictory’’ behavior (upregulated in one type of samples, and downregulated in the other, as pointed out by the arrows) are also given.
profiles of Raldh genes in head tissues of wild-type embryos: it shortly follows the phase of peakRaldh2mRNA expression at 8-10 somites [27], while RALDH2 protein is still detectable [29], whereas Raldh3 mRNA expression, first detected at the 10–12 somite stage, has not yet intensified. It is unlikely that RALDH3 significantly participates to RA synthesis in the head at the stage of analysis, and – as described in a previous study [29] – we confirmed by analyzingRaldh22/2mutants carrying the RARE-hsp68-lacZtransgene [32], that there was no detectable activity of thelacZreporter at the 14 somite stage (Fig. 1A, B). The tissues collected for analysis included the optic cup and the forebrain neuroepithelium located more rostrally (prospective telencepha-lon), as well as the overlying tissues (frontonasal region including the olfactory placode). These samples are referred to thereafter as ‘‘anterior’’ (ANT) tissues.
The posterior tissues were analyzed at the 4 somite stage, and samples were collected from a transverse section plane excluding all tissues from the level of the first branchial arch (Fig. 1C, D). At this stage RA has numerous documented effects (see Introduction), however Raldh22/2 embryos do not yet exhibit morphological deficiencies (see Fig. 1D) – but they can be recognized by trained eyes by the presence of smaller somites and an abnormally shaped heart tube. As expected from previous work [26], there was no detectable activity of the RARE-hsp68-lacZ transgene in the mutant embryos at this stage (Fig. 1D). These samples will be referred to as ‘‘posterior’’ (POST).
Microarray analysis and statistical tests
Total RNA was extracted from individual samples using the RNAeasy micro Kit (Qiagen), and RNA quality was assessed with a 2100 Bioanalyzer (Agilent). Samples that displayed a RNA Integrity Number (RIN) greater than 9.0 were selected for each condition, and 5 mutant and 5 wild-type samples for each tissue type (ANT and POST) were processed on Affymetrix GeneChip Mouse Gene 1.0 ST arrays. The chips were washed and stained in the GeneChip Fluidics Station 450, and scanned with the GeneChip Scanner 3000 7G (Affymetrix). Raw data (.CEL Intensity files) were extracted from the scanned images using the Affymetrix GeneChip Command Console (AGCC) version 3.1. One of the Raldh22/2 POST samples displayed a high background after hybridization and could not be used for analysis. Altogether, CEL Intensity files from 5 wild-type and 5Raldh22/2
ANT samples, and 5 wild-type and 4Raldh22/2POST samples, were processed for statistical analysis. CEL files were analyzed with the Partek Genomics Suite 6.5 software. After principal component analysis (PCA), the mutant ANT samples clearly segregated from the corresponding wild-type (WT) samples (Fig. 1E), showing relevant transcriptional differences between both groups. Unex-pectedly, one of the POST Raldh22/2 samples (#046) did not cluster with the three other mutant samples (Fig. 1F). Statistical studies were performed including or excluding this sample, in order to calculate its impact on the differentially expressed genes. Genes retained for further analysis had a hybridization signal value above 5 (20th percentile of all expression values) in at least one sample. Genes were considered as differentially expressed if the false discovery rate (FDR) from Benjamini and Hochberg test was under 0.1. Among the 35556 probe sets represented in the microarrays, about 10% of the genes were excluded from further analysis because of their low expression level and/or FDR above 0.1 (corresponding to a p-value above 0.05 for ANT samples, or 0.03 for POST samples).
Overview of differentially expressed genes
Using as a threshold the p-values defined above by Partek analysis, 7177 genes were differentially expressed in wild-type vs. mutant ANT tissue samples (3437 upregulated, 3740 downregu-lated in mutants; p#0.05). When POST samples were analyzed by omitting the dubious Raldh22/2 sample (#046, Fig. 1F), 4133 genes were found to be differentially expressed (1834 upregulated, 2299 downregulated in mutants; p#0.03). When analysis was performed including sample#046, 3120 genes were significantly upregulated (24.5% gene loss), and only 1610 genes appeared downregulated (30% gene loss). Thus, as predicted by PCA, inclusion of sample #046 biased the statistical tests, and data mining was performed with this sample excluded.
In both the ANT and POST microarray experiments, the large majority of genes were affected by fold changes (FC) lesser than 2 fold (only 104 genes with FC.2, and 30 genes with FC,22, in
Raldh22/2vs. wild-type ANT samples; 42 genes with FC.2 and 82 genes with FC ,22, in Raldh22/2 vs. wild-type POST samples). VENN diagrams in Fig. 1G show gene numbers obtained for two cut-offs at61.2 FC (upper lines) and61.5 FC (lower lines, numbers in bold). The 1.2 FC cut-off yielded comparable numbers of genes up- or downregulated in each experiment, with lower numbers of downregulated genes. Furthermore, there were almost 500 genes upregulated in both the ANT and POST Raldh22/2 tissue samples, and nearly as many genes downregulated in both Raldh22/2 tissue samples. These lists were reduced to 102 genes up-regulated in common, and 14 genes down-regulated in common, at 61.5 FC. Remarkably, the numbers of ‘‘contradictory’’ genes (being upregulated in one tissue and downregulated in the other) was extremely low (0 and 2 contradictory genes above 1.5 FC; Fig. 1G). Table 1 provides a list of the most severely downregulated genes, and details on contradictory genes are provided as supplementary online information (Table S1). A graphic illustration of the differentially expressed genes is also shown (Fig. 2).
Down-regulated genes include known RA-dependent genes
As RARs behave as transcriptional activators in the presence of their ligand, down-regulation of retinoid target genes is expected to occur in tissues deficient in RA synthesis. We analyzed the lists of downregulated genes to see whether genes already known to be downregulated in theRaldh2mutant, or more generally reported in the literature as being RA-dependent, were detected in our microarray experiments. Several genes shown in previous studies to be downregulated inRaldh22/2embryos (usually using whole-mount in situ hybridization) [6,26,33,34,35] were also found downregulated in the POST microarray experiment. These include Rarb, Pax6, Hoxa1 (all ,22), Meox1 (21.68), and Cdx1
(21.40). Additional RA targets were reduced in the POST experiment, although excluded from the filtered list due to their p-values, including Neurog2 (21.24) [36], Olig2 (21.78) and Tbx5
(21.33) [18].Stra6, encoding a membrane protein interacting with retinol-binding protein (RBP) and originally characterized as a RA-induced gene in P19 embryonal carcinoma cells [37,38] and
reduced in posterior tissue samples. Nkx3-1 is a RA-inducible target in prostate cancer cells [41].
Several genes previously shown be reduced in the forebrain of
Raldh22/2 embryos [29] were also downregulated in our ANT microarray data, for instance Dll1 (21.31), Foxg1 (21.42) and
Emx2 (21.56). Thus, a good overall correlation between our transcriptomic data and previous analyses ofRaldh22/2embryos (typically by non quantitative in situ hybridization) confirms the validity and reproducibility of these studies.
Microarray analysis provides new candidate genes for the RA-deficiency phenotypes
When considering the list of genes exhibiting the highest changes in expression levels inRaldh22/2embryos (Table 1), some interesting candidates emerged as being potentially involved in the RA-deficiency phenotype. The most highly downregulated genes in anterior tissues encode Id4 (inhibitor of DNA binding 4), a regulator of neural stem cell proliferation and differentiation [42], the signal transducer and activator of transcription Stat4, and the TBP associated factor Taf9b. Among the most severely downreg-ulated genes are also the Ephrin receptor gene Epha3, the neuropilin/tolloid-like gene Neto2, and the gene encoding fatty acid-binding protein 7 (Fabp7 or brain-type Fabp). The Nr2e1
gene, encoding the orphan nuclear receptor Tlx, was also strongly downregulated in anterior tissues. A previous study pointed to Tlx as being involved in the regulation of theRarbgene in the eye [43]. The SRY-box genes Sox1 (21.66) and, to a lesser extent, Sox3
(21.26), were also downregulated according to the ANT microarray experiment.
Retinoids orchestrate the differentiation and patterning of the posterior neural tube (the developing spinal cord) [7,13], accompanied by induction of a posterior transcriptional signature previously analyzed in the spinal cord at an early fetal stage [44]. Our analysis of posterior embryonic tissues (see Table 1) confirmed many known caudal neuronal targets, includingPax6,
Hoxa1,Dbx1, a homeobox gene involved in spinal cord interneu-ron specification [45] and Lhx1, a LIM-homeodomain protein regulating gastrulation, renal organogenesis, and other embryonic functions [46]. Of note, theLhx1homologueLhx2was
downreg-ulated in both ANT (21.60) and POST (21.45) tissues. Novel downregulated genes includedSfrp5, encoding a secreted antag-onist of Wnt signaling [47], and Nepn (Nephrocan), encoding an inhibitor of TGFbsignaling [48]. Other significant reduced targets includeDmrt2 (doublesex and mab-3 related transcription factor 2), involved in somitogenesis and early myogenesis [49],Myf5(a regulator of early myocytic lineage decisions), Metrn (encoding Meteorin, a secreted protein controlling neuritogenesis and angiogenesis in glial precursors [50]), Unc5a(encoding a Netrin receptor involved in spinal cord development [51]), Tcf15
(encoding the basic helix-loop-helix protein Paraxis involved in presomitic mesoderm differentiation [52]), andRfx6(encoding a winged helix transcription factor required for pancreatic develop-ment [53]).
While a deficiency in embryonic RA should primarily result in lack of activation of RA/RAR inducible genes, feedback mechanisms may lead to upregulation of genes which may also be relevant for the resulting phenotypes. Among the highest upregulated genes were two genes coding for basic helix-loop-helix proteins,Bhlhe40and Bhlhe41– also known as Sharp2and Sharp1
[54].Bhlhe40was first reported under the name ofStra13, as a RA-inducible gene promoting neuronal differentiation in P19 cells [55]. It was therefore unexpected to see it upregulated in vivo in
Raldh22/2embryonic tissues. For this reason we includedBhlhe40
among the set of genes for which additional analyses (quantitative RT-PCR and in situ hybridization) were performed to confirm the expression changes (see below). Other transcription factor-coding genes were upregulated inRaldh22/2samples, namely theHairy/
Enhancer-of-Split-related gene Hey2, the winged-helix protein-coding gene FoxO3, the zinc finger protein-coding gene Egr1
(formerly known as Krox24), and the orphan nuclear receptor RORa gene (Rora). Other upregulated genes included the Rras
proto-oncogene coding for the R-Ras GTPase, the Ccng2 gene coding for cyclin G2 – which is regulated at the mRNA level by FoxO3 [56], and theVldlr(very low density lipoprotein receptor) gene, the latter protein also acting as a Reelin receptor during development [57]. Genes encoding ligands or modulators of specific signaling pathways (e.g. Efna3, Fgf11, Igfbp1, Vegfa) were also present in the list. A detailed analysis of the main genetic and Figure 2. Volcano plots representing corrected p-values (ordinates,2log10 scale) from Student t-test of the mRNA levels compared in wild-type andRaldh22/2samples anterior (A) and posterior (B) embryonic tissue samples.Genes with a fold change (abscissae) higher
Table 1.Most severely downregulated genes inRaldh22/2tissue samples.
DOWN in ANTERIOR TISSUES(1)
Symbol Name Function
Id4 Inhibitor of DNA binding 4 Regulation of transcription and cell proliferation, brain, hippocampus development
Stat4 Signal transducer and activator of transcription 4 Regulation of transcription and cell proliferation, signal transduction
Taf9b Taf9b, TBP-associated factor Regulation of transcription
Mfsd2 Major facilitator superfamily domain containing 7B Unknown
Car3 Carbonic anhydrase 3 Lyase activity
Epha3 Eph receptor A3 Transmembrane receptor, protein kinase
Rhag Rhesus blood group-associated A glycoprotein Ammonium transmembrane transporter
Syt11 Synaptotagmin XI Calcium transmembrane transporter
Ptprz1 Protein tyrosine phosphatase, receptor type Z, polypeptide 1
Axonogenesis
Cpa2 Carboxypeptidase A2 Metallocarboxypeptidase
Neto2 Neuropilin (NRP) and tolloid (TLL)-like 2 Membrane receptor
Gm9983 Predicted gene 9983 Unknown
Mfsd7b Major facilitator superfamily domain containing 7B Head, digits, and spleen development
Fabp7 Fatty acid binding protein 7, brain Lipid transport, forebrain neurogenesis
Slfn9 Schlafen 9 Unknown
Jakmip2 Janus kinase and microtubule interacting protein 2 Kinase, microtubule interacting protein
Slc4a1 Solute carrier family 4 (anion exchanger), member 1 Anion exchanger transport
Nr2e1 Nuclear receptor 2E1 (Tlx) Regulation of transcription, brain and eye development
Idi1 Isopentenyl-diphosphate delta isomerase Steroid and carotenoid biosynthesis
Lonrf2 LON peptidase N-terminal domain and ring finger 2 Unknown
DOWN in POSTERIOR TISSUES(2)
Symbol Name Function
Arg1 Arginase Arginase activity
1700011H14Rik Unknown Unknown
Rarb Retinoic acid receptor beta Transcriptional regulation, embryogenesis, neurogenesis
Nepn Nephrocan Negative regulation of transcription and of TGFbreceptor signaling
Hnf1b HNF1 homeobox B Regulation of transcription, inner cell mass differentiation, anterior-posterior patterning, hindbrain development
Dbx1 Developing brain homeobox 1 Regulation of transcription, spinal cord interneuron specification
Rfx6 Regulatory factor X, 6 Regulation of transcription, pancreatic development
Pax6 Paired box gene 6 Regulation of transcription, brain, eye, spinal cord development,
neurogenesis
Hoxa1 Homeobox gene A1 Regulation of transcription, hindbrain development, anterior-posterior patterning, inner ear morphogenesis
Nxf3 Nuclear RNA export factor 3 mRNA export
Gm10785 Unknown Unknown
Unc5a Unc-5 (C. elegans) homolog A Membrane receptor, apoptosis, signal transduction
Maob Monoamine oxidase B Oxidoreductase
Lhx1 LIM homeobox protein 1 Regulation of transcription, ectoderm/endoderm formation, pattern
specification, nervous system and urogenital development
Slc16a12 Solute carrier family 16 (monocarboxylic acid transporters), member 12
Symporter activity
Olig2 Oligodendrocyte transcription factor 2 Regulation of transcription, oligodendrocyte specification
Fgfr4 Fibroblast growth factor receptor 4 Membrane receptor, tyrosine kinase
Sfrp5 Secreted frizzled-related sequence protein 5 Extracellular modulator of Wnt signaling, foregut endoderm and mesoderm development
Cpa1 Carboxypeptidase A1 Metallopeptidase, proteolysis
regulatory pathways emerging from the transcriptomic analysis of RA-deficient embryos is presented below.
Retinoid targets regulating stem cell lineages
Our transcriptomic analysis has uncovered some novel RA targets regulating neuronal stem cell lineages, and whose deficiency might explain forebrain abnormalities in Raldh22/2
embryos. Id4, Tlx, and Sox1 are all reduced in ANTRaldh22/2
tissues. The mutant embryos exhibit dramatic reductions in telencephalon neuroepithelium growth, a defect previously pro-posed to be due to reduced fibroblast growth factor (FGF) and Sonic hedgehog signaling [29]. Retinoid regulation of gene targets in stem cells could also stunt cerebral growth. Interestingly, Id4
regulates lateral expansion of the proliferative zone in the developing cortex [42] by facilitating self-renewal and proliferation of neural stem cells [58]. Tlx maintains neural stem cells in an undifferentiated, proliferative state [59], whereasSox1-expression marks activated neural progenitors. Sox1 also functions to maintain cortical progenitors in an undifferentiated state by suppressing cell cycle exit to neurogenesis [60]. Collectively, Id4, Tlx, and Sox1 reductions may be sufficient to affect forebrain development by hindering neural stem cell growth. Neural stem cells may consequently undergo premature differentiation, ex-plaining why we observe increased levels ofSox10[29] andBhlhe40
in Raldh22/2 forebrains. Reduced FGF signaling and cyclin D levels [29] could be a consequence, and not the cause, of reduced progenitor growth. In another study we have shown that Raldh2
loss of function reduces expansion and differentiation fetal spinal cord-derived neural stem cells [44]. Our ongoing work using neurosphere assays indicates that neural stem cells are similarly
affected in the forebrain of 14 somite-stageRaldh22/2 embryos (M.P. et al, unpublished data).
Retinoic acid is commonly used as an inducer of neuronal differentiation in various tissue culture cell lines. Remarkably, retinoids can differentiate embryonic stem (ES) cell-derived embryoid bodies to a relatively pure stem cell lineage known as radial glia [61]. Radial glial cells are found at the earliest stages of CNS development and play an important role in cortical expansion. An in vivo role of retinoids in promoting this lineage, though, has never been shown. Two players in the radial glia lineage, Pax6 and Fabp7, are both reduced in ANT Raldh22/2 tissues. Pax6 maintains the proliferative capacity and develop-mental potential of radial glia stem cells [62], whereas Fabp7 (also known as Brain Lipid Binding Protein, BLBP) is a structural marker also required for the establishment of the radial glia fiber system in the developing brain [63].
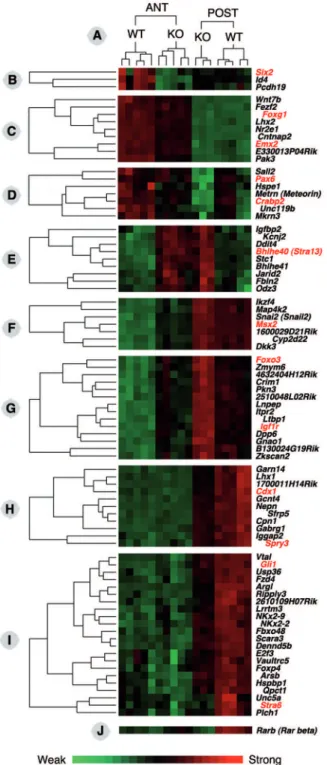
Clustering analysis of gene expression changes in Raldh22/2embryos
To obtain a more global view of the gene expression changes detected in the Raldh22/2 embryos, we performed clustering analysis using the Cluster 3 software [64]. An overview of the entire clustering analysis is provided as online supporting information in the form of a heat map (Figure S1), and selected gene clusters are shown in Figure 3. A green-to-red scale (Fig. 3, bottom) illustrates the gene expression changes between samples, from lowest (bright green) to highest (bright red) relative levels. The clustering analysis further validated our experimental samples, as WT and mutant (KO) samples segregated into distinct clusters, with no co-segregation of any WT and KO sample (Fig. 3A).
Table 1.Cont.
DOWN in ANTERIOR and POSTERIOR TISSUES(3)
Symbol Name Function
DOWN in ANTERIOR and POSTERIOR TISSUES(3)
Symbol Name Function
Apba2 Amyloid beta (A4) precursor protein-binding, family A, member 2
Neuronal adaptor protein, synaptic transmission
Ap1s3 Adaptor-related protein complex AP-1, sigma 3 Intracellular protein transport, endocytosis
Ccnb1ip1 Cyclin B1 interacting protein 1 Blastocyst formation, organ growth, meiosis and spermatid development, apoptosis
Ccne1 Cyclin E1 Cyclin-dependent protein kinase, cell cycle control
Csn3 Casein kappa Oocyte meiosis, lactation
Elovl2 Elongation of very long fatty acids-like 2 Lipid biosynthesis
Kbtbd8 Kelch repeat and BTB (POZ) domain containing 8 Unknown
Pmm2 Phosphomannomutase 2 Mannose biosynthesis
Ptprz1 Protein tyrosine phosphatase, receptor type Z Extracellular matrix protein, hydrolase, neuritogenesis
Rrp12 Ribosomal RNA processing 12 (S. cerevisiae) homolog Unknown
Snhg1 Small nucleolar RNA host gene Unknown
Tmem56 Transmembrane protein 56 Unknown
Trmt61a tRNA methyltransferase 61 homolog A tRNA methyltransferase activity
Pinx1 (2610028A01Rik) PIN2/TERF1 interacting, telomerase inhibitor 1 Telomere maintenance, nucleic acid and protein binding
(1)Genes listed by decreasing fold change in expression, ranging from23.3 to21.9. (2)Genes listed by decreasing fold change in expression, ranging from
24.5 to21.7.
(3)Genes listed alphabetically, fold change in expression,21.5 in both the ANT and POST microarrays.
Such analysis allows us to pinpoint genes exhibiting similar behaviors (in terms of variation in expression levels) among the analyzed samples. As a first example, theId4and protocadherin 19 (Pcdh19) genes clustered withSix2, being selectively downregulated in anterior tissue samples (Fig. 3B). Interestingly also, theFoxg1
and Emx2 genes – both described as downregulated in the forebrain ofRaldh22/2 embryos [29] – were found in the same cluster (Fig. 3C). This cluster also included a Wnt gene (Wnt7b), the LIM/homeobox gene Lhx2, and the nuclear receptor gene
Nr2e1. Another interesting cluster contained thePax6andCrabp2
genes (Fig. 3D). Unlike the former ones, genes from this cluster were downregulated in both anterior and posterior Raldh22/2
tissues samples, while their expression levels were higher in anterior tissues (both in WT and KO situations). Such a behavior is not surprising, asPax6andCrabp2are highly expressed in most of the tissue (forebrain and optic vesicle) constituting the ANT samples. The cluster also included Sall2 (a drosophila Spalt
homologue), Unc119b, Mkrn3 (Makorin), and Metrn (Meteorin). Another cluster grouped the Msx2 homeobox gene, a Snail homologue (Snai2), a Dickkopf homologue (Dkk3), an Ikaros family gene (Ikzf4), and the Map kinase geneMap4k2, all being relatively mildly downregulated in ANT samples (Fig. 3F).
Genes from the cluster containingFoxo3and the IGF receptor geneIgf1r, on the other hand, were upregulated in both the ANT
Figure 4. Microarray validation by quantitative real-time RT-PCR (Q-RT-PCR). Genes were selected according to their different expression profiles as detected by microarray analysis of wild-type (WT) and Raldh22/2 embryos. Among these, one gene (Pax6) was
chosen as a ‘‘control’’, as its expression had already been shown to be affected in Raldh22/2 embryos (see main text for details and interpretation of the data). Expression levels are expressed as values normalized with respect toGapdh(a housekeeping gene) mRNA levels (WT samples, blue bars;Raldh22/2samples, red bars). Data (mean
6 SEM) were analyzed with Student t-test; ***, p,0.001; **, p,0.01; *, p,0.05.
doi:10.1371/journal.pone.0062274.g004
Figure 3. Details of the gene expression profiles obtained after hierarchical clustering of the experimental samples by relative gene expression level analysis. Eight clusters (panels B–I) have been extracted from the overall clustering analysis (available as additional online information, Figure S1), showing differential gene expression behaviors according to the experimental samples (ANT, RNA from anterior tissues; POST, RNA from posterior tissues; WT, wild-type embryos; KO, Raldh22/2 embryos). Gene expression profiles are illustrated as a heat map (green: weak expression; red: strong expression – see scale below). The expression profile of theRarbgene is also shown (panel J), which did not cluster with any other gene. This analysis further validated the experimental samples, as WT and KO samples segregated into fully distinct clusters, both for the ANT and POST tissue samples (panel A above).
and POST Raldh22/2 samples, although globally they were expressed at higher levels posteriorly (Fig. 3G). This 14 gene cluster also contained the chordin-like gene Crim1, the latent TGFb-binding protein geneLtbp1, the zinc finger protein genes
Zkscan2 and Zmym6, as well as 3 unannotated Riken gene transcripts.
Two examples of genes exhibiting selective downregulation in the POSTRaldh22/2 tissue samples are shown. In the first one, the RARE-containing gene Cdx1 clusters with Lhx1, Sfrp5, the nephrocan (Nepn) gene, and the gene encoding the FGF pathway inhibitor Sprouty3 (Spry3) (Fig. 3H). The second one includesGli1, encoding a transcriptional effector of Hedgehog signaling shown to be downregulated inRaldh22/2embryos [6]. This gene clusters withStra6and several other potentially interesting genes, including two NKx genes (NKx2-2and2-9), the Frizzled homologueFzd4, the forkhead protein-coding geneFoxp4,Ripply3(encoding a Tbx1 repressor), andUnc5a(encoding a Netrin receptor).
Finally, the gene encoding RARb(Rarb), a direct RA-inducible gene containing a functional RARE [65] was not included in any gene cluster (Fig. 3J). This behavior could be linked to its weak expression in all anterior tissue samples, whereas downregulation was clearly seen in posterior samples.
Selected gene analysis by quantitative RT-PCR and in situ hybridization
Some genes were selected to perform real-time quantitative reverse transcriptase-PCR (Q-PCR) analysis in order to validate the changes detected by the microarray experiments. We focused on Pax6, expected to be downregulated both in anterior and posterior tissues of Raldh22/2 embryos, Id4, Six2 and Stat4 as examples of genes identified by microarray analysis as being downregulated anteriorly, andLhx2, Crabp2, Ikzf1andUnc5a,that were scored as being downregulated in both regions of the mutant embryos. We also sought to confirm the upregulation of certain genes identified by microarray analysis, mainly forBhlhe40(Stra13) which, as discussed above, was not expected to be upregulated in the RA-deficient embryos. Creb5 (encoding a cAMP-responsive element binding protein) was chosen as an example of a gene with
different behavior in anterior (slightly downregulated) versus posterior (upregulated) tissues.
Overall, the Q-PCR experiments showed a clear correlation with the changes observed by microarray analysis (Fig. 4). Of note, the Id4 and Six2 genes, that were scored as downregulated anteriorly in the microarray experiments, were also shown to be downregulated in posterior tissues by Q-PCR analysis, although with a lesser fold change than in anterior tissues. This could be explained by the higher sensitivity of the Q-PCR technique. The same observation was made forStat4, which was downregulated posteriorly – to a lesser extent than in anterior tissues – according to Q-PCR analysis, whereas microarray analysis only revealed an anterior downregulation. In agreement with the microarray data, theBhlhe40gene was markedly upregulated, both in anterior and posterior tissues, according to Q-PCR results. Whereas Q-PCR showed a downregulation ofCreb5in anterior tissues ofRaldh22/2
embryos, there was no significant change in transcript levels in posterior tissues.
Thus, for the selected genes the Q-PCR analysis tended to validate the microarray data. In particular, all genes that were scored as downregulated in the microarray analysis were confirmed by Q-PCR, the latter method often revealing a downregulation in the two types of tissue samples – while microarrays sometimes showed a change only in one type of samples. This points to some limitations in the sensitivity of DNA microarrays, implying that some genes identified as mildly downregulated could in fact be more severely affected in the mutant embryos.
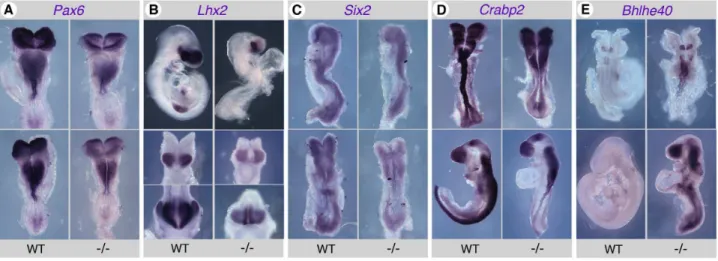
We further attempted to document changes in expression by another technique, in situ hybridization (ISH). These experiments confirmed alterations in transcript levels and/or tissue distribution for some of the genes studied. Consistent with previous reports [29,34],Pax6 was downregulated in the caudal neural plate, as well as in more anterior regions of the developing neuroepithe-lium, including the forebrain, in early somite stage (E8.5)
Raldh22/2 embryos (Fig. 5A). Lhx2 was downregulated in the forebrain of Raldh22/2 embryos, and was undetectable in posterior tissues expressing the gene in control embryos (Fig. 5B). An overall decrease of the Six2 ISH signal was observed in
Figure 5. Validation of gene expression changes inRaldh22/2embryos by in situ hybridization (ISH).A subset of the genes analyzed by
Q-PCR yielded detectable signals when performing ISH with antisense riboprobes. Although less sensitive than Q-PCR, this technique allows to analyze mRNA tissue distributions. See main text for an interpretation of the data. Embryos are shown at the 4–6 somite stage forPax6(A: upper panels, ventral views; lower panels, dorsal views),Lhx2(B: central panels) andSix2(C: upper panels, profile views; lower panels, dorsal views), E9.5 for Lhx2(B: upper panels, profile views; lower panels, forebrain frontal views), 6–7 somite stage (upper panels) and early limb bud (lower panels) stages forCrabp2(D), 6 somite stage (upper views) and E9.5 (lower views) forBhlhe40(E). WT: wild-type embryos;2/2:Raldh22/2embryos.
Raldh22/2embryos (Fig. 5C).Crabp2was downregulated along the developing neural tube and caudal neural plate in early somite stage mutants (Fig. 5D, upper panels), and at later stages was also undetectable in neural crest-derived branchial arches cell popu-lations (Fig. 5D, lower panels). Remarkably,Bhlhe40upregulation was also documented in Raldh22/2 embryos by ISH. At early somite stages, higher expression was detected in the hindbrain rhombomeres and extended ectopically along the neural tube (Fig. 5E, upper panels), whereas at later stages an abnormally high expression was observed in most regions of the embryo (Fig. 5E, lower panels). ISH experiments performed withId4,Stat4,Ikzf1or
Unc5aprobes did not yield any consistent signal, either in wild-type or inRaldh22/2embryos.
In summary, the changes detected by microarray analysis were for the most part confirmed by Q-PCR for selected genes, and could be documented at the tissue level for some of the genes by ISH. The latter technique has a limited sensitivity, as mRNA detection does not use an amplification step like in RT-PCR, and its readout is qualitative rather than quantitative. It is therefore not unexpected that some gene expression changes documented by transcriptome analysis and Q-PCR may not be visualized through ISH.
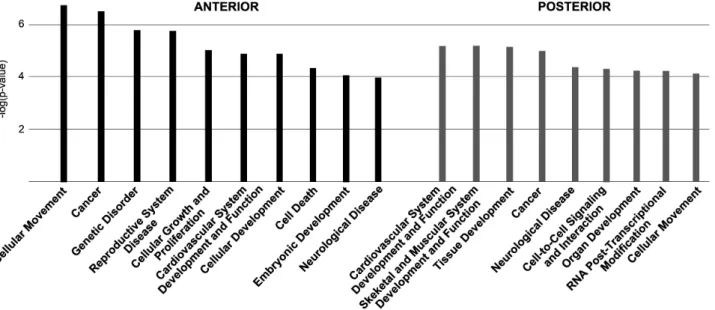
Bioinformatic analysis of the transcriptomic data To get further insight into the cellular functions and classes of molecules that may be affected by RA deficiency, we performed an overall analysis of the transcriptome alterations using the Ingenuity Pathway Analysis (IPA) software. Figure 6 gives an overview of the main biological functions (with the more significant and therefore low p-values according to Ingenuity analysis) associated with the transcriptome ofRaldh22/2embryos. These functions are clearly relevant as they relate to general developmental processes (Cellular Development, Embryonic Development, Organ Development), or more specific phenomenons for which retinoid signaling has already been implicated (Cardiovascular System Development, Skeletal and Muscular System Development for the POST microarray experiment). Inclusion of more basic biological functions (Cell-to-Cell Signaling and Interaction, Cellular Move-ment, Cellular Growth and Proliferation), as well as disease-related categories (Cancer, Neurological Disease, Genetic Disorder, Reproductive System Disease) are also not surprising considering the known effects of retinoids on cell growth and their use in clinical trials for chemotherapy or prevention of certain cancers [66]. These observations prompted us to further analyze the types Figure 6. Overview of the main biological and physiological functions correlating with the affected genes inRaldh22/2embryos.The
functions are listed by decreasing order of statistical significance [2log(p-values)] of differentially expressed and misregulated genes as calculated by the Ingenuity software. Left side (black bars): ANT microarray data; right side (gray bars): POST microarray data.
doi:10.1371/journal.pone.0062274.g006
of molecules and the molecular pathways affected by embryonic RA deficiency.
When the transcriptome data were sorted according to the subcellular localization of the corresponding proteins, there was an over-representation of nuclear proteins (mainly at the expense of cytoplasmic proteins) among genes affected in the POST microarray experiment (Fig. 7A). All major classes of molecules were represented among the sets of affected genes, both for the ANT and POST experiments (Fig. 7B). Notably, there was an over-representation of transcriptional regulators among affected genes in the POST experiment, whereas translational regulators were under-represented when compared to the ANT data set. A list of genes/proteins involved in transcriptional regulation and identified as down-regulated in the ANT and POST microarray experiments is provided as supplementary online information (Table S2).
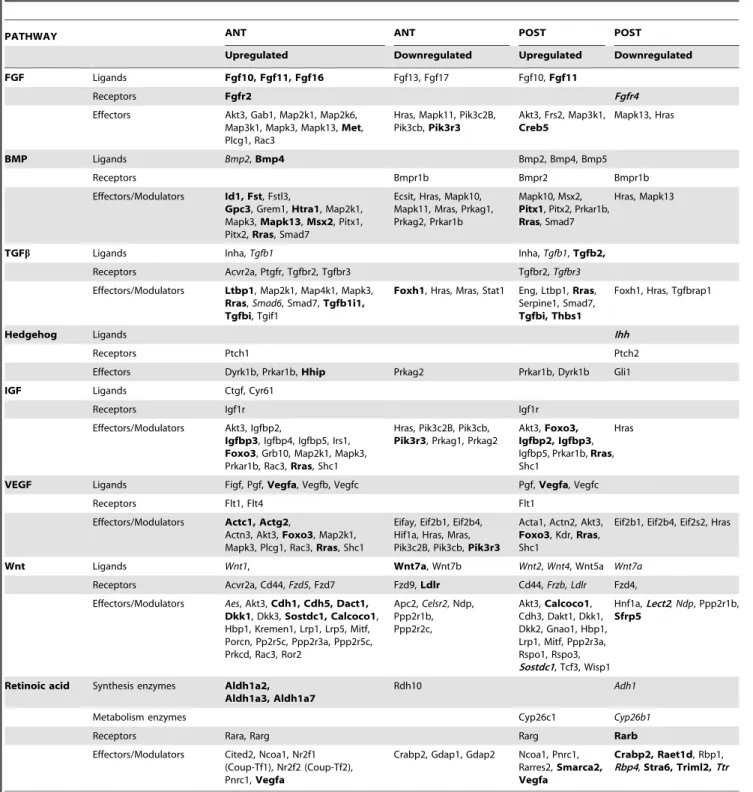
Molecular pathways affected in Raldh22/2embryos Alteration of retinoic acid signaling has already been shown to interfere with several signaling pathways within the embryo (refs. [22,67,68] for reviews). Often the changes were described as changes in expression levels of ligands, such as FGFs [8,9], Wnts [69] or TGFb [70]. In the case of the Sonic hedgehog (Shh) pathway, no change in ligand expression was observed in head or posterior embryonic tissues of Raldh22/2 mutant embryos, although expression of effectors of this pathway was altered [6,29]. Analysis of the transcriptomic data provides a more global overview of the molecular pathways that may be affected under conditions of embryonic RA deficiency. A graphic summary of the main pathways identified by Ingenuity analysis is provided in Figure 8. The molecular pathways are listed by decreasing order of statistical significance as they appear through analysis of the ANT (left-side list) and POST (right-side list) data sets. The six ‘‘top’’
(most significant) pathways for each data set are highlighted in gray, and additional pathways relevant for development are also illustrated. The numbers of genes downregulated (green bars) or upregulated (red bars) are illustrated (upper bars: ANT transcrip-tomic data; lower bars: POST transcriptranscrip-tomic data).
As observed through the analysis of biological functions, several ‘‘top’’ pathways emerging from the ANT microarray data are related to nervous system development or function (axonal guidance, Reelin signaling, Notch signaling, synaptic long term potentiation, dopamine receptor signaling). Although some of these phenomenons take place at later developmental stages than those analyzed, their presence in the top list is easily explained as they contain genes also acting during early embryogenesis. The main molecular pathways identified by the analysis of POST microarray data are more varied, encompassing categories with large numbers of molecules (pyrimidine metabolism, purine metabolism, protein ubiquitination), and more specific pathways with a highly significant p-value, but with much fewer misregu-lated genes. For instance, the ‘‘role of Oct4 in pluripotency’’ pathway appeared among the top pathways with only 5 downregulated genes (Foxa1, Foxd3, Hoxb1, prohibitin Phb, and Polycomb group ring finger Pcgf6). The ‘‘calcium signalling’’ pathway was characterized by the presence of 24 upregulated (vs. 1 downregulated) genes, including those encoding alpha 1 (skeletal muscle) actin (Acta1), cardiac myosin light chain 3 (Myl3) and heavy chain 7 (Myh7), calcium/calmodulin-dependent protein kinase IG (Camk1g), Creb5, Nfatc4, Nfat5, and the histone deacetylase genesHdac5andHdac8. Inclusion of the ‘‘one carbon (folate) metabolism’’ pathway among the most significantly affected ones may reveal a novel retinoid function, so far poorly studied, although some evidence for a regulation of this pathway by retinoids emerges from metabolomic studies in embryonic stem cells (L.J. Gudas, personal communication). The downregulated Figure 8. Summary diagram of the major molecular pathways emerging from Ingenuity analysis of theRaldh22/2transcriptome.The
molecular pathways are listed by decreasing order of statistical significance as they appear through analysis of the ANTERIOR (left-side list) and POSTERIOR (right-side list) data sets. The most significant pathways identified for each data set are highlighted in gray. Additional pathways relevant for developmental processes are also listed. A graphic representation of the numbers of genes downregulated (green) or upregulated (red) in anterior (upper bars) or posterior (lower bars)Raldh22/2embryonic tissue samples (fold change
genes includeDhfr(dihydrofolate reductase) andMthf1(methylene tetrahydrofolate dehydrogenase). Furthermore, the folate receptor-coding geneFolr1was markedly downregulated (22.35), although with a p-value.0.05. Another potentially interesting pathway is that relating to CHK proteins in cell cycle control, which contained 7 downregulated genes, includingCdc25a, genes coding
for E2F transcription factors 3 and 4 (E2f3, E2f4), Replication factor C3 (Rpc3), and Replication protein A1 (Rpa1).
Many of the signaling pathways acting during early embryo-genesis appeared with a high significance value in the bioinfor-matic analysis of the transcriptomic data. This supports the idea of complex RA-dependent regulatory events, and ‘‘cross-talks’’ between the retinoid and other embryonic signaling pathways.
Table 2.Genes acting in selected signaling pathways and misregulated inRaldh22/2tissue samples (ANT: anterior samples; POST: posterior samples).
PATHWAY ANT ANT POST POST
Upregulated Downregulated Upregulated Downregulated
FGF Ligands Fgf10, Fgf11, Fgf16 Fgf13, Fgf17 Fgf10,Fgf11
Receptors Fgfr2 Fgfr4
Effectors Akt3, Gab1, Map2k1, Map2k6,
Map3k1, Mapk3, Mapk13,Met, Plcg1, Rac3
Hras, Mapk11, Pik3c2B, Pik3cb,Pik3r3
Akt3, Frs2, Map3k1,
Creb5
Mapk13, Hras
BMP Ligands Bmp2,Bmp4 Bmp2, Bmp4, Bmp5
Receptors Bmpr1b Bmpr2 Bmpr1b
Effectors/Modulators Id1, Fst, Fstl3,
Gpc3, Grem1,Htra1, Map2k1, Mapk3,Mapk13,Msx2, Pitx1, Pitx2,Rras, Smad7
Ecsit, Hras, Mapk10, Mapk11, Mras, Prkag1, Prkag2, Prkar1b
Mapk10, Msx2,
Pitx1, Pitx2, Prkar1b,
Rras, Smad7
Hras, Mapk13
TGFb Ligands Inha,Tgfb1 Inha,Tgfb1,Tgfb2,
Receptors Acvr2a, Ptgfr, Tgfbr2, Tgfbr3 Tgfbr2,Tgfbr3
Effectors/Modulators Ltbp1, Map2k1, Map4k1, Mapk3,
Rras,Smad6, Smad7,Tgfb1i1, Tgfbi, Tgif1
Foxh1, Hras, Mras, Stat1 Eng, Ltbp1,Rras, Serpine1, Smad7,
Tgfbi, Thbs1
Foxh1, Hras, Tgfbrap1
Hedgehog Ligands Ihh
Receptors Ptch1 Ptch2
Effectors Dyrk1b, Prkar1b,Hhip Prkag2 Prkar1b, Dyrk1b Gli1
IGF Ligands Ctgf, Cyr61
Receptors Igf1r Igf1r
Effectors/Modulators Akt3, Igfbp2,
Igfbp3, Igfbp4, Igfbp5, Irs1,
Foxo3, Grb10, Map2k1, Mapk3, Prkar1b, Rac3,Rras, Shc1
Hras, Pik3c2B, Pik3cb,
Pik3r3, Prkag1, Prkag2
Akt3,Foxo3, Igfbp2, Igfbp3, Igfbp5, Prkar1b,Rras, Shc1
Hras
VEGF Ligands Figf, Pgf,Vegfa, Vegfb, Vegfc Pgf,Vegfa, Vegfc
Receptors Flt1, Flt4 Flt1
Effectors/Modulators Actc1, Actg2,
Actn3, Akt3,Foxo3, Map2k1, Mapk3, Plcg1, Rac3,Rras, Shc1
Eifay, Eif2b1, Eif2b4, Hif1a, Hras, Mras, Pik3c2B, Pik3cb,Pik3r3
Acta1, Actn2, Akt3,
Foxo3, Kdr,Rras, Shc1
Eif2b1, Eif2b4, Eif2s2, Hras
Wnt Ligands Wnt1, Wnt7a, Wnt7b Wnt2,Wnt4, Wnt5a Wnt7a
Receptors Acvr2a, Cd44,Fzd5, Fzd7 Fzd9,Ldlr Cd44,Frzb, Ldlr Fzd4,
Effectors/Modulators Aes, Akt3,Cdh1, Cdh5, Dact1, Dkk1, Dkk3,Sostdc1, Calcoco1, Hbp1, Kremen1, Lrp1, Lrp5, Mitf, Porcn, Pp2r5c, Ppp2r3a, Ppp2r5c, Prkcd, Rac3, Ror2
Apc2,Celsr2, Ndp, Ppp2r1b, Ppp2r2c,
Akt3,Calcoco1, Cdh3, Dakt1, Dkk1, Dkk2, Gnao1, Hbp1, Lrp1, Mitf, Ppp2r3a, Rspo1, Rspo3, Sostdc1, Tcf3, Wisp1
Hnf1a,Lect2, Ndp, Ppp2r1b,
Sfrp5
Retinoic acid Synthesis enzymes Aldh1a2, Aldh1a3, Aldh1a7
Rdh10 Adh1
Metabolism enzymes Cyp26c1 Cyp26b1
Receptors Rara, Rarg Rarg Rarb
Effectors/Modulators Cited2, Ncoa1, Nr2f1 (Coup-Tf1), Nr2f2 (Coup-Tf2), Pnrc1,Vegfa
Crabp2, Gdap1, Gdap2 Ncoa1, Pnrc1, Rarres2,Smarca2, Vegfa
Crabp2, Raet1d, Rbp1, Rbp4,Stra6, Triml2,Ttr
Interestingly, among the top (most significant) pathways listed for the ANT transcriptomic data, two were not the major candidates that would be predicted from the literature: VEGF signaling and ILK signaling. ThreeVegfgenes (Vegfa,Vegfb,Vegfc), as well as the Platelet-derived growth factor C (Pdgfc) and Placental growth factor (Pgf) genes, appeared among the genes upregulated in both pathways (see Table 2 for a full list of misregulated genes in the VEGF signaling pathway). CDK5 and JAK/Stat signaling were also among the highest significant pathways in ANT tissues. Most affected genes in this category also appear as effectors in other pathways (see Table S2 for details). It is noteworthy to mention
Stat4 as markedly downregulated (23.07), Stat1 more mildly downregulated (21.24), andStat2,Stat5bandStat6upregulated in ANT tissues of mutants.
Table 2 gives details on genes misregulated belonging to several major embryonic signaling pathways (FGF, BMP, TGFb, Hedge-hog, IGF, Wnt/beta-catenin, and the retinoid pathway itself). In most cases the affected genes encoded for a subset of the ligands, more exceptionally a receptor (Fgfr2upregulated in ANT tissues,
Bmpr1bandBmpr2, respectively downregulated and upregulated in POST tissues), and various effectors of the pathway (including
Mapk genes acting in several pathways). While severalFgf genes were upregulated (Table 2), Fgf8, previously shown to be
upregulated in RA-deficient embryos [8,9,10] was not picked up by the microarray analysis, an explanation being that the shift in theFgf8mRNA gradient [71] only occurs in a small region of the
Raldh22/2 embryos (the anteriormost presomitic mesoderm). Upregulation of several Bmp genes – the highest for Bmp4 in ANT tissues, is also noteworthy. Within the TGFbpathway there were a majority of upregulated genes, both in ANT and POST tissues. This is consistent with a previous study which identified the TGFbpathway as being abnormally upregulated and involved in the phenotypic abnormalities observed during early embryonic lung development [70]. The Hedgehog signaling pathway exhibited the smallest numbers of misregulated genes (6 in ANT tissues, 4 in POST tissues), reflecting the small number of genes (28) included in this category, and included Gli1 (previously identified as downregulated inRaldh22/2 embryos: ref. [6]) and Indian hedgehog (Ihh, downregulated in POST tissues).
In summary, this bioinformatic analysis confirmed that retinoic acid deficiency affects the regulation of genes involved in a wide range of molecular pathways. Remarkably, the main develop-mental signaling pathways previously implicated as being retinoid-dependent (FGF, TGFb/BMP, Hedgehog, Wnt; refs. [22,67,68] for reviews) do not appear as the top pathways in terms of statistical significance, hence the analysis summarized in Fig. 8
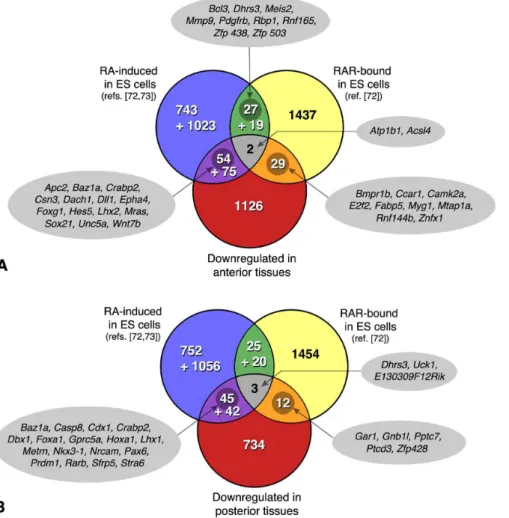
Figure 9. VENN diagrams summarizing a cross-comparison of the genes downregulated inRaldh22/2embryos (A, anterior tissues; B, posterior tissues) with those identified as RAR-bound by ChIP-seq analysis of embryonic stem (ES) cells differentiating as embryoid bodies (ref.[72]), and those induced after RA treatment of embryoid bodies.This analysis distinguished early RA-responsive genes (2 h after RA exposure: upper numbers; ref. [72]), from those identified at a later stage of differentiation (4 days post-RA treatment: lower numbers; ref. [73]). Some selected genes are highlighted in the intersecting data sets.
provide new information on metabolic processes or signaling pathways that may deserve further investigation.
Cross-comparison of in vivo (embryonic) data with results from genomic and transcriptomic screens in embryonic stem cells
Several recent studies have used differentiating murine ES cells as a model for analyzing transcriptomic changes occurring after RA treatment [72,73,74], and/or for analysis of genomic loci bound by RARs, using large-scale chromatin immunoprecipitation (ChIP-ChIP or ChIP-seq) techniques [72,75,76]. We decided to perform a cross comparison of such studies, to identify which, among the genes downregulated inRaldh22/2embryos, may also have been identified as being RA-inducible, or RAR-bound according to ChIP data, in differentiating ES cells. This comparison was performed with the data of Moutier et al., who reported the most extensive set of RAR-bound loci, identifying 6628 RAR occupied loci in ES cells grown for 4 days as embryoid bodies (EBs) and treated for 2 h with RA [72]. To narrow down the cross-comparison, their genomic list was restricted to loci in which the RAR-occupied sites were located within65 kilobases (Kb) from the transcription start site. These authors also performed a comparative transcriptomic (RNA-seq) analysis of EBs grown for 4 days and treated (or not treated) with RA, identifying 824 RA-induced transcripts [72]. We further used the data of Kim et al., who identified by Affymetrix array analysis 1202 gene transcripts upregulated in ES cells driven to a neural phenotype after exposure to RA from day 4 to 8 in a 12-day suspension culture [73]. Unekama et al. also reported transcrip-tional signatures of EBs driven to neural differentiation, and here we used their data set of 147 genes induced at day 8 of differentiation, after RA treatment from day 2 to 6 [74].
Figure 9 provides an overview of this comparative analysis in the form of Venn diagrams. An immediate major conclusion is that there are very limited overlaps between the sets of genes identified in this study, and those described as RA-inducible or RAR-bound in ES cells. Indeed there were only 31 (,2.2%) of the genes downregulated in anterior tissues, and 15 (,1.8%) of those downregulated in posterior tissues of Raldh22/2 embryos, that were tagged as RAR-bound by Moutier et al. [72]. Also, only 4% of the ‘‘anteriorly-affected’’ genes, and 5.5% of the ‘‘posteriorly-affected’’ genes appeared in the RNA-seq data of Moutier et al., i.e. behave as early RA-inducible genes in EBs. Additional genes were found by comparing our data to those of Kim et al. [73] and Akanuma et al. [74], which correspond to transcriptional signa-tures at a later stage of neural differentiation (2–4 days after the RA treatment). The complete gene lists are available as online supporting information (Table S3).
Surprisingly, only a handful (2 and 3 genes, respectively) were common to the three data sets, i.e. were RA-inducible and RAR-bound in ES cells, and affected anteriorly or posteriorly in
Raldh22/2embryos (Fig. 9). Whereas the anteriorly affected genes did not obviously appear as ‘‘developmental’’ genes (Atp1b1, ATPase, Na/K transporter b1 polypeptide; Acsl4, acyl-coA synthetase family member 4), the retinaldehyde dehydrogenase/ reductase geneDhrs3[39] was one such gene affected posteriorly. It may indeed be a key gene for feedback mechanisms regulating retinoid levels, both in the embryo and in cell systems. The few other genes common between our lists and the RAR-bound loci included several interesting candidates, namely the gene encoding fatty acid-binding protein (Fabp) 5 – identified in other cell systems as a regulator of the anti-apoptotic and proliferative response to RA [77]), or genes encoding the BMP receptor Bmpr1b, the cell cycle regulator Ccar1, and zinc finger (Znfx1, Zfp428) or ring
finger (Rnf144b) proteins. Examples of genes downregulated in
Raldh22/2embryos, and reported as early RA-responsive in ES cells [72], are given in Fig. 9. While these include several known RA-target genes (described above), they highlight additional genes whose misregulation may be relevant for the RA-deficiency phenotypes.
Analysis ofcis-regulatory elements in downregulated genes
Lastly, we used another bioinformatic approach to assess whether the genes defined here as being RA-dependent in the early embryo, may share other common regulatory features. We used the oPOSSUM online resource and database (refs. [78,79]; http://opossum.cisreg.ca/oPOSSUM3/) to perform this analysis. The oPOSSUM single site analysis (SSA) tool allows to identify over-represented transcription factor binding sites (TFBS) in specific sets of genes, giving scores to assess over-representation either at the gene level, or at the TFBS occurrence level. We interrogated the oPOSSUM database for SSA analysis on two sets of genes, corresponding to the most severely downregulated genes (FC,21.5) in anterior or posteriorRaldh22/2tissues (146 and 63 genes, respectively). A summary of the retrieved data is provided in Table 3. Interestingly, the first ranked transcription factor (highest Z-score) for posteriorly downregulated genes is the RAR:RXR DR5 dimer. While this result further tends to validate our transcriptomic data, the corresponding gene hits were only 8, which includedDhrs3,Meox1,Metrn,Rarb, andStra6. This finding would suggest that only a small fraction of the genes identified as downregulated in our study, are actually direct targets of RAR:RXR regulation.
Among other transcription factors with overrepresented binding sites are several forkhead factors (Foxa1, Foxa2 posteriorly, Foxa1, Foxd1, Foxd3, Foxo3 anteriorly). Binding sites for high mobility group (SRY-related or Sox) factors were also amongst the most overrepresented. Unlike RAR:RXR binding sites, these yielded very high numbers of hits, both in terms of gene numbers (in all cases.50% of the genes analyzed) and of TFBS identified (up to 782 per gene; see Table 3). This abundance probably reflects an overinflation of putative TFBS, often encountered with bioinfor-matic search engines, when the TFBS consensus is defined as a relatively short and degenerate sequence. The same conclusion was drawn for most of the homeodomain proteins identified in this search (e.g. Nobox, NKx2.5, Pdx1 or Hoxa5, all of which appeared with high Z-scores for both the anterior and posterior gene sets, and yield up to.1000 TFBS hits). This clearly points to a limitation of the search engine. However, and despite this overinflation, we would conclude that TFBS bioinformatic analysis will help selecting subsets ofRaldh22/2 misregulated genes that may be regulated by specific homeodomain factors. A possible, combinatorial regulation by forkhead (Fox) and Sox proteins will also deserve further investigation.
On the other hand, the TFBS analysis provided several clues on regulation by specific transcription factors, with emerged with high Z-scores on much smaller numbers of putative targets. Noteworthy was the high Z-score of Pax5 and Pax6 for posterior genes (8 and 5 gene hits, respectively;Crabp2,Dbx1,RarbandStra6appearing as putative Pax6 targets). Regulation by Pbx1, a cofactor for Hox genes, was also highlighted for 15 posterior genes (Table 3). These included already documented Hox/Pbx targets such asHoxa1[80] andRarb[81], and pointed toCcne1,Lrg5,Nepn,NKx2-9and3-1or
Rfx6as additional putative targets. A set of 8 genes was defined as putative Brachyury (T) targets; these included Lhx1, Pmm2,
These includedCcne1,Crabp2,Dbx1,Dhrs3,RarbandStra6. Finally, three nuclear receptors were identified through this analysis: NR2F1 (COUP-TF I) as a putative regulator of 17 posterior genes, the PPARc:RXRa dimer, with 22 putative targets among posterior genes, and NR3C1 (glucocorticoid receptor) with 21 identified targets among anterior genes (details on target genes in Table 3).
Altogether, this TFBS database search highlighted the combi-natorial regulation of embryonic RA-dependent genes by several families of transcriptional regulators, while providing strong candidates for the regulation of specific subsets of genes. It also
pointed out to four genes of the RA pathway:Dhrs3,Crabp2,Rarb, andStra6, as key targets for such combinatorial regulation. Conclusion
This study provides an overview of the genes misregulated in early mouse embryos unable to synthesize retinoic acid (RA) from its precursor retinaldehyde, due to targeted gene disruption of a critical biosynthesis enzyme. While highlighting several genes known to be affected by conditions of impaired RA signaling in mouse embryos and/or other animal models, it provides additional candidate genes and pathways that may be relevant to better understand the mechanisms underlying the complex
Table 3.Bioinformatic analysis of putative transcription factor binding sites (oPOSSUM3 single site analysis method) in genes showing the highest downregulation in posterior or anterior tissues ofRaldh22/2embryos.
Transcription factor(c) Family Genehits TFBShits Z-score Transcriptionfactor(c) Family Genehits TFBShits Z-score
RXR:RAR (DR5)(d) Nuclear receptor 8 11 11.40 Nobox Homeodomain 107 679 21.90
MZF1_5-13 bbazinc finger 43 272 10.27 NKx2-5 Homeodomain 124 1566 19.22
Nobox Homeodomain 48 262 9.90 Pdx1 Homeodomain 120 1115 17.73
Foxa1 Forkhead 40 222 8.14 Hoxa5 Homeodomain 123 1574 15.15
Foxa2 Forkhead 40 152 7.84 REST(l) bbazinc finger 6 6 14.66
Pax5(e) Paired domain 8 8 7.78 Prrx2 Homeodomain 109 938 13.98
SRY HMG group 48 328 6.87 Sox9 HMG group 88 379 12.99
NKx2-5 Homeodomain 52 606 6.86 SRY HMG group 112 782 10.28
HNF1B Homeodomain 17 27 6.58 Sox17 HMG group 109 558 10.16
ARID3A Arid 48 494 6.08 NFYA NFY CCAAT binding 51 91 10.02
NR2F1(f)(COUP-TF I) Nuclear receptor 17 23 5.74 Sox5 HMG group 99 554 8.86
STAT1(g) Stat 19 40 5.49 Foxd1 Forkhead 93 496 7.78
HNF1A Homeodomain 14 16 5.36 NKx3-1 Homeodomain 103 530 6.63
Pdx1 Homeodomain 49 418 5.35 Foxd3 Forkhead 85 340 5.86
PBX1(h) Homeodomain 15 25 5.21 Pou5f1 (Oct4)(m) Homeodomain 26 40 5.81
PPARG:RXRA(i) Nuclear receptor 22 40 3.96 Lhx3 Homeodomain 41 88 5.56
Hoxa5 Homeodomain 52 607 3.70 Foxo3 Forkhead 95 537 5.47
T (Brachyury)(j) b-ribbon 8 10 3.63 NR3C1 (GR)(n) Nuclear receptor 21 28 5.12
STAT3 Stat 32 82 3.48 HNF1B Homeodomain 33 54 4.70
Pax6(k) Paired domain 5 6 3.26 Foxa2 Forkhead 82 323 3.97
(a)59 genes analyzed from 63 genes downregulated with FC ,21.5. (b)137 genes analyzed from 146 genes downregulated with FC
,21.5.
(c)The searched region encompassed 5 Kb upstream and 5 Kb downstream of the transcription start site. The top ten factors (highest Z-scores) appear in bold. Additional
transcription factors (below) are the authors’ seelection. (d)Genes with conserved RAR:RXR (DR5) binding sites are:
Csn3, Dhrs3, Fap, Meox1, Metrn, Rarb, Stra6, 5730596B20Rik(NB:5730596B20Rikis an antisense EST found between theHoxa3andHoxa4genes).
(e)Genes with conserved Pax5 binding sites are:Apba2, Crabp2, Lgr5, Mettl1, NKx2-9, Pmm2, Ripply3, Rfx6. (f)Genes with conserved NR2F1 binding sites are:
Apba2, Crabp2, Dhrs3, Dusp9, Fap, Gcsh, Hoxa1, Maob, NKx2-9, Pax6, Prdm13, Rarb, Sfrp5, Stra6, Timm8a1, Tmem56, 1700011H14Rik.
(g)Genes with conserved STAT1 binding sites are:Apba2, Dbx1, Dhrs3, Fap, Hoxa1, Gcsh, Kynu, Lgr5, Meox1, Pax6, Prdm13, Ptprz1, Rarb, Ripply3, Slc25a10, Snora34, Stra6,
Timm8a1, 5730596B20Rik.
(h)Genes with conserved PBX1 binding sites are:Ccne1, Dbx1, Fap, Hoxa1, Kynu, Lgr5, Nepn, Nkx2-9, Nkx3-1, Pax6, Prdm13, Rarb, Rfx6, Ripply3, Tmem56.
(i)Genes with conserved PPARG:RXRA binding sites are:Apba2, Cpn1, Crabp2, Dbx1, Dhrs3, Dusp9, Gcsh, Hoxa1, Lhx1, Meox1, Mtap7d2, Nkx3-1, Pax6, Prdm13, Ptprz1, Rarb,
Sh3bgrl2, Snord118, Stra6, Trmt61a, 1700011H14Rik, 5730596B20Rik. (j)Genes with conserved T binding sites are:
Lhx1, NKx2-9, Pmm2, Prdm13, Stra6, Timm8a1, Trmt61a, 5730596B20Rik. (k)Genes with conserved Pax6 binding sites are:Dbx1, Pax6, Rarb, Stra6, 5730596B20Rik.
(l)Genes with conserved REST binding sites are:Acsl6, Ank1, Cntnap2, Lhx2, Mpped1. (m)Genes with conserved Pou5fI binding sites are:
Abcb10, Acsl6, Ank1, Apba2, Arrdc4, Aven, Cdh20, Cntnap2, Dhrs11, Gas5, Htr3b, Ikzf1, Lhx2, Mrpl18, Muc1, Neto2, Nova1, Nr2e1, Pak3, Pcdh19, Prdm16, Rragb, Shox2, Slc25a21, Taf1d, Wnt7a.
(n)Genes with conserved NR3C1 binding sites are:Cntnap2, Eef1d, Fez1, Hsd17b7, Htr3b, Itgb8, Klf1, Lrcc4, Lhx2, Mpped1, Mrpl20, Nova1, Nsdhl, Pcdh19, Pdss1, Phyhipl,
Pou3f3, Rnf144b, Shox2, Syt11, AI504432.
Transcription factor binding site (TFBS) analysis: genes downregulated in POSTERIOR tissues.(a)
phenotypic consequences of embryonic RA deficiency. Bioinfor-matic analysis confirmed the impact of retinoid deficiency on several signaling pathways, with specific genes misregulated and belonging to the FGF, Notch, BMP, Hedgehog, VEGF, or Wnt pathways. This analysis pointed out to additional pathways or biological functions which, although not previously correlated with retinoid deficiency, appeared in the top (most significant) categories. This provides clues for further exploration of the effect of retinoid deficiency on metabolic processes such as purine and pyrimidine metabolism or one carbon metabolism, on signaling pathways such as the mTOR, ILK and IGF1 pathways, or on protein ubiquitination. Our data also suggest an upregulation of calcium signaling, specific to posterior (trunk) tissues of RA-deficient embryos.
This study adds to a framework of other high-throughput studies that reported RA-dependent transcriptomic alterations [72,73,74,82], or characterization of RAR target gene loci [72,75,76,82], in tissue culture cells including embryonic stem cells. Remarkably, a cross comparison between several data sets revealed that only a small subset of genes downregulated in
Raldh22/2embryos were previously identified as RAR-bound, or RA-inducible, in embryonic stem cells. Future high-throughput genomic/transcriptomic studies, expected to be performed on other retinoid target tissues, should improve our knowledge on retinoid-dependent gene regulation, both during normal develop-mental and physiological processes, and with respect to various diseases including cancer.
Materials and Methods
Ethics statement, mouse lines and embryonic tissue collection
Animal experimentation protocols were reviewed and approved by the Direction De´partementale des Services Ve´te´rinaires (agreement#67–189 dated March 30, 2009) and conformed to the NIH and European Union guidelines, provisions of the Guide for the Care and Use of Laboratory Animals, and the Animal Welfare Act. No invasive (pain-inducing) procedure was used for this study. The mice harbored theRaldh2knockout allele described in ref. [26] and, for the X-gal assays, the RARE-hsp68-lacZ
transgene described in ref. [32]. Pregnant female mice were euthanized after anesthesia with CO2, embryos were collected and
tissue samples were quickly dissected, by sectioning with fine tweezers and freezing in liquid nitrogen. Extra-embryonic membranes were used for genotyping of the embryos.
Microarray hybridization and bioinformatic analysis Total RNA was extracted with the RNAeasy micro Kit (Qiagen) from individual embryonic samples. RNA quality was verified by analysis on a 2100 Bioanalyzer (Agilent), and only samples displaying a RNA Integrity Number (RIN) greater than 9.0 were selected for analysis. Biotinylated single strand cDNA targets were prepared, starting from 300 ng RNA, using the Ambion WT Expression Kit (Cat #4411974) and the Affymetrix GeneChip WT Terminal Labeling Kit (Cat #900671), according to Affymetrix recommendations. For each sample, 1.9mg cDNA was hybridized for 16 h at 45uC on GeneChip Mouse Gene 1.0 ST arrays, containing 35556 probe sets interrogating over 28000 genes represented by 27 probes (25-mer) spread across the full length of the gene. The chips were washed and stained in the GeneChip Fluidics Station 450 (Affymetrix), and scanned with the GeneChip Scanner 3000 7G (Affymetrix). Finally, raw data (.CEL Intensity files) were extracted from the scanned images using the Affymetrix GeneChip Command Console (AGCC) version 3.1.
CEL files were further processed with the Partek genomics suite 6.5 software to obtain principal component analysis (PCA), in order to verify the sample distribution. Genes considered as differentially expressed had a hybridization signal value above 5 (20th percentile of all expression values) in at least one sample. Differential expression was considered significant if the false discovery rate from Benjamini and Hochberg test was under 10%, corresponding to a p-value#0.05 for the ANT data set and#0.03 for the POST data set, determined by student t-test. Selected lists for the ANT and the POST data sets were analyzed with the Ingenuity pathway analysis (http://www.Ingenuity.com) software. The array CEL files were submitted to the NIH Gene Expression Omnibus (GEO) database (accession number GEO: GSE43578).
Real-time quantitative RT-PCR
RT-PCR assays were performed in triplicate on three indepen-dent RNA samples for each tissue type and genotype. RNA extractions were performed as previously described. Oligo-dT primed cDNAs were generated using the Superscript II kit (Invitrogen) according to the manufacturer’s protocol with. Quantitative real-time PCR was achieved using SybrGreen and LightCycler 480 (Roche). The sequences of primers used for the various tested genes are given in Table S4 (online supporting information). Probe sets for detection of mouseGapdh (glyceralde-hyde-3-phosphate dehydrogenase) andActb(beta-actin) were used for normalization. For each sample the ratio between signals for the gene of interest and Gapdh was calculated to normalize concentration values. To verify if genes were differentially expressed, the average of ratios calculated for wild-type and mutant samples were then compared.
In situ hybridization and X-gal staining
Whole-mount in situ hybridization with digoxigenin-labeled riboprobes was performed as described [83], using an Intavis InSituPro robot (for details, see http://www.empress.har.mrc.ac. uk/browser/, Gene Expression section). X-gal assays were performed as described [32].
Supporting Information
Figure S1 Hierarchical clustering of differentially ex-pressed genes.The heatmap shows the gene expression profiles of microarray data sets (upregulated expression: red; downregu-lated expression: green). Importantly, the WT and KO samples segregate into fully distinct clusters according to this analysis. ANT: RNA from anterior tissues; POST: RNA from posterior tissues; WT: wild-type embryos; KO:Raldh22/2embryos. (TIF)
Table S1 Genes exhibiting a ‘‘contradictory’’ behavior in the microarray experiments, i.e. downregulated in one type of tissue samples and upregulated in the other (±1.2 fold change) inRaldh22/2embryos.
(DOC)
Table S2 Genes involved in the process of transcrip-tion/transcriptional regulation and downregulated in Raldh22/2embryos.Genes are listed separately for the ANT and POST microarray experiments. Genes with ,21.5 fold changes appear in bold.
(PDF)